. 2016 Aug 8;30(2):324-336.
doi: 10.1016/j.ccell.2016.06.003. Epub 2016 Jul 14.

Critical Role for CD103(+)/CD141(+) Dendritic Cells Bearing CCR7 for Tumor Antigen Trafficking and Priming of T Cell Immunity in Melanoma

Affiliations

Critical Role for CD103(+)/CD141(+) Dendritic Cells Bearing CCR7 for Tumor Antigen Trafficking and Priming of T Cell Immunity in Melanoma

Edward W Roberts et al. Cancer Cell. .

Abstract

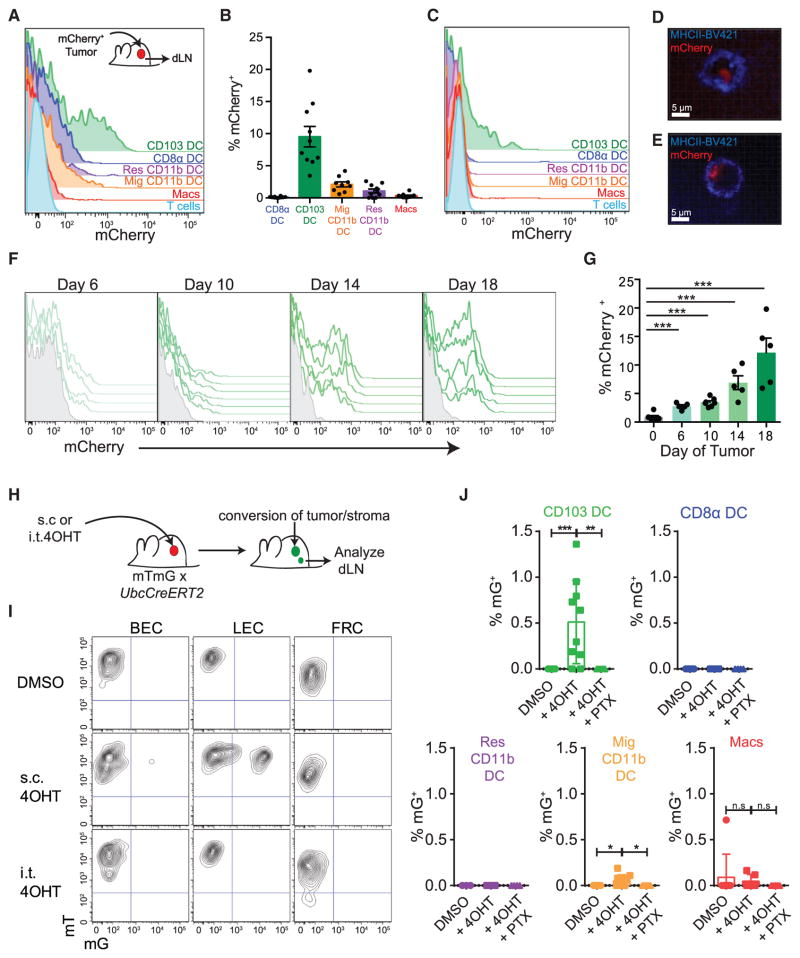
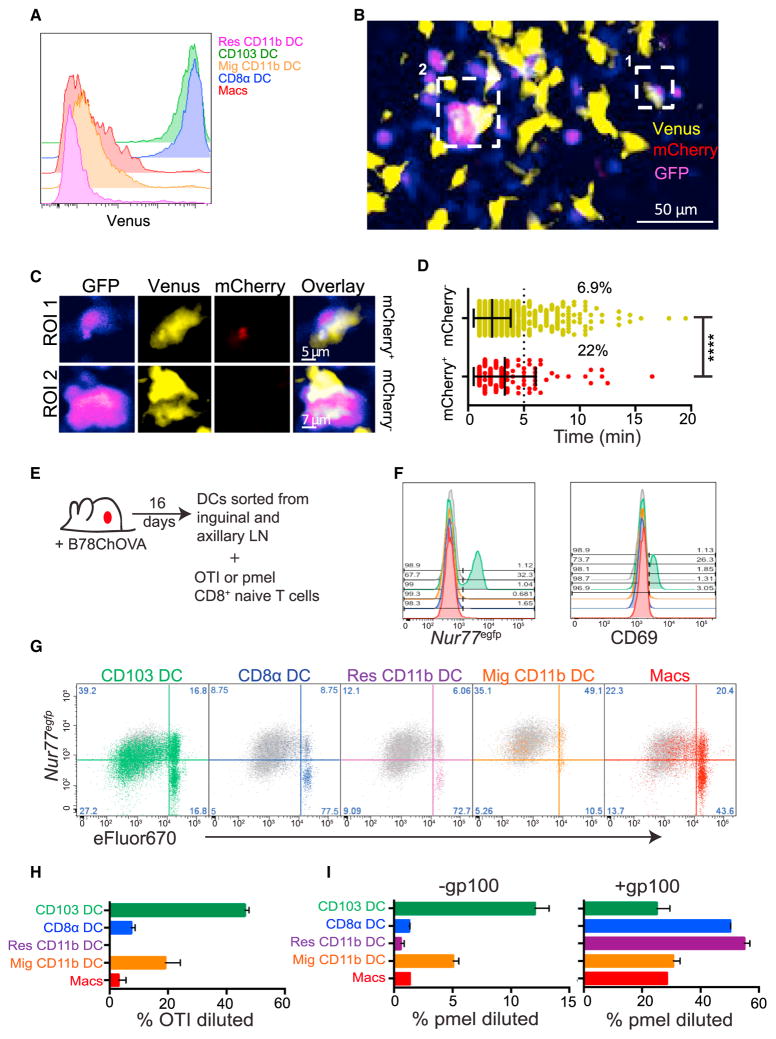
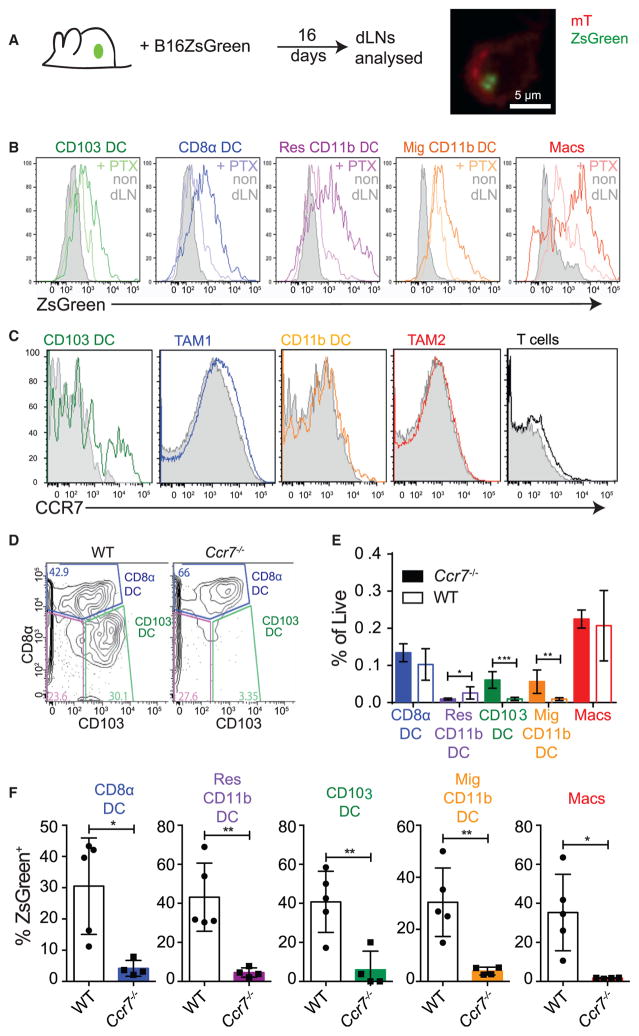
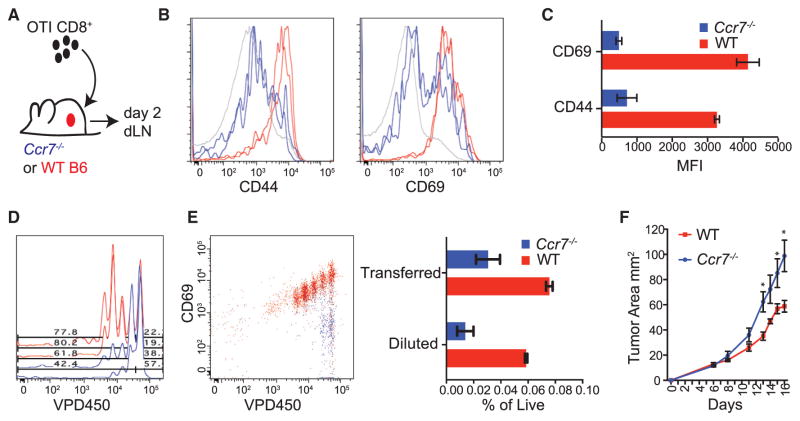
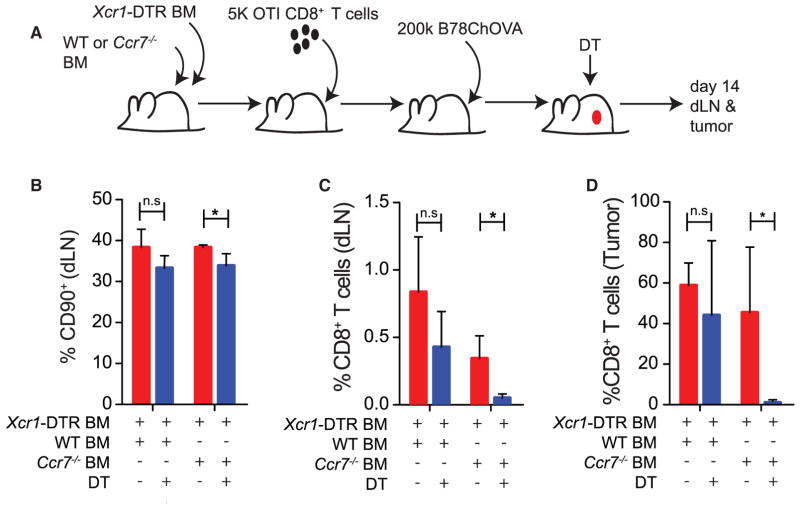
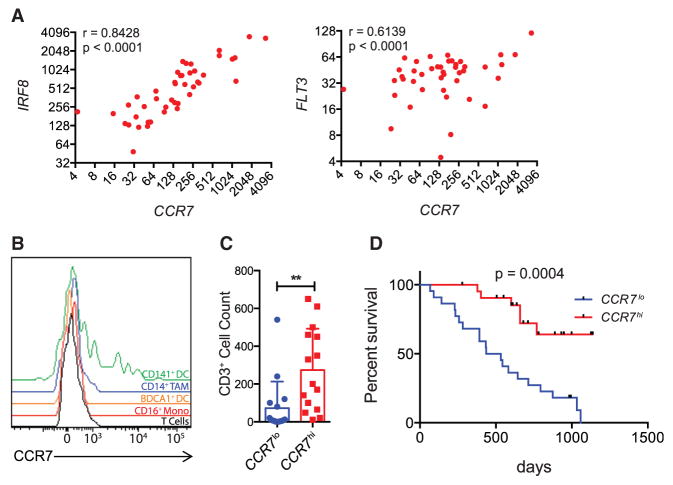
Intratumoral dendritic cells (DC) bearing CD103 in mice or CD141 in humans drive intratumoral CD8(+) T cell activation. Using multiple strategies, we identified a critical role for these DC in trafficking tumor antigen to lymph nodes (LN), resulting in both direct CD8(+) T cell stimulation and antigen hand-off to resident myeloid cells. These effects all required CCR7. Live imaging demonstrated direct presentation to T cells in LN, and CCR7 loss specifically in these cells resulted in defective LN T cell priming and increased tumor outgrowth. CCR7 expression levels in human tumors correlate with signatures of CD141(+) DC, intratumoral T cells, and better clinical outcomes. This work identifies an ongoing pathway to T cell priming, which should be harnessed for tumor therapies.

Keywords: 2-photon imaging; anti-tumor T cell priming; antigen presentation; antigen trafficking; dendritic cells; draining lymph node; melanoma; tumor; tumor immune response.


Figures

Figure 1
Figure 1. Migratory CD103+ DC Carrying Tumor Antigen Accumulate in the Tumor dLN
(A) Representative histogram of tumor-derived mCherry fluorescence across the tumor dLN populations of the inguinal and axillary LN in the ectopic B78ChOVA tumor model. (B) Frequency of mCherry+ DC populations across the tumor dLN of multiple B78ChOVA tumors. Data were pooled from dual-flank-bearing tumor animals and plotted as mean ± SEM for each population (n = 5). Mig, migratory; Res, resident, Macs, macrophages. (C) Representative histogram of tumor-derived mCherry florescence across the tumor dLN populations of the inguinal and axillary LN in the spontaneous PyMTChOVA breast tumor model. (D and E) Representative confocal image of sorted CD103+ DC from tumor dLN (D) or primary tumor (E) of B78ChOVA-bearing mice. Cell membranes labeled with brilliant violet 421-conjugated MHC class II antibody are shown in blue with tumor-derived mCherry fluorescence in red. (F) Representative flow cytometric histograms of tumor-derived mCherry fluorescence within the CD103+ DC populations in the tumor dLN of tumor-bearing animals over tumor progression from day 6 through day 18. Data are from dual-flank-bearing tumor animals from the left and right inguinal and axillary dLN (n = 3). Overlays represent individual LN. (G) Frequency of mCherry+ CD103+ DC in the tumor dLN over tumor progression. Data were pooled from dual-flank-bearing tumor animals, and plotted as mean ± SEM for each population at each time point compared with a healthy animal on day 0 (n = 3). ***p < 0.001. (H) Schematic showing the method of labeling tumor stroma by intratumoral injection of 4OHT in UbcCreERT2 mTmG mice bearing B16F10 tumors. (I) Representative flow cytometric plots showing mG fluorescence of LN stromal populations when 4OHT or vehicle is administered intratumorally or subcutaneously. Data are representative of five independent experiments. (J) Histograms showing marking of tumor dLN myeloid populations 24 hr after three daily intratumoral injections of 4OHT treated with 0.5 μg of either PTX or PBS 4 hr prior to each injection with 4OHT (n ≥ 4 for all groups). Plots show mean ± SEM. Data are representative of five independent experiments. *p < 0.05, **p < 0.01, ***p < 0.001. n.s, not significant. See also Figure S1.
Figure 2
Figure 2. Several Tumor dLN Myeloid Populations Stimulate Naive OTI Proliferation In Vitro
(A) Representative flow cytometric plot showing expression of the Venus transgene within the myeloid populations in the tumor dLN. (B) Time projection of representative multiphoton microscopy image of tumor dLN explants of B78ChOVA-bearing Xcr1-Venus mice 2 days after transfer of 2 × 10⁶ GFP+ OTI T cells. XCR1+ cell time projections are represented in yellow, OTI T cells in blue, and mCherry in red. Two regions of interest (ROI) are shown. (C) Time projection of the XCR1+ DC and interacting OTI T cells in ROI 1 and ROI 2. (D) Representative OTI T cell dwell time on XCR1+ population determined by mCherry fluorescence within the dLN. Data are plotted as median ± interquartile range and statistics were performed using the Mann-Whitney U test. ****p < 0.0001. (E) Schematic of T cell activation assay with sorted populations from the dLN of B78ChOVA tumor-bearing mice. (F) Representative flow cytometric histograms of the induction of Nur77EGFP transgene and the early activation marker CD69 by OTI T cells cultured for 12 hr on APCs sorted directly from the tumor dLN of mice. CD103+ DC is green, migratory CD11b+ DC orange, resident CD11b+ DC purple, CD8α+ DC blue, and macrophage red. Data are representative of three independent experiments. (G) Representative flow cytometric plots of naive OTI T cell proliferation, as measured by dye dilution of eFluor 670 plotted against Nur77EGFP, at 72 hr following co-culture with tumor dLN APC populations. Gray, BM-derived DC + OTI cognate peptide (SL8). Data are representative of four independent experiments. (H) Proportion of OTI T cells at 72 hr that have divided following co-culture with tumor dLN APC populations. Plots show mean ± SEM. Data are representative of four independent experiments. (I) Proportion of pmel T cells at 72 hr that have divided following co-culture with tumor dLN APC populations ± addition of gp100 peptide. Plots show mean ± SEM. Data are representative of two independent experiments. See also Movie S1.
Figure 3
Figure 3. Tumor Antigen Arrival in All Tumor dLN DC Populations Is CCR7 Dependent
(A) Schematic of assessment for LN drainage of the pH-stable fluorophore ZsGreen and representative confocal image of sorted CD103+ DC from tumor dLN of B16 ZsGreen-bearing mTmG mice. Cell membrane is labeled with membrane bound tdTomato in red and tumor-derived ZsGreen fluorescence in green. (B) Representative histogram of tumor-derived ZsGreen florescence across the tumor dLN populations of the inguinal and axillary LN in the ectopic B16 ZsGreen melanoma tumor model treated with 0.5 μg of either PTX (paler line) or PBS (darker line) for 5 days compared with the non-dLN (gray). Data are representative of two independent experiments. (C) Representative flow cytometric histograms of CCR7 levels on tumor myeloid populations and T cells (colored) compared with isotype control (gray) (n = 3). (D) Representative flow cytometric plot of CD8α+ and CD103+ DC in the tumor dLN of either WT or Ccr7−/− mice. Cells shown were gated as CD11c+, MHC class II+, F4/80, Ly6C, CD90.2, and B220. (E) Frequency of DC populations as a percentage of total live cells in the tumor dLN of WT or Ccr7−/− mice. Pooled data from individual mice with dual-flank tumors are presented as mean ± SEM for each population (n = 3), and are representative of three independent experiments. *p < 0.05, **p < 0.01, ***p < 0.001. (F) Quantification of the proportion of total myeloid populations that are ZsGreen+ within the tumor dLN in the presence or absence of CCR7. Data are presented as mean ± SEM for each population (n = 5) and are representative of two independent experiments. *p < 0.05, **p < 0.01. See also Figure S2.
Figure 4
Figure 4. CCR7-Dependent Trafficking of Tumor Antigen to the Tumor dLN Is Required for Anti-Tumor T Cell Priming In Vivo
(A) Schematic of adoptive transfers of labeled T cells into tumor-bearing WT or Ccr7−/− mice for dLN analysis. (B) Representative flow cytometric histogram of CD44 and CD69 expression on transferred T cells in the tumor dLN after 48 hr from either WT (red) or Ccr7−/− (blue) mice, with endogenous T cells in gray. Duplicate histogram overlays represent individual mice. Data are representative of two independent experiments. (C) Quantified geometric mean fluorescent intensity of CD69 and CD44 expression of transferred OTI T cells in the tumor dLN of WT or Ccr7−/− mice at 48 hr. Data are presented as mean ± SEM (n = 3) and are representative of two independent experiments. (D) Representative flow cytometric plots of proliferation measured by dye dilution of adoptively transferred OTI T cells in the dLN of tumor-bearing WT (red) or Ccr7−/− (blue) mice 2 days following transfer. (E) Representative flow cytometric plots of dye dilutions of adoptively transferred OTI T cells in the dLN of tumor-bearing WT (red) or Ccr7−/− (blue) mice following transfer and plotted against CD69 expression. Quantified frequencies, as a percentage of total live LN cells, are plotted for the proportion of recovered transferred T cells (Transferred) as well as the proportion of those transferred T cells that divided (Diluted). Data were pooled from dual-flank-bearing tumor animals, and plotted as mean ± SEM (n = 3). Data are representative of two independent experiments. (F) Tumor growth curves for ectopic B78ChOVA tumors in Ccr7−/− or aged-matched WT C57BL/6 mice over 16 days (without adoptively transferred T cells). Data are presented as tumor area and plotted as mean ± SEM (n = 5). *p < 0.05.
Figure 5
Figure 5. Migratory CD103+ DC Are Required in the dLN for Effective Anti-Tumor CD8+ T Cell Priming
(A) Schematic of adoptive transfers of 5,000 CD45.1+ OTI T cells into XCR1-DTR:Ccr7−/− mixed BM chimeras for analysis of TIL expansion ± elimination of CD103+ DC in the dLN. (B) Proportion of live cells in the dLN that are CD90+ T cells 15 days after B78ChOVA inoculation in XCR1-DTR:WT and XCR1-DTR:Ccr7−/− mixed BM chimera ± DT treatment throughout tumor growth. Data are presented as mean ± SEM (n = 5). (C and D) Proportion of CD8+ T cells in the dLN (C) or tumor (D) from the transferred CD45.1+ OTI T cells 15 days after B78ChOVA inoculation in XCR1-DTR:WT and XCR1-DTR:Ccr7−/− mixed BM chimera ± DT treatment throughout tumor growth. Data are presented as mean ± SEM (n = 5). *p < 0.05; n.s, not significant. See also Figure S3.
Figure 6
Figure 6. High Expression of CCR7 Correlates with Greater T Cell Infiltration in Human Mela-noma and Better Patient Outcomes
(A) Scatterplot showing CCR7 transcript levels from 44 human melanoma samples against the transcript levels of IRF8 and FLT3. Pearson correlation coeffi-cient is shown. (B) Representative flow cytometric plots of CCR7 levels on tumor immune populations from a fresh human metastatic melanoma biopsy. (C) Histogram showing CD3+ T cell counts from 44 human melanoma samples with less than median CCR7 expression (CCR7lo) or above median CCR7 expression (CCR7hi). T cells were counted on histo-logical slides by microscopy. Data are presented as mean ± SEM. **p < 0.01. (D) Survival curve of melanoma patients stratified as in (C). Curves were analyzed using the Gehan-Bre-slow-Wilcoxon test. See also Figure S4.

References

    1. Allan RS, Waithman J, Bedoui S, Jones CM, Villadangos JA, Zhan Y, Lew AM, Shortman K, Heath WR, Carbone FR. Migratory dendritic cells transfer antigen to a lymph node-resident dendritic cell population for efficient CTL priming. Immunity. 2006;25:153–162. - PubMed
    1. Asano K, Nabeyama A, Miyake Y, Qiu CH, Kurita A, Tomura M, Kanagawa O, Fujii S, Tanaka M. CD169-positive macrophages dominate antitumor immunity by crosspresenting dead cell-associated antigens. Immunity. 2011;34:85–95. - PubMed
    1. Bogunovic D, O’Neill DW, Belitskaya-Levy I, Vacic V, Yu YL, Adams S, Darvishian F, Berman R, Shapiro R, Pavlick AC, et al. Immune profile and mitotic index of metastatic melanoma lesions enhance clinical staging in predicting patient survival. Proc Natl Acad Sci USA. 2009;106:20429–20434. - PMC - PubMed
    1. Broz ML, Binnewies M, Boldajipour B, Nelson AE, Pollack JL, Erle DJ, Barczak A, Rosenblum MD, Daud A, Barber DL, et al. Dissecting the tumor myeloid compartment reveals rare activating antigen-presenting cells critical for T cell immunity. Cancer Cell. 2014;26:638–652. - PMC - PubMed
    1. Clatworthy MR, Aronin CE, Mathews RJ, Morgan NY, Smith KG, Germain RN. Immune complexes stimulate CCR7-dependent den-dritic cell migration to lymph nodes. Nat Med. 2014;20:1458–1463. - PMC - PubMed

MeSH terms