. 2016 Aug 8;30(2):337-348.
doi: 10.1016/j.ccell.2016.05.018. Epub 2016 Jul 14.

Mutant IDH1 Downregulates ATM and Alters DNA Repair and Sensitivity to DNA Damage Independent of TET2

Affiliations

Mutant IDH1 Downregulates ATM and Alters DNA Repair and Sensitivity to DNA Damage Independent of TET2

Satoshi Inoue et al. Cancer Cell. .

Abstract

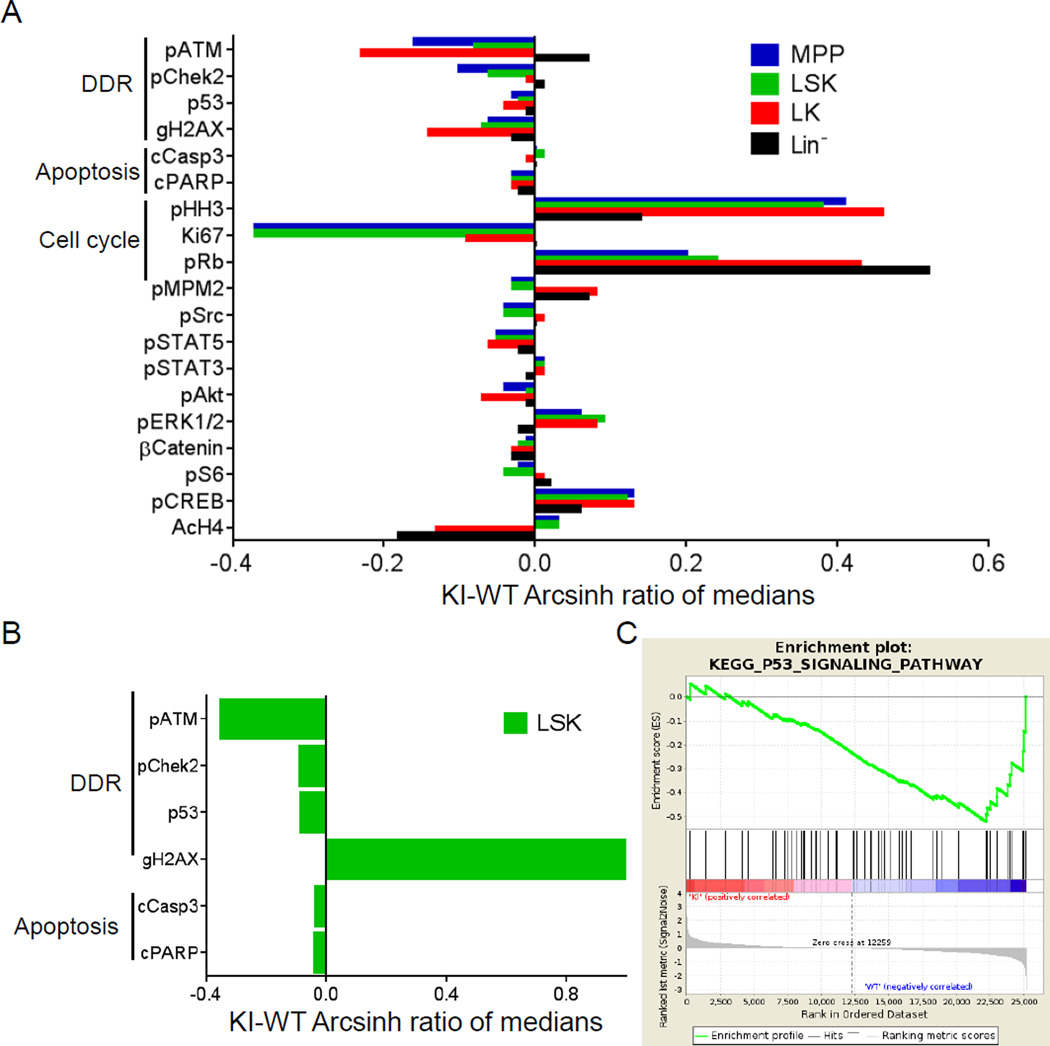
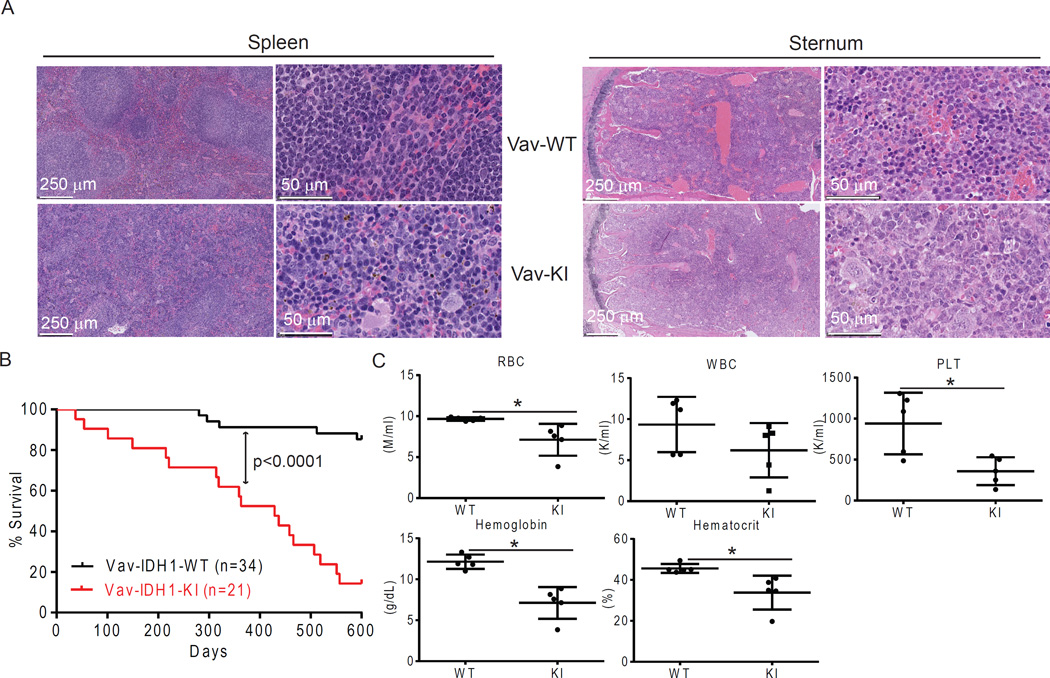
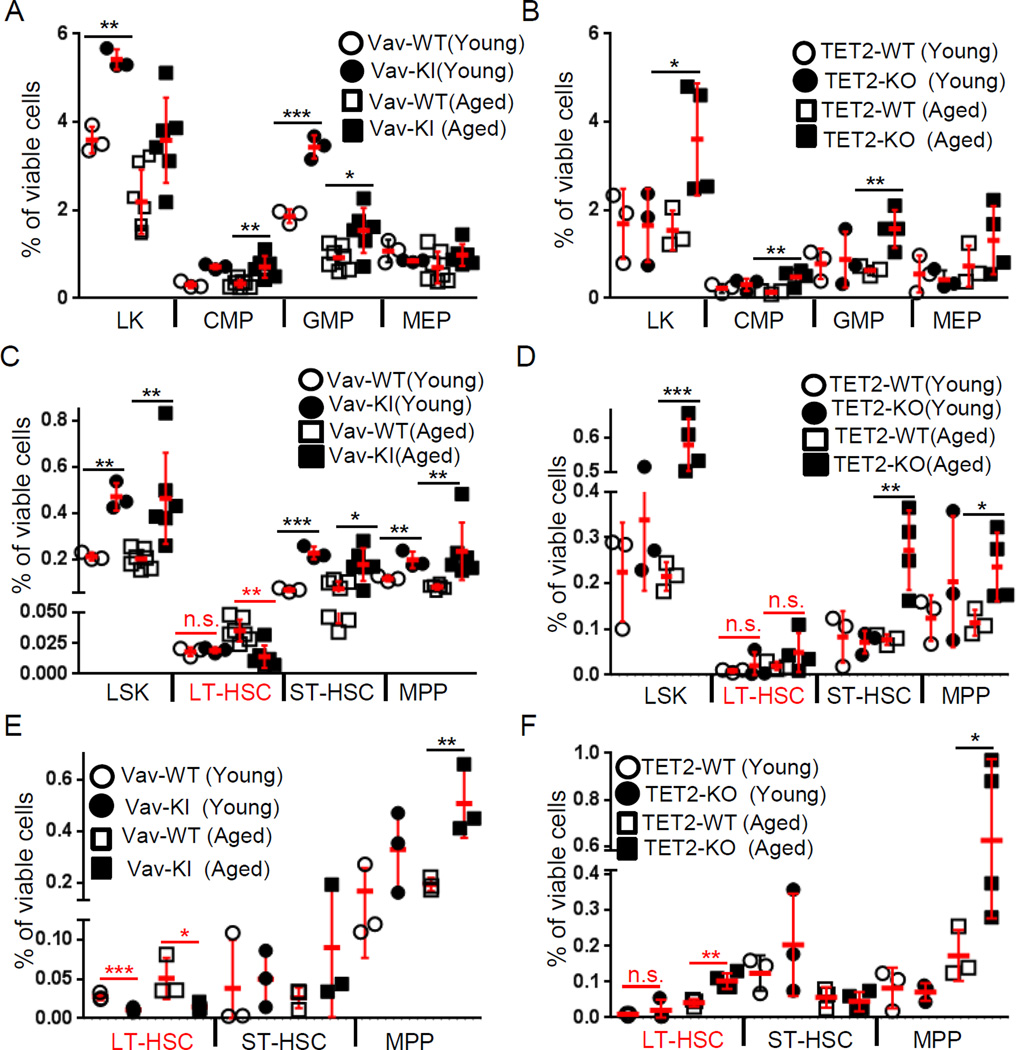
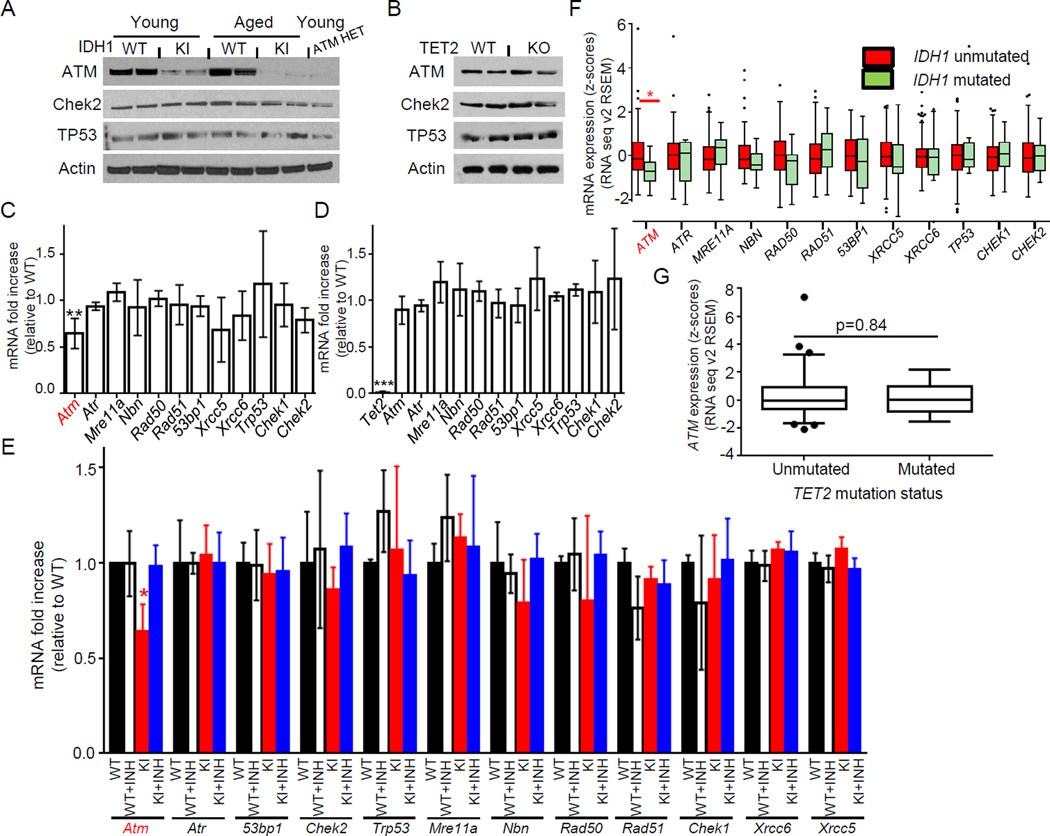
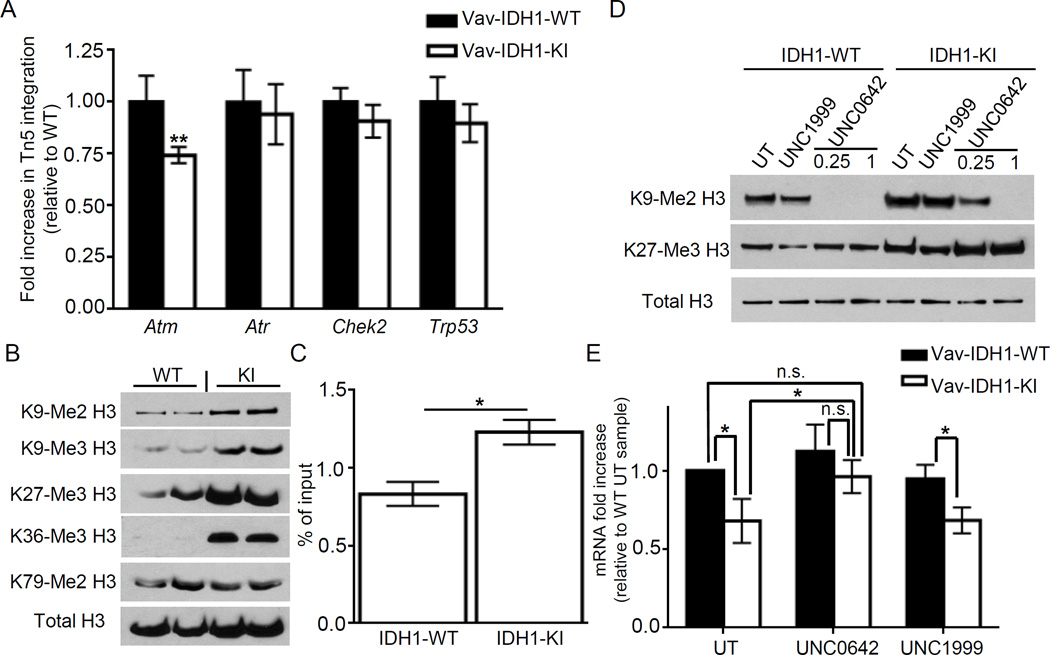
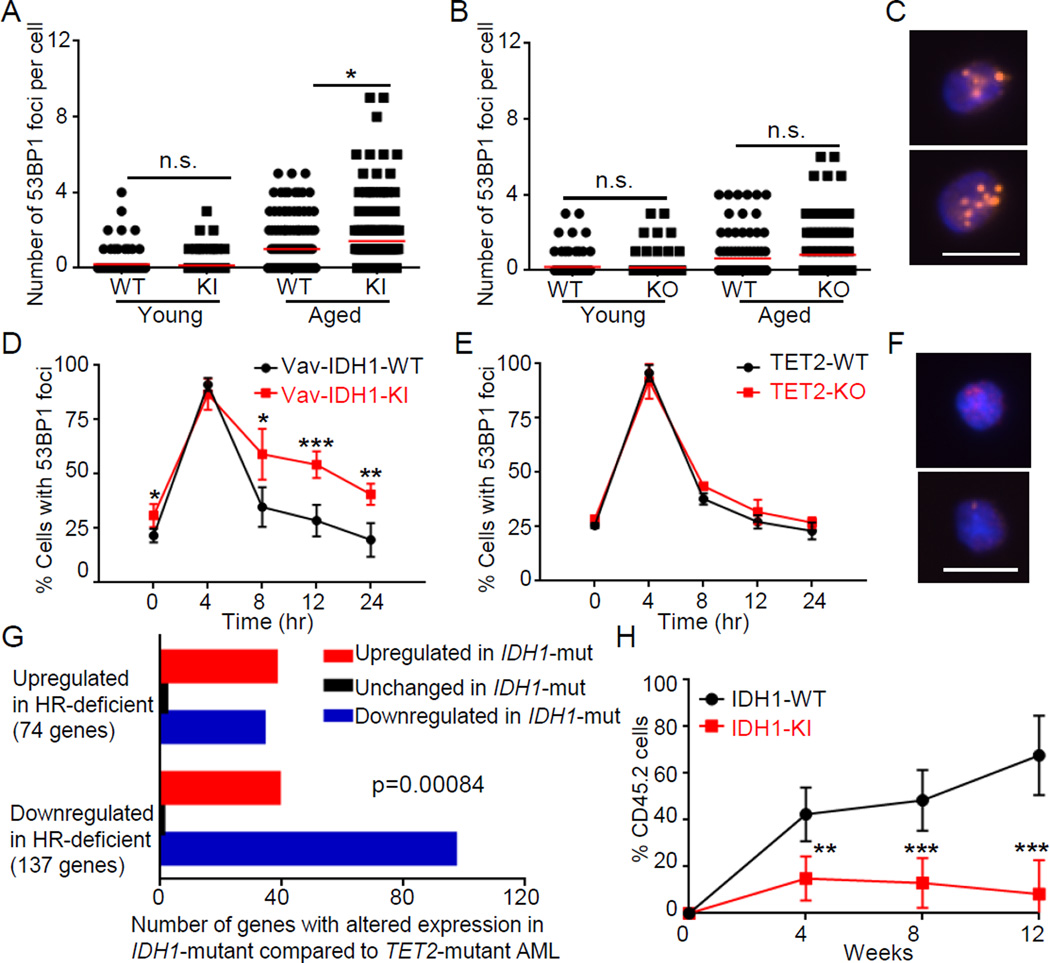
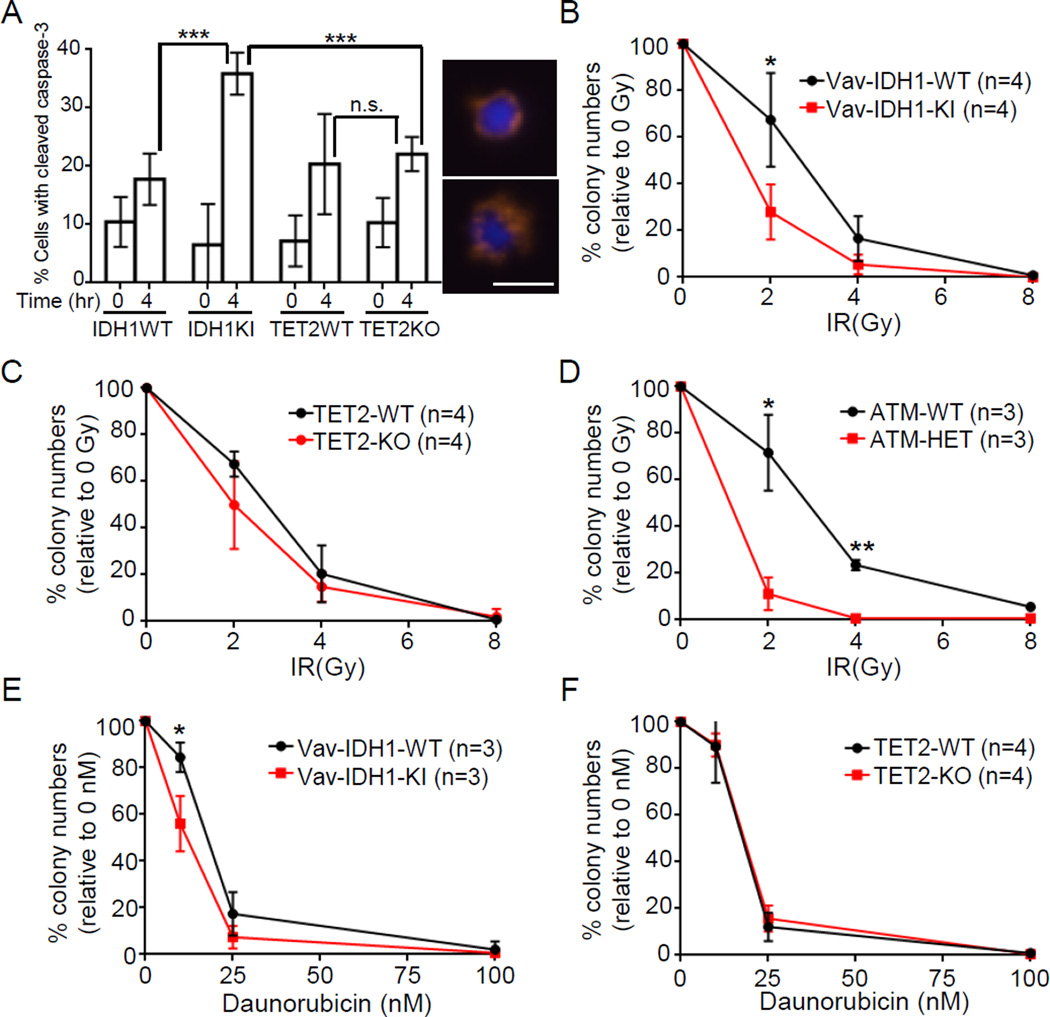
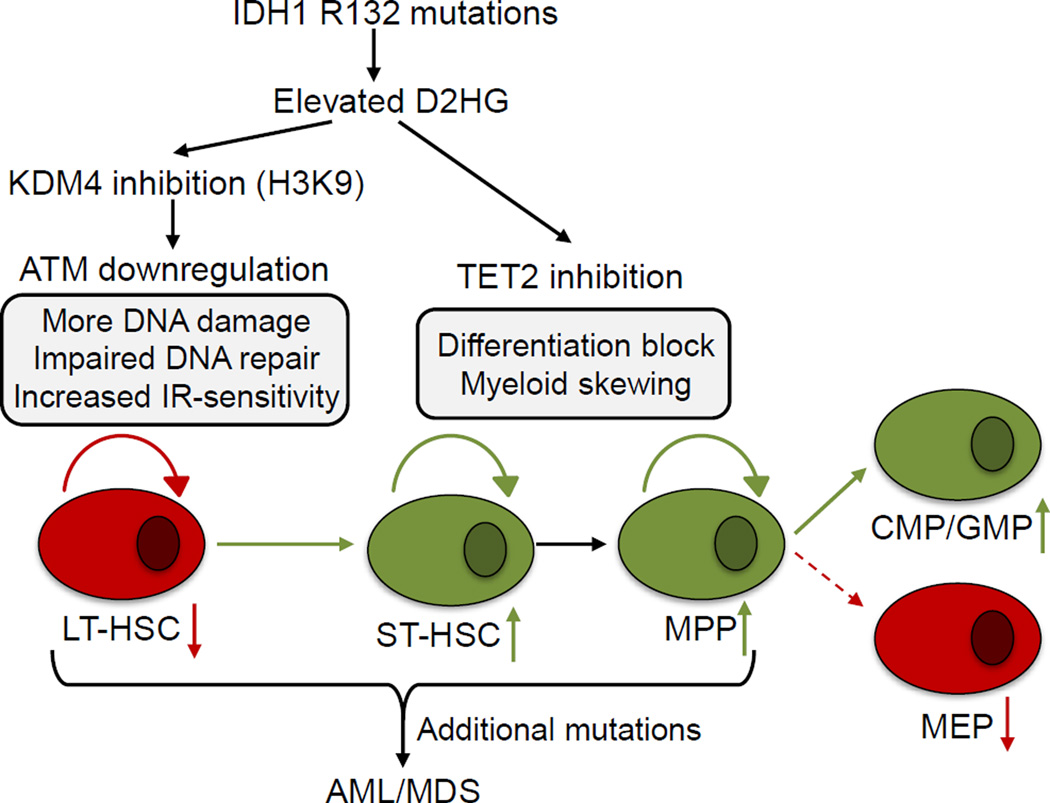
Mutations in the isocitrate dehydrogenase-1 gene (IDH1) are common drivers of acute myeloid leukemia (AML) but their mechanism is not fully understood. It is thought that IDH1 mutants act by inhibiting TET2 to alter DNA methylation, but there are significant unexplained clinical differences between IDH1- and TET2-mutant diseases. We have discovered that mice expressing endogenous mutant IDH1 have reduced numbers of hematopoietic stem cells (HSCs), in contrast to Tet2 knockout (TET2-KO) mice. Mutant IDH1 downregulates the DNA damage (DD) sensor ATM by altering histone methylation, leading to impaired DNA repair, increased sensitivity to DD, and reduced HSC self-renewal, independent of TET2. ATM expression is also decreased in human IDH1-mutated AML. These findings may have implications for treatment of IDH-mutant leukemia.


Conflict of interest statement

Other authors declare that no conflicts of interest exist.

Figures

Figure 1
Figure 1. Decreased phosphorylation of ATM/Chek2/γH2AX in LysM-IDH1-KI hematopoietic cells
(A, B) Representative CyTOF analyses of BM cells from young (A) and aged (B) LysM-IDH1-KI (KI) and WT mouse. The indicated cell populations were immunostained with metal-conjugated Abs to detect the indicated signaling molecules. Histograms represent expression levels in the KI cell relative to the WT. (C) Gene set enrichment analysis of the KEGG p53 pathway DDR gene set in LSK cells of LysM-IDH1-KI and WT mice (n=4/group). Top: x-axis shows genes ordered from high expression in LysM-IDH1-KI samples (left end) to high expression in WT samples (right end). The y-axis shows the running enrichment score (ES) along the ranked gene list. The negative enrichment score near the WT end indicates downregulation of the pathway in the LysM-IDH1-KI samples. Middle: black lines indicate expression of the P53 pathway genes in the LysM-IDH1-KI samples relative to the ranked gene list. Bottom: metric for ranking genes based on the LysM-IDH1-KI or WT phenotype. ES: −0.52. Normalized ES: −1.63. Nominal p value: 0.0032. False Discovery Rate (FDR) q value: 0.088.
Figure 2
Figure 2. Vav-IDH1-KI mice die prematurely with splenomegaly and anemia
(A) Representative H&E-stained sections of spleen and sternum from aged Vav-IDH1-KI (Vav-KI) and control littermate (Vav-WT) mice. (B) Kaplan-Meier plot of Vav-IDH1-KI and littermate Vav-IDH1-WT mice. p value, log-rank test. (C) Complete blood count (CBC) parameters in peripheral blood from aged Vav-IDH1-KI (KI) and WT mice (n=5). WBC, white blood cells; RBC, red blood cells; PLT, platelet count. Data for individual mice are shown as well as the group mean ± SD. *p<0.05, unpaired Student’s t-test. See also Figure S1.
Figure 3
Figure 3. IDH1-R132 mutation reduces LT-HSC
(A–F) Quantitation of flow cytometric analyses of (LK cells, CMP (FcγRCD34+), GMP (FcγR+CD34+) and MEP (FcγRCD34) (A, B); LSK, LT-HSC (CD34Flt3), ST-HSC (CD34+Flt3) and MPP (CD34+Flt3+) (C, D); and LT-HSC (CD150+CD48), ST-HSC (CD150+CD48+) and MPP (CD150CD48+) (E, F) among viable Lin BM cells from young and aged Vav-IDH1-KI (Vav-KI) and control (Vav-WT) mice (n=3–7) (A, C, E) and young and aged TET2-KO and control (TET2-WT) mice (n=3–4) (B, D, F). Data points are percentage of viable cells in individual mice. Red lines, group means ± SD. * p<0.05; **p<0.01; ***p<0.001 by unpaired Student’s t-test. n.s., not significant. See also Figure S2.
Figure 4
Figure 4. TET2-independent ATM downregulation by mutant IDH1
(A, B) Immunoblot detecting the indicated proteins in Lin cells from young and aged Vav-IDH1-KI (KI) and WT mice, plus young ATM-HET mice (A) and aged TET2-KO and TET2-WT mice (B). (C, D) qRT-PCR determination of the indicated mRNAs in LSK cells from young Vav-IDH1-KI (C) and TET2-KO (D) mice relative to controls. Data are the mean ± SD (n=3). (E) qRT-PCR determination of the indicated mRNAs from LSK cells isolated from Vav-IDH1-KI and WT mice and cultured with (+INH) or without mutant IDH1 inhibitor (n=3/group). Data are the mean ± SD. For (C–E), *p<0.05; **p<0.01; ***p<0.001 by unpaired Student’s t-test. (F) Z-score plot of mRNA levels of the indicated genes in human IDH1-unmutated (n=127) and IDH1-mutated (n=13) AML samples from TCGA. RNASeq version 2 values were quantified using the expectation-maximization method (RSEM) and converted to z-scores. IDH2- and TET2-mutated samples were excluded. *p<0.05 by Wilcoxon rank-sum test adjusted with the Benjamini and Hochberg method. (G) Z-score plot, generated and analyzed as in (F), of ATM mRNA levels in TET2-unmutated (n=128) and TET2-mutated (n=13) human AML samples from TCGA. IDH1- and IDH2-mutated samples were excluded. The boxplots are drawn using the method of Tukey (F, G). Briefly, central horizontal lines on the boxplots indicate the median, the box edges indicate the 25th and 75th percentiles, and the whiskers indicate the largest value above or below these percentiles within 1.5 times the interquartile range. Data beyond the whiskers are plotted as individual points.
Figure 5
Figure 5. Partially closed chromatin structure and increased H3K methylation in the ATM promoter in Vav-IDH1-KI cells
(A) ATAC-qPCR to analyze the indicated genes in LSK cells from Vav-IDH1-KI and WT mice (n=3). Data are the mean ± SD. (B) Immunoblot to detect the indicated methylated forms of histone H3 in Lin cells from Vav-IDH1-KI and WT mice. (C) ChIP-qPCR analysis of the Atm promoter in LSK cells from Vav-IDH1-KI and WT mice (n=3) using anti-histone H3-K9me3 Ab. Data are the mean ± SD. (D) Immunoblot to detect the indicated proteins in LSK cells isolated from Vav-IDH1-KI and WT mice and cultured with/without UNC1999 (1 µM) or UNC0642(0.25 or 1 µM). UT, untreated. (E) qRT-PCR determination of Atm mRNA in the mice in (D) (1 µM UNC0642). Data are the mean ± SD (n=4). For A,C,E, *p<0.05, **p<0.01 by unpaired Student’s t-test. See also Figure S3.
Figure 6
Figure 6. Vav-IDH1-KI LT-HSC show elevated accumulation of age-related DD, impaired DNA repair and repopulation capacities
(A, B) Quantitation of 53BP1 DD foci in LT-HSC (~100 cells from 3 mice/group) isolated from Vav-IDH1-KI and Vav-IDH1-WT (A), and TET2-KO and TET2-WT mice (B) (~100 cells from 3 mice/group). Data are values for individual LT-HSC. Red lines, group means. (C) Representative fluorescent images of 53BP1 DD foci in LT-HSC isolated from aged Vav-IDH1-KI mice. Scale bar, 5 µm. (D–E) Kinetics of disappearance of 53BP1 foci over the indicated period in LT-HSC (n=3/group) that were isolated from aged Vav-IDH1-KI and Vav-IDH1-WT (D) or TET2-KO and TET2-WT (E) mice (n=3/group) and exposed in vitro to IR (0.5 Gy). Data are the mean ± SD. (F) Representative images of 53BP1 foci in LT-HSC isolated from aged Vav-IDH1-KI at 24 hr post-IR. Scale bar, 5 µm. (G) Number of genes by direction of expression change in IDH1-mutated AML (n=5) relative to TET2-mutated AML (n=7) that were present in a gene expression signature derived from HR-deficient cells (Peng et al., 2014). The direction of change in IDH1-mutated samples correlated positively with the direction of change in HR-deficient cells. IDH2 mutants, DNMT3A mutants, and IDH1;TET2 double mutants were excluded. p=0.00084, Fisher’s exact test. (H) Quantitation of a competitive repopulation assay in which CD45.2+ cells from Vav-IDH1-KI or Vav-IDH1-WT mice were transferred to irradiated CD45.1+ recipients. Data are the mean ± SD (n=6/group. For A,B,D,H, *p<0.05, **p<0.01, ***p<0.005 by unpaired Student’s t test. n.s., not significant. See also Figure S4.
Figure 7
Figure 7. Enhanced IR and daunorubicin sensitivity in Vav-IDH1-KI LT-HSC
(A) Left: Quantitation of percentages of LT-HSC that were isolated from aged Vav-IDH1-KI, Vav-IDH1-WT, TET2-KO or TET2-WT mice (n=3/group) and were positive for cleaved caspase-3 at 4 hr post-IR (1 Gy). Data are the mean ± SD. Right: Two representative images of cleaved caspase-3 in the irradiated Vav-IDH1-KI LT-HSC in the left panel. Scale bar, 5 µm. (B–F) Quantitation of colonies remaining 1 week after LT-HSC from aged Vav-IDH1-KI and Vav-IDH1-WT mice (n=3 mice/group) (B, E), TET2-KO and TET2-WT mice (n=4 mice/group) (C, F) and ATM WT and ATM-HET mice (n=3 mice/group) (D), after irradiation with 2, 4 or 8 Gy (B–D), or treated in vitro with the indicated concentrations of daunorubicin (E, F). Data are the mean ± SD and expressed as the percentage of colonies/plate relative to unirradiated or untreated controls. *p<0.05, **p<0.01, ***p<0.005 by unpaired Student’s t test. n.s., not significant. See also Figure S5.
Figure 8
Figure 8. Proposed model of mutant IDH1 oncogenicity
Mutant IDH1 increases the concentration of intracellular D2HG. In hematopoietic stem cells, D2HG inhibits histone lysine demethylases, leading to decreased expression of ATM and a DDR defect. In more differentiated cells, D2HG inhibition of TET2 leads to alterations in DNA methylation and altered myeloid differentiation. Upon acquisition of additional oncogenic mutations, these effects of mutant IDH1 may contribute to malignant transformation.

Comment in

  • IDH1, Histone Methylation, and So Forth.
    Penard-Lacronique V, Bernard OA. Penard-Lacronique V, et al. Cancer Cell. 2016 Aug 8;30(2):192-194. doi: 10.1016/j.ccell.2016.07.008. Cancer Cell. 2016. PMID: 27505668

Similar articles

Cited by

References

    1. An J, Gonzalez-Avalos E, Chawla A, Jeong M, Lopez-Moyado IF, Li W, Goodell MA, Chavez L, Ko M, Rao A. Acute loss of TET function results in aggressive myeloid cancer in mice. Nature communications. 2015;6:10071. - PMC - PubMed
    1. Beerman I, Seita J, Inlay MA, Weissman IL, Rossi DJ. Quiescent hematopoietic stem cells accumulate DNA damage during aging that is repaired upon entry into cell cycle. Cell stem cell. 2014;15:37–50. - PMC - PubMed
    1. Buenrostro JD, Giresi PG, Zaba LC, Chang HY, Greenleaf WJ. Transposition of native chromatin for fast and sensitive epigenomic profiling of open chromatin, DNA-binding proteins and nucleosome position. Nature methods. 2013;10:1213–1218. - PMC - PubMed
    1. Busque L, Patel JP, Figueroa ME, Vasanthakumar A, Provost S, Hamilou Z, Mollica L, Li J, Viale A, Heguy A, et al. Recurrent somatic TET2 mutations in normal elderly individuals with clonal hematopoiesis. Nature genetics. 2012;44:1179–1181. - PMC - PubMed
    1. Cairns RA, Mak TW. Oncogenic isocitrate dehydrogenase mutations: mechanisms, models, and clinical opportunities. Cancer discovery. 2013;3:730–741. - PubMed