. 2017 Feb 9;36(6):850-862.
doi: 10.1038/onc.2016.254. Epub 2016 Jul 18.

FoxF1 and FoxF2 transcription factors synergistically promote rhabdomyosarcoma carcinogenesis by repressing transcription of p21Cip1 CDK inhibitor

Affiliations

FoxF1 and FoxF2 transcription factors synergistically promote rhabdomyosarcoma carcinogenesis by repressing transcription of p21Cip1 CDK inhibitor

David Milewski et al. Oncogene. .

Abstract

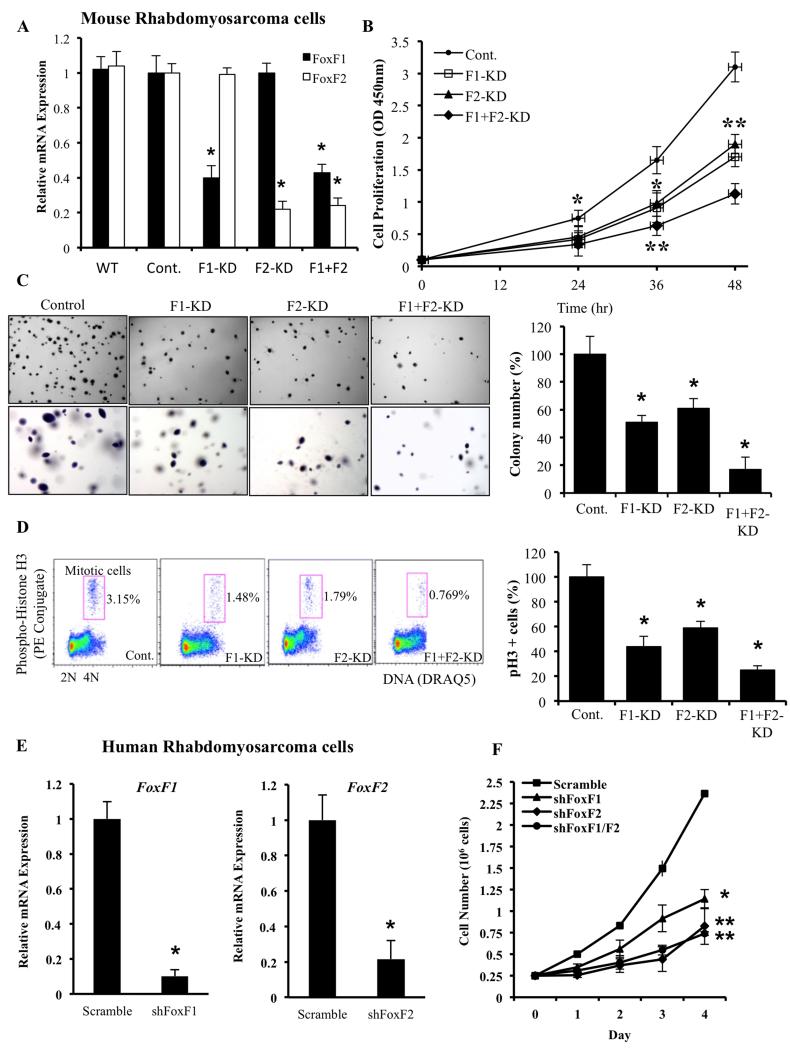
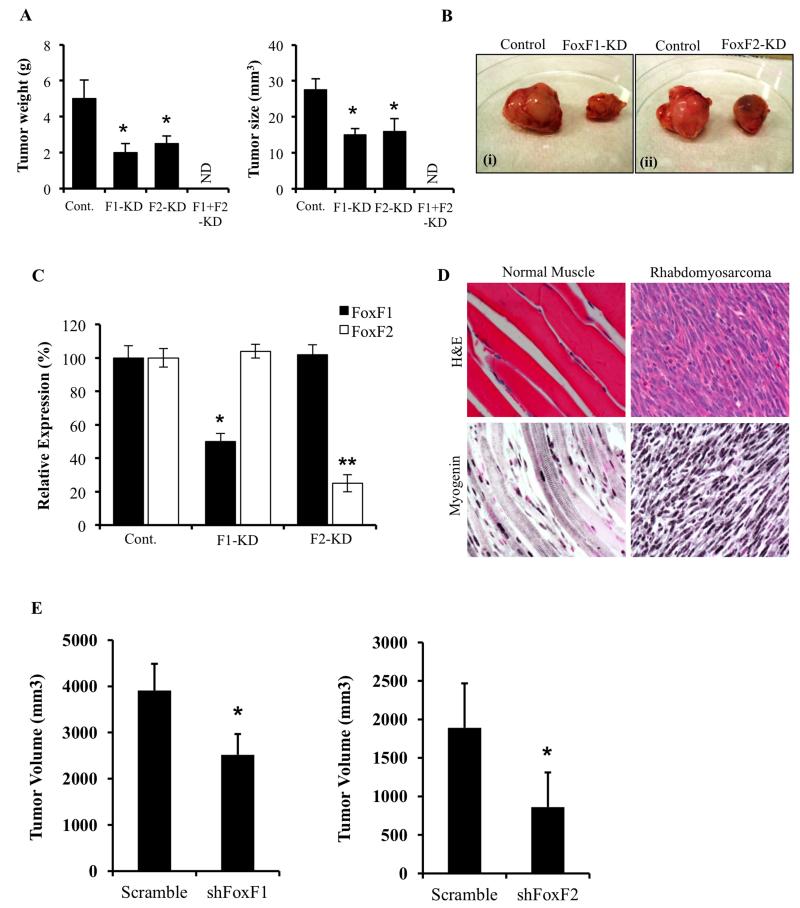
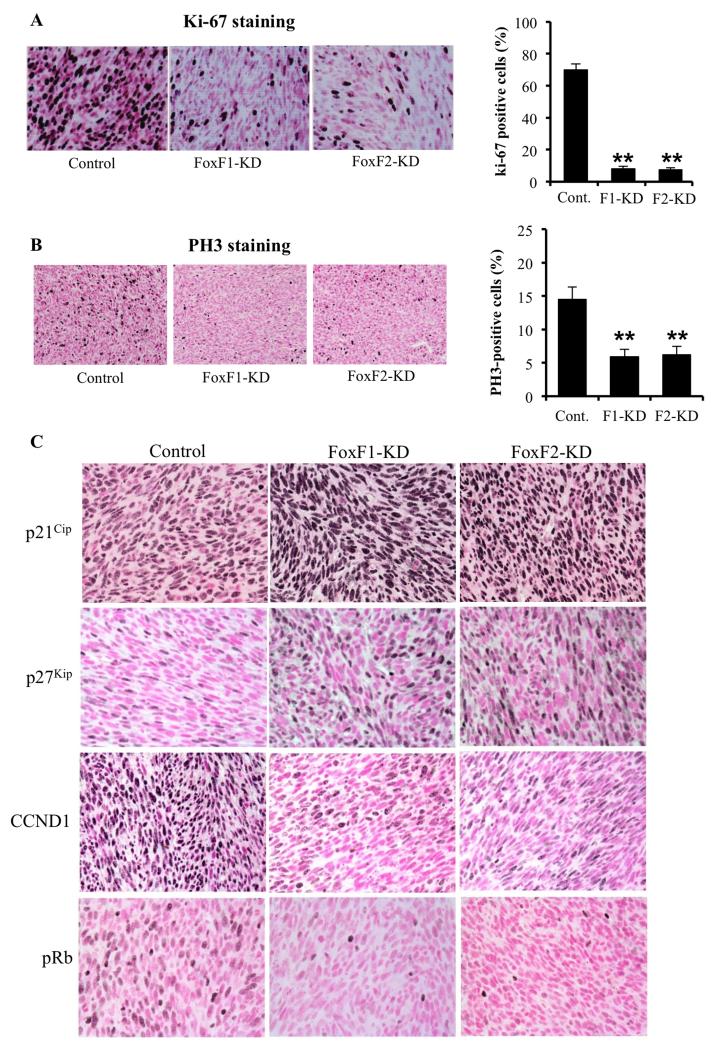
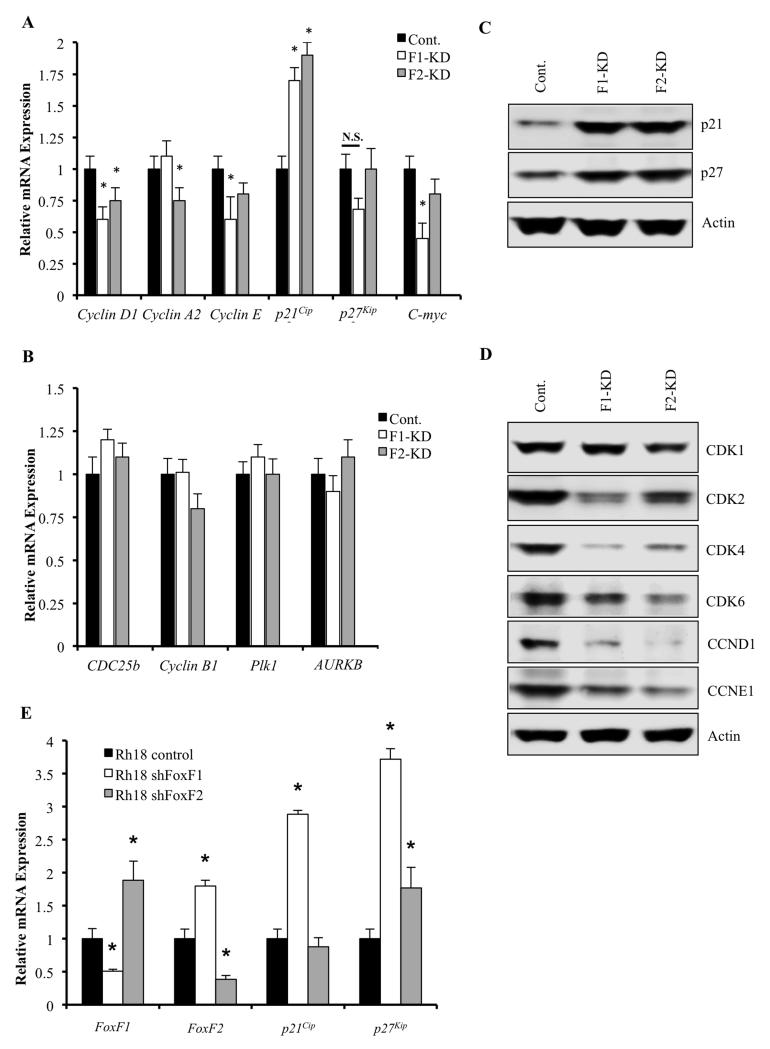
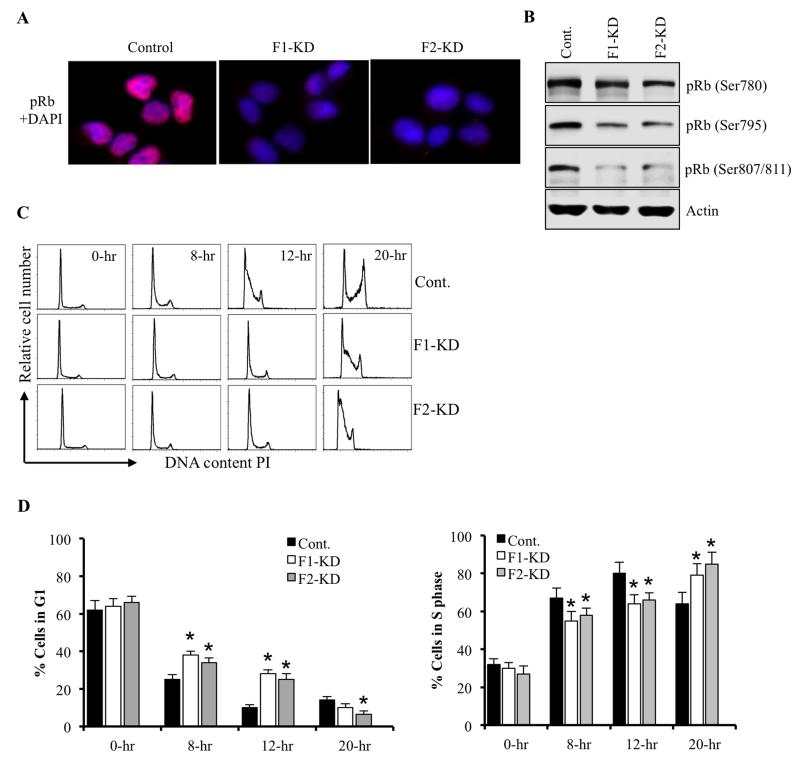
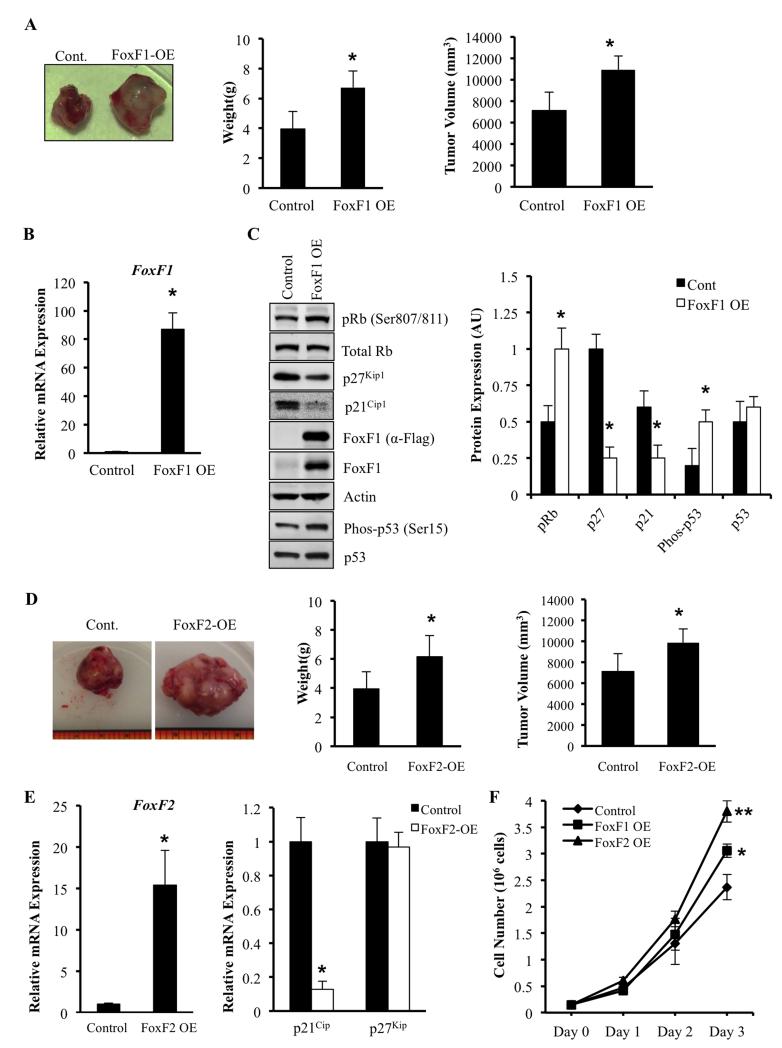
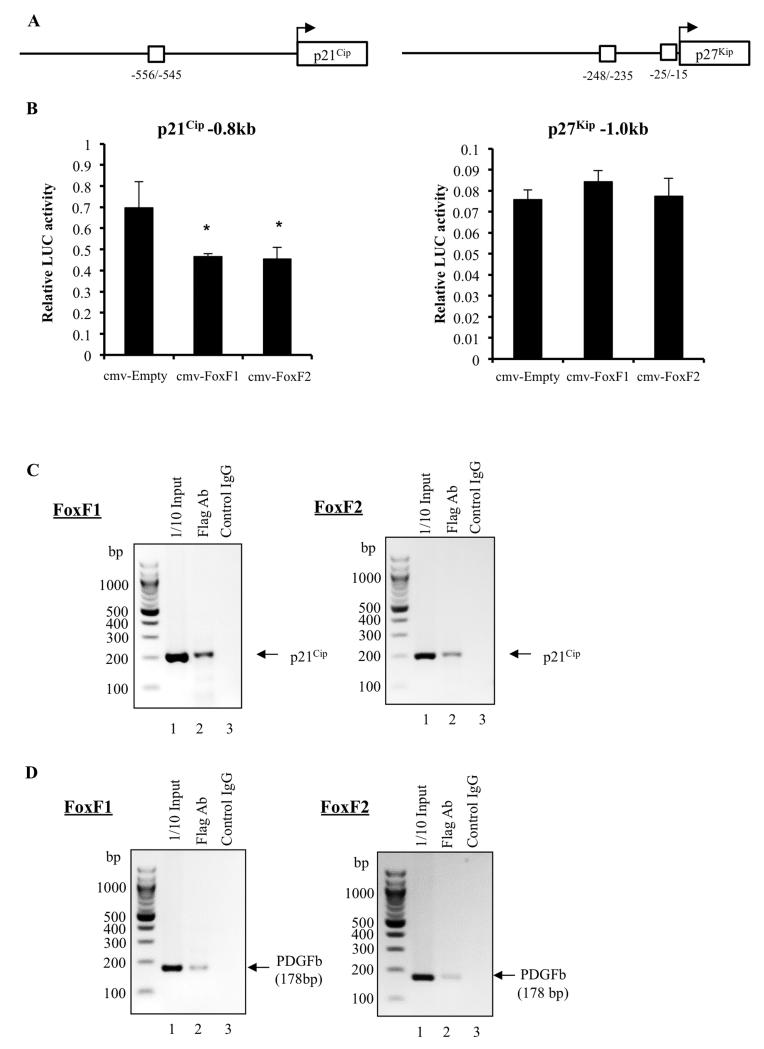
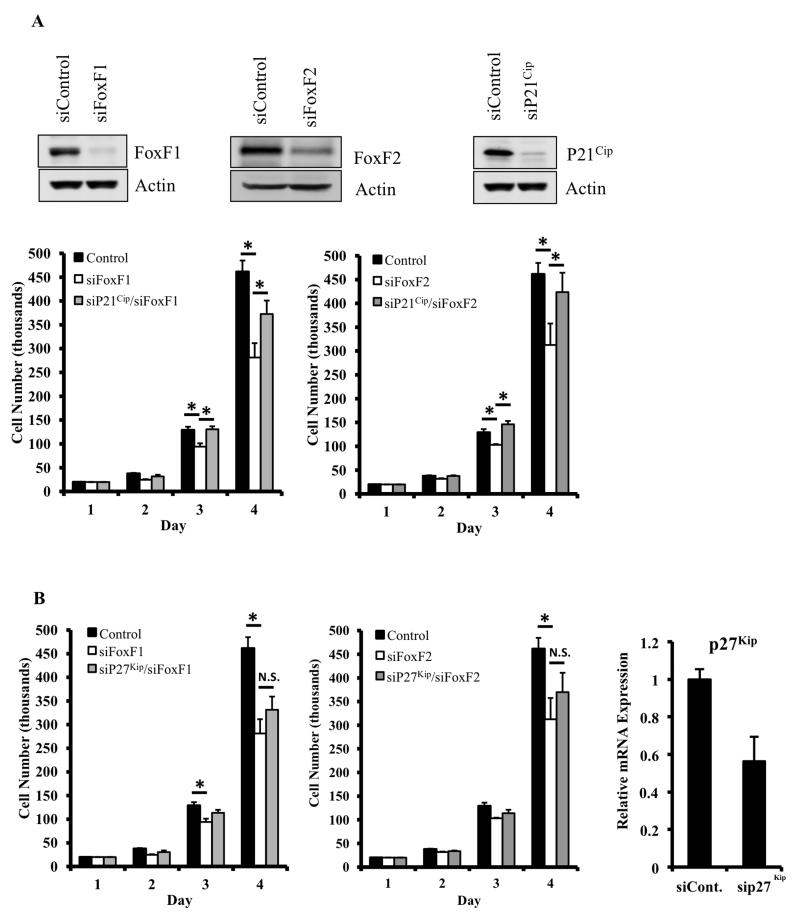
The role of Forkhead Box F1 (FoxF1) transcription factor in carcinogenesis is not well characterized. Depending on tissue and histological type of cancer, FoxF1 has been shown to be either an oncogene or a tumor suppressor. Alveolar rhabdomyosarcoma (RMS) is the most aggressive pediatric soft-tissue sarcoma. Although FoxF1 is highly expressed in alveolar RMS, the functional role of FoxF1 in RMS is unknown. The present study demonstrates that expression of FoxF1 and its closely related transcription factor FoxF2 are essential for RMS tumor growth. Depletion of FoxF1 or FoxF2 in RMS cells decreased tumor growth in orthotopic mouse models of RMS. The decreased tumorigenesis was associated with reduced tumor cell proliferation. Cell cycle regulatory proteins Cdk2, Cdk4/6, Cyclin D1 and Cyclin E2 were decreased in FoxF1- and FoxF2-deficient RMS tumors. Depletion of either FoxF1 or FoxF2 delayed G1-S cell cycle progression, decreased levels of phosphorylated retinoblastoma protein (Rb) and increased protein levels of the CDK inhibitors, p21Cip1 and p27Kip1. Depletion of both FoxF1 and FoxF2 in tumor cells completely abrogated RMS tumor growth in mice. Overexpression of either FoxF1 or FoxF2 in tumor cells was sufficient to increase tumor growth in orthotopic RMS mouse model. FoxF1 and FoxF2 directly bound to and repressed transcriptional activity of p21Cip1 promoter through -556/-545 bp region, but did not affect p27Kip1 transcription. Knockdown of p21Cip1 restored cell cycle progression in the FoxF1- or FoxF2-deficient tumor cells. Altogether, FoxF1 and FoxF2 promoted RMS tumorigenesis by inducing tumor cell proliferation via transcriptional repression of p21Cip1 gene promoter. Because of the robust oncogenic activity in RMS tumors, FoxF1 and FoxF2 may represent promising targets for anti-tumor therapy.


Figures

Figure 1
Figure 1. Lentiviral knockdown of FoxF1, FoxF2 or both in mouse and human RMS cells decreased cellular growth in vitro
(A) Efficiency of FoxF1 and FoxF2 lentiviral knockdown in mouse 76-9 rhabdomyosarcoma cells was shown by qRT-PCR. β-actin mRNA was used for normalization. (B) Depletion of FoxF1, FoxF2 or both decreased proliferation of 76-9 cells in vitro. Control, FoxF1-KD, FoxF2-KD and F1+F2-KD 76-9 cells were seeded in triplicates and counted at different time points using WST1 Cell Proliferation Assay. (C) Depletion of FoxF1, FoxF2 or both decreased colony formation in soft agar compared to control RMS cells. Cells were seeded in triplicates. Values are the means ± SD of three independent experiments. A p value <0.05 is shown with (*). (D) Depletion of FoxF1, FoxF2 or both decreased the number of cells in mitosis shown by flow cytometery with phospho-Histone H3 antibodies. (E) Efficiency of FoxF1 and FoxF2 lentiviral knockdown in human Rh30 rhabdomyosarcoma cells was shown by qRT-PCR. β-actin mRNA was used for normalization. (F) Depletion of FoxF1, FoxF2 or both decreased proliferation of Rh30 cells in vitro. Control, FoxF1-, FoxF2- or F1+F2-deficient Rh30 cells were seeded in triplicates and counted at different time points using hemocytometer. Data represent mean±s.d. of three independent experiments. A p value < 0.05 is shown with (*); p value < 0.01 is shown with (**).
Figure 2
Figure 2. Knockdown of FoxF1 or FoxF2 decreased RMS tumor growth in mice
RMS tumors were harvested 3 weeks after inoculation of control 76-9 rhabdomyosarcoma cells or 76-9 cells with stable knockdown of FoxF1, FoxF2 or both (FoxF1-KD, FoxF2-KD or F1-F2 KD). (A) FoxF1 or FoxF2 deficiency decreased the growth of RMS tumors in orthotopic model. Mean weight and size of tumors (±SD) are shown (n=8 for control 76-9 cells, n=6 for each group of KD cells). ND – not determined: No tumors were found in F1-F2 KD group. (B) Representative images of excised tumors from FoxF1 and FoxF2 KD mice compared to control are shown. (C) Efficiency of FoxF1 and FoxF2 depletion in tumors are shown by qRT-PCR. Total RNA was prepared from tumors isolated from control, FoxF1-KD and FoxF2-KD mice. β-actin mRNA was used for normalization. Data represent means ± SD of three independent determinations using RMS tumor tissue from n=6-10 mice in each group. (D) Histological analysis of the excised RMS tumors was performed using H&E staining and immunostaining with antibodies to Myogenin. Magnification: 400x. (E) Human rhabdomyosarcoma Rh30 cells with stable knockdown of FoxF1 or FoxF2 were inoculated into immunocompromised NSG mice. Depletion of FoxF1 or FoxF2 decreased tumor growth compared to control tumors. N=8 per group for shFoxF1 tumors and N=6 per group for shFoxF2 tumors. A p value <0.05 is shown with (*).
Figure 3
Figure 3. Depletion of FoxF1 and FoxF2 increased expression of p21Cip1 and p27Kip1 in RMS tumors
RMS tumors were harvested 3 weeks after inoculation of control 76-9 rhabdomyosarcoma cells or 76-9 cells with stable knockdown of FoxF1 or FoxF2 (FoxF1-KD, FoxF2-KD). (A-B) Decreased cellular proliferation was demonstrated by reduced numbers of Ki-67-positive (A) and pH3-positive cells (B). Percentage of Ki-67-positive and PH3-positive cells were counted in five random microscope fields (n=3 mice per group, right panels). A p value < 0.01 is shown with (**). Magnification is 400x (upper panels), 200x (bottom panels). (C) Depletion of FoxF1 or FoxF2 increased expression of p21Cip1 and p27Kip1 CDK inhibitors and decreased protein levels of CCND1 and pRb in RMS tumors. Magnification is 200x.
Figure 4
Figure 4. FoxF1 or FoxF2 knockdown alters expression of p21Cip1 /p27Kip1 pathway-related genes
Total RNA and protein from orthotopicaly-grown RMS tumors were harvested 3 weeks after 76-9 tumor cells inoculation. (A) Depletion of FoxF1 or FoxF2 (FoxF1-KD, FoxF2-KD) in RMS tumor cells decreased mRNAs of cyclin D1, cyclin A2, cyclin E and C-myc, all of which are G1/S-promoting cell cycle genes. p21 mRNA was increased in the FoxF1- and FoxF2-depleted RMS tumors. qRT-PCR was used to assess expression levels. β-actin mRNA was used for normalization. A p value <0.05 is shown with (*). (B) No changes in mRNAs of G2/M cell cycle transition and cytokinesis genes, Cdc25b, cyclin B1, Plk1 and Aurora B, were found using qRT-PCR. β-actin mRNA was used for normalization. (C) Western blot demonstrated increased expression of p21Cip1, p27Kip1 and pRb (Ser807/811) proteins in FoxF1-KD or FoxF2-KD RMS tumors compared to control. (D) Western blot showed decreased protein levels of Cdk1, Cdk2, Cdk4, Cdk6, cyclin D1, and cyclin E1 in FoxF1-KD or FoxF2-KD RMS tumors compared to control. β-Actin was used as loading control. (E) qRT-PCR was performed using human rhabdomyosarcoma Rh30 cells with stable knockdown of FoxF1 or FoxF2. β-actin mRNA was used for normalization.
Figure 5
Figure 5. Depletion of FoxF1 or FoxF2 delays cell cycle progression at the G1/S transition
(A) Decreased levels of phosphorylated Rb (pRb) protein in FoxF1-KD or FoxF2-KD RMS cells were shown using immunofluorescent staining with antibodies against pRb. Nuclei were counterstained with DAPI. (B) Western blot on FoxF1- or FoxF2-deficient tumor cells showed decreased expression of pRb (Ser780), pRb (Ser795) and pRb (Ser807/811. (C) FoxF1- or FoxF2-depletion caused delay in cell cycle progression at G1/S transition. Control, FoxF1-KD or FoxF2-KD 76-9 RMS cells were serum starved overnight. After serum addition, cells were harvested at 8 hrs, 12 hrs, and 20 hrs. Total DNA content was measured by propidium iodide staining and quantification were done by flow cytometry. (D) Quantification of accumulated FoxF1- or FoxF2-deficient RMS cells in G0/G1 and S phase were performed using flow cytometry analysis. Depletion of FoxF1 or FoxF2 resulted increase accumulation of tumor cells in G0/G1 and decrease number of cells in S phase. Percent of total cells in G1 phase and S phase was presented as mean ± SD. Data represent mean±s.d. of three independent experiments. A p value <0.05 is shown with (*).
Figure 6
Figure 6. Overexpression of FoxF1 or FoxF2 promotes tumor growth by decreasing expression of p21Cip1 and p27Kip1
(A) Representative tumors formed 3 weeks after receiving intra-muscular injection of 2 ×10⁵ 76-9 cells transduced with an empty-vector control or FoxF1 overexpression retrovirus (FoxF1-OE). Tumor weights and volumes for mice (n=5) are shown as mean ± SD. (B) Efficiency of FoxF1 overexpression was confirmed by qRT-PCR using total RNA isolated from orthotopic RMS tumors. FoxF1 expression levels were normalized to β-actin mRNA. (C) Overexpression of FoxF1 decreased protein levels of pRb, p21Cip1 and p27Kip1 shown by Western blot using of total protein from RMS tumors. Blots were probed with antibodies against phosphorylated Rb (pRb), total Rb, p21CIP1, p27Waf1/Cip1, Flag, FoxF1, p53, phospho-p53, or β-actin (left panel). Relative expression levels of these proteins were determined with densitometry and normalized to β-actin (right panel). AU=arbitrary units. (D) Representative tumors formed 3 weeks after receiving intra-muscular injection of 2 ×10⁵ 76-9 cells transduced with an empty-vector control or FoxF2 overexpression retrovirus (FoxF1-OE). Tumor weights and volumes for mice (n=7) are shown as mean ± SD. (E) Efficiency of FoxF1 overexpression was confirmed by qRT-PCR using total RNA isolated from orthotopic RMS tumors (left panel). Overexpression of FoxF2 increased p21Cip1 mRNA as shown by qRT-PCR using total RNA isolated from rhabdomyosarcoma tumors (right panel). β-actin mRNA was used for normalization. All data represent mean ± SD of three independent determinations using tumor tissue from n=5–7 mice in each group. (F) Overexpression of FoxF1 or FoxF2 increased proliferation of RMS tumor cells in vitro. 76-9 control, FoxF1 OE, or FoxF2 OE cells were plated in triplicates. Cell numbers were measured every 24 hours for 3 days. Each point represents mean±SEM. Data represent mean±s.d. of three independent experiments. A p value <0.05 is shown with (*), a p value <0.01 is shown with (**).
Figure 7
Figure 7. p21Cip1 is a direct transcriptional target of FoxF1 and FoxF2
(A) Schematic diagram shows the potential FoxF1/FoxF2 binding sites in the murine p21Cip1 and p27Kip1 promoters. (B) FoxF1 and FoxF2 repressed transcriptional activity of p21Cip1 promoter (left panel), but did not change transcriptional activity of p27Kip1 promoter (right panel). Cells were transfected with CMV-Empty, CMV-FoxF1 or CMV-FoxF2 expression vectors and a −0.8kb p21Cip1-pGL2 promoter plasmid or −1.0kb p27Kip1-pGL2 promoter plasmid. Dual LUC assays were used to determine LUC activity. Transcriptional activity is shown as a fold change relative to CMV-empty vector (±SD). A p value <0.05 is shown with (*). Data represent mean±s.d. of three independent experiments. (C) Direct binding of FoxF1 and FoxF2 proteins to the p21Cip1 promoter region is shown by ChIP assay. Protein/ DNA complexes were immunoprecipitated using Flag-specific antibody and 76-9 RMS cells that overexpressed His-Flag (HF)-tagged FoxF1 or FoxF2. Immunoprecipitation with isotype control antibodies was used for normalization. Data represent one of three independent experiments. (D) Binding of FoxF1 and FoxF2 to the PDGFb promoter region is presented as a positive control for the ChIP assay using the same cells.
Figure 8
Figure 8. Knockdown of p21Cip1, but not p27Kip1, restores cell proliferation in FoxF1- and FoxF2-deficient cells in vitro
(A) Western blots showing protein expression FoxF1 (top left), FoxF2 (top middle panel) or p21Cip1 (top right panel) of 91U cells after transfection with control siRNA or siRNA against FoxF1, FoxF2, or p21Cip1. Cell proliferation in the transfected cells was determined by daily cell counts using a hemacytometer. Knockdown of FoxF1 (bottom left) or FoxF2 (bottom right) decreased cell proliferation. Knockdown of p21Cip1 rescued cellular proliferation in both FoxF1- and FoxF2-deficient cells. Data represents the mean ± SD of triplicate wells. (B) Knockdown of p27Kip1 did not restore decreased cellular proliferation in FoxF1- or FoxF2-deficient cells (left and middle panels). Efficiency of p27Kip1 knockdown is shown by qRT-PCR (right panel). Expression levels were normalized to β-actin mRNA. A p value <0.05 is shown with (*).

Similar articles

Cited by

References

    1. McDowell HP. Update on childhood rhabdomyosarcoma. Arch Dis Child. 2003;88(4):354–7. - PMC - PubMed
    1. Merlino G, Helman LJ. Rhabdomyosarcoma--working out the pathways. Oncogene. 1999;18(38):5340–8. - PubMed
    1. Hayes-Jordan A, Andrassy R. Rhabdomyosarcoma in children. Curr Opin Pediatr. 2009;21(3):373–8. - PubMed
    1. Breneman JC, Lyden E, Pappo AS, Link MP, Anderson JR, Parham DM, et al. Prognostic factors and clinical outcomes in children and adolescents with metastatic rhabdomyosarcoma--a report from the Intergroup Rhabdomyosarcoma Study IV. J Clin Oncol. 2003;21(1):78–84. - PubMed
    1. Qualman SJ, Morotti RA. Risk assignment in pediatric soft-tissue sarcomas: an evolving molecular classification. Curr Oncol Rep. 2002;4(2):123–30. - PubMed