. 2016 Aug 2;16(5):1445-1455.
doi: 10.1016/j.celrep.2016.06.073. Epub 2016 Jul 14.

Formation of a "Pre-mouth Array" from the Extreme Anterior Domain Is Directed by Neural Crest and Wnt/PCP Signaling

Affiliations

Formation of a "Pre-mouth Array" from the Extreme Anterior Domain Is Directed by Neural Crest and Wnt/PCP Signaling

Laura Jacox et al. Cell Rep. .

Abstract

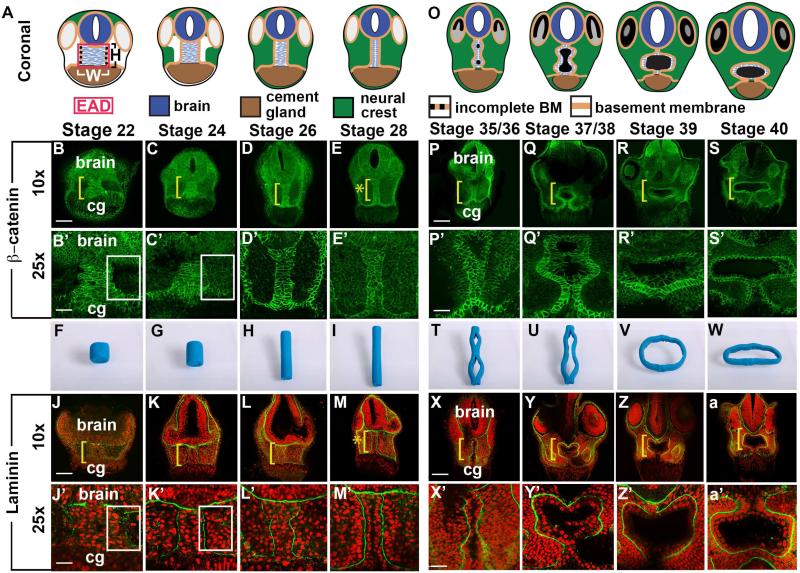
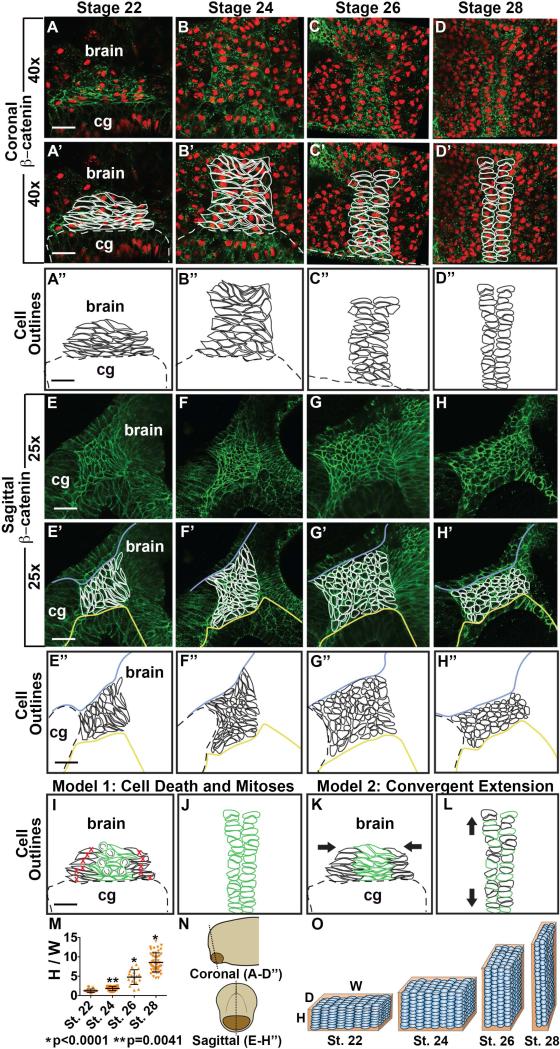
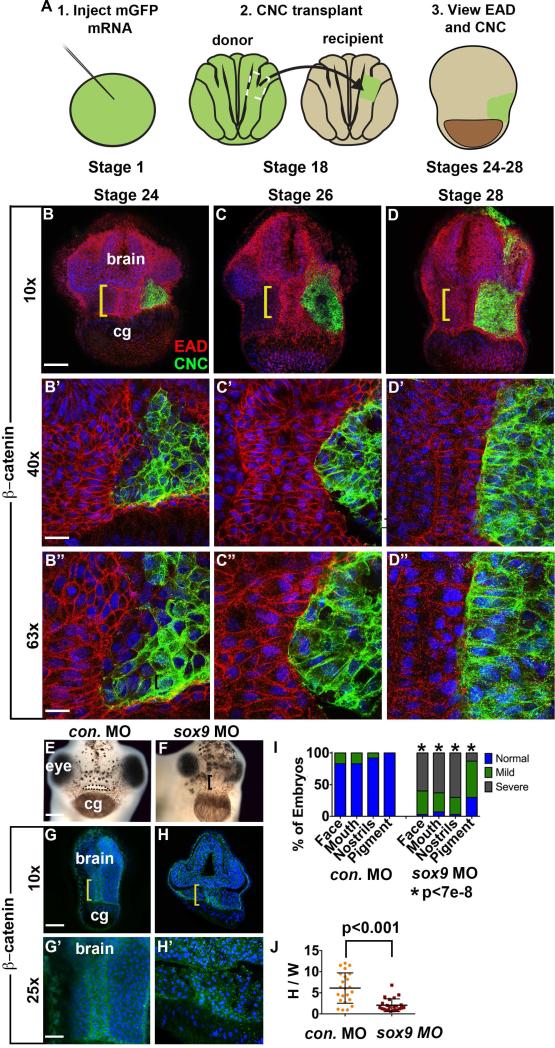
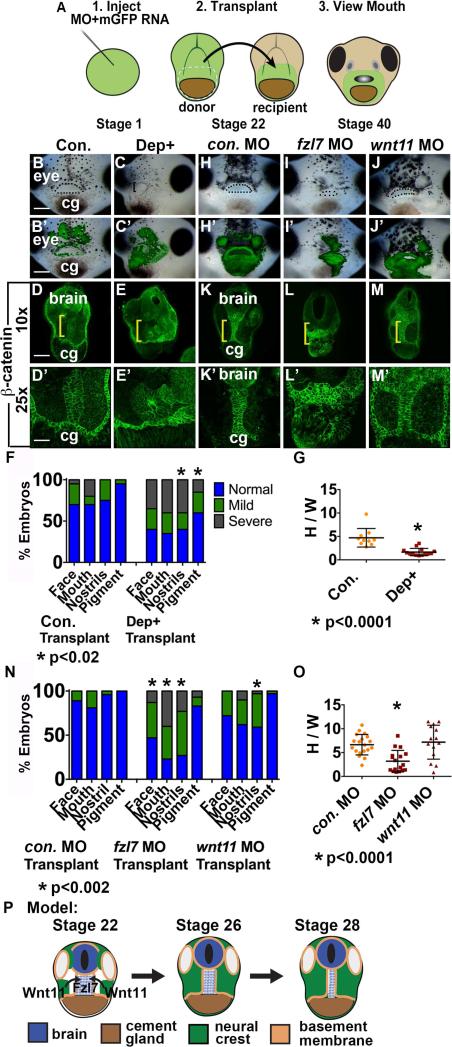
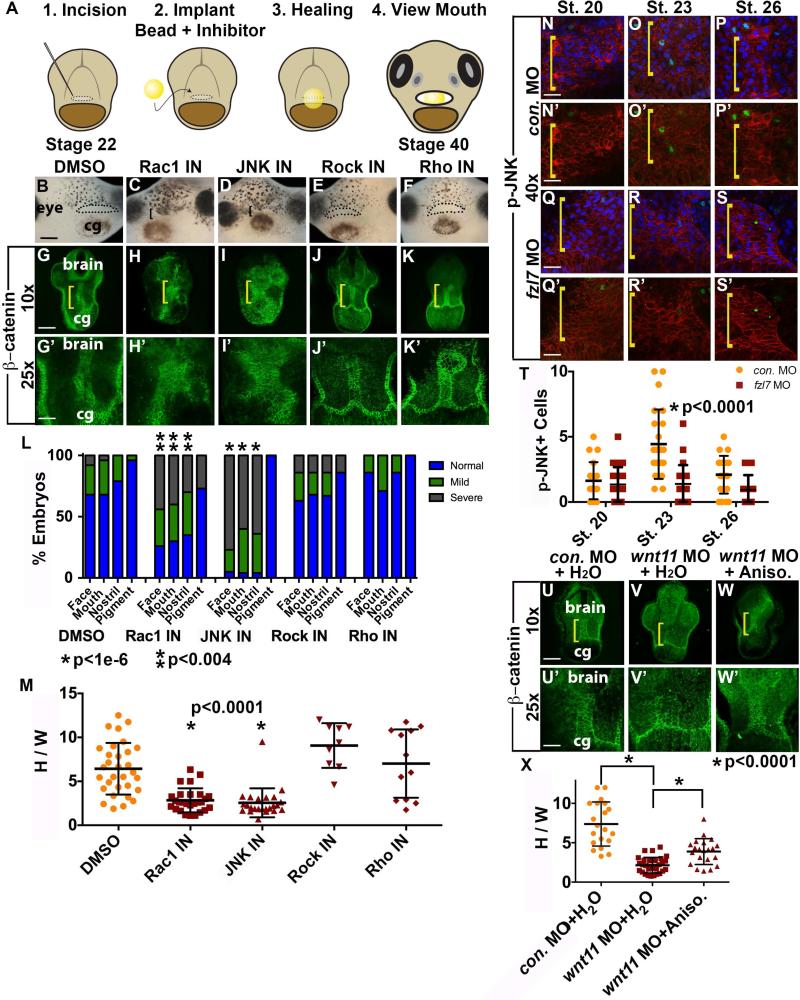
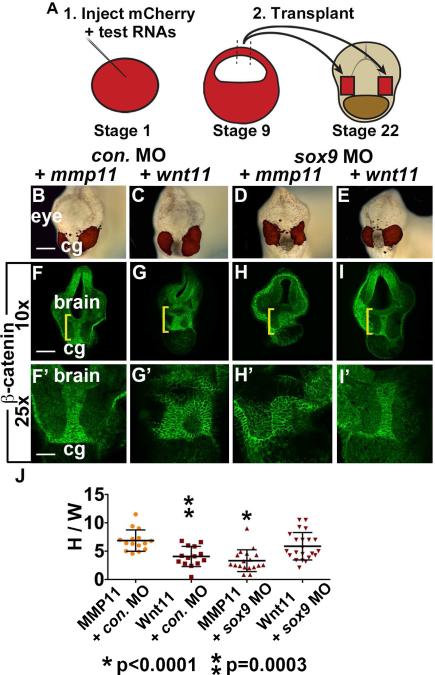
The mouth arises from the extreme anterior domain (EAD), a region where the ectoderm and endoderm are directly juxtaposed. Here, we identify a "pre-mouth array" in Xenopus that forms soon after the cranial neural crest has migrated to lie on either side of the EAD. Initially, EAD ectoderm comprises a wide and short epithelial mass that becomes narrow and tall with cells and nuclei changing shape, a characteristic of convergent extension. The resulting two rows of cells-the pre-mouth array-later split down the midline to surround the mouth opening. Neural crest is essential for convergent extension and likely signals to the EAD through the Wnt/planar cell polarity (PCP) pathway. Fzl7 receptor is locally required in EAD ectoderm, while Wnt11 ligand is required more globally. Indeed, heterologous cells expressing Wnt11 can elicit EAD convergent extension. The study reveals a precise cellular mechanism that positions and contributes to the future mouth.


Figures

Figure 1
Figure 1
Coronal anatomy of Xenopus face and EAD ectoderm between late neurula and swimming tadpole. (A, O) Schematic, st. 22-28 and st. 35/36-40. (B-E’, P-S’) Coronal sections with β-catenin immunolabeling (2 independent experiments, st. 22, n=10; st. 24, n=11; st. 26, n=14; st. 28 n=14). Midline region (bracket) with bright β-catenin labeling is EAD ectoderm of the pre-mouth array. Bracket: region of 10x image (B-E, P-S) enlarged in 25x view (B’-E’, P’-S’). Asterisk (E), pre-mouth array at stage 28, enlarged in E’. cg, cement gland. (F-I, T-W) Still frames from claymation of mouth opening found in Movie S2. I, pre-mouth array stage of claymation. (J-M’, X-a’); Coronal sections with Laminin (green) immunolabeling with Propidium Iodide (PI) nuclear counterstain (red) (2 independent experiments, st. 22, n=10; st. 24, n=4; st. 26, n=6; st. 28, n=7). Bracket: region of 10x image (J-M, X-a) enlarged in 25x view (J’-M’, X’-a’). Asterisk (M), pre-mouth array at stage 28, enlarged in M’. (B’, C’, J’, K’) White boxes surround lateral regions next to EAD which fill with NC cells between stages 22 (B’, J’) and 24 (C’, K’). Scale bar (10x): 170μm. Scale bar (25x): 68μm.
Figure 2
Figure 2
Detailed anatomy and modeling of Xenopus EAD ectoderm between late neurula and swimming tadpole. (A-D’) Coronal sections with β-catenin (green) immunolabeling with PI nuclear counterstain (red) from stages 22-28 (2 independent experiments, st. 22, n=10; st. 24, n=11; st. 26, n=14; st. 28 n=14). (E-H’) Sagittal sections with β-catenin (green) immunolabeling from stages 22-28 (3 independent experiments, st. 22, n=12; st. 24, n=10; st. 26, n=12; st. 28, n=12). (A’-D’, E’-H’) Cell membranes traced in white. Blue line, separates deep EAD from outer ectoderm. Yellow line, separates EAD ectoderm from endoderm. (A’’-D’’, E’’-H’’) Cell outlines in black. Dotted line: top of cement gland, cg. (D-D’’) Pre-mouth array is present and indicated by cell outlines. Scale bar (25x): 68μm. Scale bars (40x): 43μm. (I-J) Model 1. I, stage 22. J, stage 28. (K-L) Model 2. K, stage 22. L, stage 28. (M) Quantification of height vs. width of EAD (see Methods) (3 independent experiments, st.22, n=12; st. 24, n=16; st. 26, n=17; st. 28, n=47). P values: unpaired, two-tailed T test comparing sequential stages. Error bar: standard deviation. (N) Diagram demonstrating coronal (A-D’) and sagittal (E-H’) sections. (O) Diagram showing the change in height (H), width (W) and depth (D) of the EAD ectoderm and its surrounding BM between stages 22 and 28. Blue ovals, EAD ectodermal cells undergoing convergent extension. Orange rectangular prism, Laminin BM surrounding EAD ectoderm.
Figure 3
Figure 3
EAD ectoderm undergoes convergent extension (CE) as the cranial neural crest (NC) approaches the midline and EAD CE fails to occur in sox9 LOF embryos. (A) Experimental schematic. (B-D’’) Coronal sections with mGFP-labeled NC (green) and β-catenin (red) immunolabeling from late neurula (stage 24) to late tailbud (stage 28) (2 independent experiments, st. 24, n=7; st. 26, n=7; st. 28 n=4). Midline region (bracket) with bright β-catenin labeling is EAD ectoderm. Bracket: region of 10x image (B-D) enlarged in 40x view (B’-D’) and 63x view (B’’-D’’). cg, cement gland. (E-F) Frontal view of control and sox9 LOF embryos at swimming tadpole (stage 40) assayed in 2 experiments (control MO (E) n=24; sox9 MO (F) n=30.) Dots surround open mouth. Bracket: unopened mouth. Scale bar: 200 m. (G-H’) Coronal sections assayed in 4 independent experiments (n=23) with β-catenin immunolabeling and Hoersch nuclear labeling. Midline region with bright β-catenin labeling is EAD ectoderm. Bracket: region of 10x image (G-H) enlarged in 25x view (G’-H’). cg, cement gland. (I) Graph depicting percent of embryos displaying mouth, face, nostrils and pigment formation phenotypes at st. 40 in control and sox9 LOF embryos. P values: Fisher's exact probability test. (J) Quantification of height over width of EAD (see Methods). P values: unpaired, two-tailed T test. Error bar: standard deviation. Unless otherwise specified, Scale bar (10x): 170μm. Scale bar (25x): 68μm. Scale bar (40x): 43μm. Scale bar (63x): 27μm.
Figure 4
Figure 4
Fzl7 is locally required in the EAD ectoderm for convergent extension. Local requirement of Dsh, fzl7, and wnt11 expression tested with an EAD transplant technique. (A) Experimental design: donor LOF tissue was transplanted to uninjected sibling recipients. (B-C’) EAD transplant outcome from control or Dep+ RNA donor tissue assayed in 3 experiments. ((B, B’) control RNA n=23; (C, C’) Dep+ RNA n=22.) (B’-C’) Overlay of (B-C) with GFP fluorescence indicating location of donor transplant in recipient. Dots surround open mouths. Bracket: unopened mouth. Frontal view. cg, cement gland. Scale bar: 200 m. (D-E’) Coronal sections of EAD transplants with control or Dep+ donor tissue assayed in 3 independent experiments ((D, D’) control RNA n=10; (E, E’) Dep+ RNA n=14) with β-catenin immunolabeling. Midline region with bright β-catenin labeling is EAD ectoderm. Bracket: region of 10x image (D-E) enlarged in 25x view (D’-E’). (F) Quantification of normal or abnormal structure development depending on background of facial tissue. P values: Fisher's exact probability test. (G) Quantification of height over width of EAD (see Methods). P value: unpaired, two-tailed T test. Error bar: standard deviation. (H-J) EAD transplant outcome from control, fzl7 or wnt11 LOF donor tissue assayed in 4 independent experiments. ((H, H’) control MO n=27; (I, I’) fzl7 MO n=30; (J, J’) wnt11 MO n=30.) (H’-J’) Overlay of (H-J) with GFP fluorescence indicating location of donor transplant in recipient. Dots surround open mouths. Bracket: unopened mouth. Frontal view. Scale bar: 200μm. (K-M’) Coronal sections of EAD transplants with control, fzl7 or wnt11 donor tissue assayed in 4 independent experiments with β-catenin immunolabeling ((K, K’) control MO n=19; (L, L’) fzl7 MO n=17; (M, M’) wnt11 MO n=14). Midline region with bright β-catenin labeling is EAD ectoderm. Bracket: region of 10x image (K-M) enlarged in 25x view (K’-M’). (N) Quantification of normal or abnormal structure development depending on LOF background of facial tissue. P values: Fisher's exact probability test. (O) Quantification of height over width of EAD midline tissue in transplants. P values: unpaired, two-tailed T test. (P) Schematic of model. NC releases Wnt11 which acts on Fzl7 receptors expressed on midline EAD cells. Unless otherwise specified, Scale bar (10x): 170μm. Scale bar (25x): 68μm.
Figure 5
Figure 5
Inhibition of GTPases JNK and Rac1 is associated with a reduction in EAD ectodermal convergent extension. (A) Experimental schematic of inhibitor loaded bead implantation in the presumptive mouth, EAD region. (B-F) Frontal view of swimming tadpole (stage 40) embryos with inhibitor loaded beads implanted in presumptive mouths, assayed in 3 experiments. ((B) control DMSO n=97; (C) Rac1 n=40; (D) JNK inhibitor n=44; (E) Rock inhibitor n=75; (F) Rho inhibitor n=39.) Bracket: unopened mouth. Dots surround open mouths. cg, cement gland. Scale bar: 200μm. (G-K’) Coronal sections, stage 28, assayed in 3 independent experiments. ((G, G’) control DMSO n=31; (H, H’) Rac1 inhibitor n=27; (I, I’) JNK inhibitor n=24; (J, J’) Rock inhibitor n=9; (K, K’) Rho inhibitor n=12)) with β-catenin immunolabeling. Midline region with bright β-catenin labeling is EAD ectoderm. Bracket: region of 10x image (G-K) enlarged in 25x view (G’-K’). Scale bar (10x): 170μm. Scale bar (25x): 68μm. (L) Graph depicting percentage of embryos, displaying mouth, face, nostrils and pigment formation phenotypes at stage 40. P values: Fisher's exact probability test. (M) Quantification of height over width of EAD (see Methods). P values: unpaired, two-tailed T test. Error bar: standard deviation. (N-S’) Control and fzl7 LOF embryos at stage 20 (N, N’, n=19; Q, Q’, n=26), stage 23 (O, O’, n= 23; R, R’, n=23), and stage 26 (P, P’, n=21; S, S’, n=16) with p-JNK immunolabeling (green), mApple cell membranes (red), and Hoechst nuclear counterstain (blue in N-S) assayed in 2 experiments. Bracket: EAD. Scale bars (40x): 43μm. (T) Quantification of cells with p-JNK positive nuclei in the EAD ectoderm. Total number of EAD nuclei was equivalent between stage matched control and frzl7 LOF embryos. p<0.0006, control stage 23 compared to stages 20 and 26. P values: unpaired, two-tailed T test. (U-W’) Coronal sections, stage 28, assayed in 2 independent experiments. ((U, U’) control water n=20; (V, V’) wnt11 MO + control water n=30; (W, W’) wnt11 MO + Anisomycin JNK-activator n=21) with β-catenin immunolabeling. Midline region with bright β-catenin labeling is EAD ectoderm. Bracket: region of 10x image (U-W) enlarged in 25x view (U’-W’). Scale bar (10x): 170μm. Scale bar (25x): 68μm. (X) Quantification of height over width of EAD (see Methods). Error bar: standard deviation. P values: unpaired, two-tailed T test.
Figure 6
Figure 6
Wnt11 is sufficient for EAD ectoderm convergent extension. (A) Sufficiency of Wnt11 for midline CE was tested with an animal cap transplant technique. Experimental schematic of bilateral transplants with mApple, animal cap overexpressing Wnt11 or a control, secreted protein (inactive MMP11). (B-E) Overlay of brightfield images with mApple fluorescence indicating location of donor transplant in late tailbud recipients (stage 28). Scale bar: 200μm. (F-I’) Coronal sections of animal cap transplants with mmp11 or wnt11 overexpressing donor tissue assayed in 3 experiments with β-catenin immunolabeling ((F, F’) control MO+mmp11 n=15; (G, G’) control MO+wnt11 n=14; (H, H’) sox9 MO+mmp11 n=18; (I, I’) sox9 MO+wnt11 n=22). Midline region with bright β-catenin labeling is EAD ectoderm. Bracket: region of 10x image (F-I) enlarged in 25x view (F’-I’). (J) Quantification of height over width of EAD (see Methods). P values: unpaired, two-tailed T test. Error bar: standard deviation. Unless otherwise specified, Scale bar (10x): 170μm. Scale bar (25x): 68μm.

Similar articles

Cited by

References

    1. Carmona-Fontaine C. PhD Thesis. University College of London; 2011. Epub. http://carloscarmonafontaine.wikispaces.com/Thesis.
    1. Carmona-Fontaine C, Matthews H, Kuriyama S, Moreno M, Dunn G, Parsons M, Stern C, Mayor R. Contact inhibition of locomotion in vivo controls neural crest directional migration. Nature. 2008;456(7224):957–961. - PMC - PubMed
    1. Chapman S, Sawitzke A, Campbell D, Schoenwolf G. A three-dimensional atlas of pituitary gland development in the zebrafish. J Comp. Neurol. 2005;487:428–440. - PubMed
    1. Couly G, Le Douarin N. Mapping of the early neural primordium in Quail-Chick chimeras: 1. Developmental relationships between placodes, facial ectoderm, and prosencephalon. Dev. Bio. 1985;110:422–439. - PubMed
    1. De Calisto J, Araya C, Marchant L, Riaz CF, Mayor R. Essential role of non- canonical Wnt signaling in neural crest migration. Dev. 2005;132:2587–2597. - PubMed

LinkOut - more resources