. 2017 Jan 1;595(1):207-231.
doi: 10.1113/JP272780. Epub 2016 Sep 15.

In vivo matching of postsynaptic excitability with spontaneous synaptic inputs during formation of the rat calyx of Held synapse

Affiliations

In vivo matching of postsynaptic excitability with spontaneous synaptic inputs during formation of the rat calyx of Held synapse

Martijn C Sierksma et al. J Physiol. .

Abstract

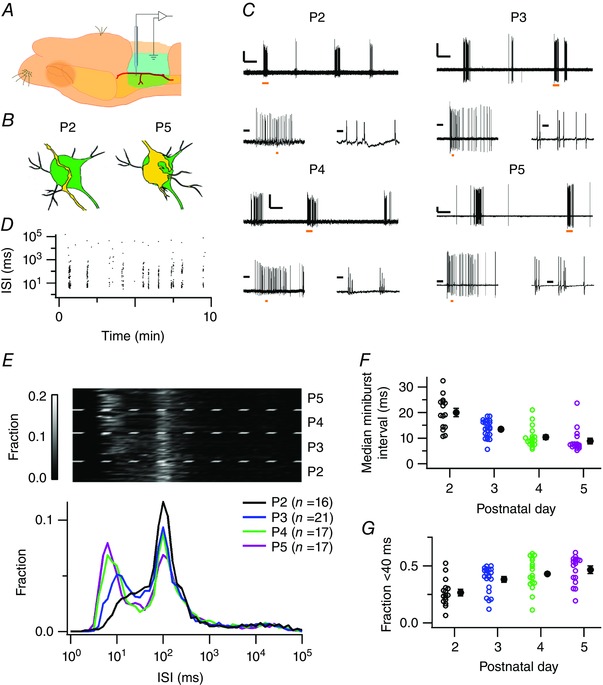
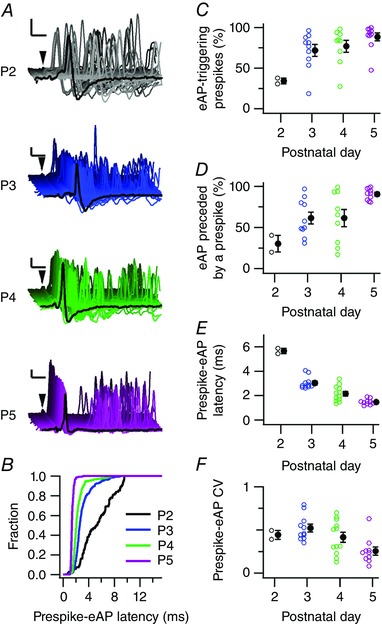
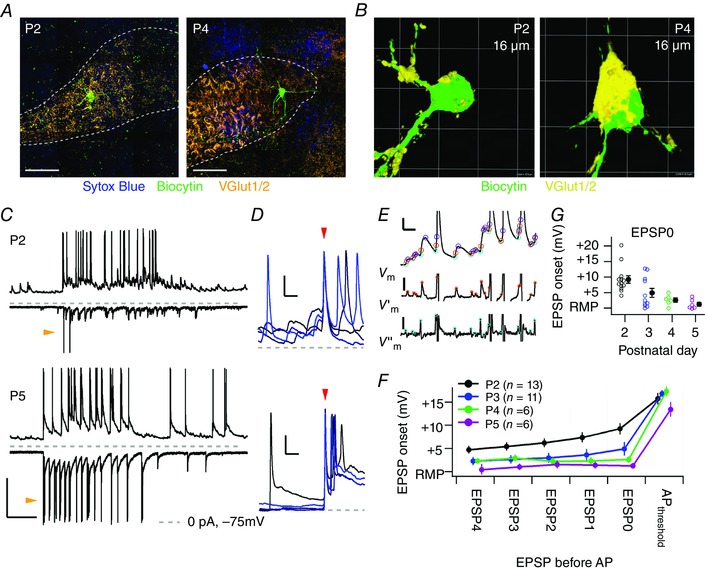
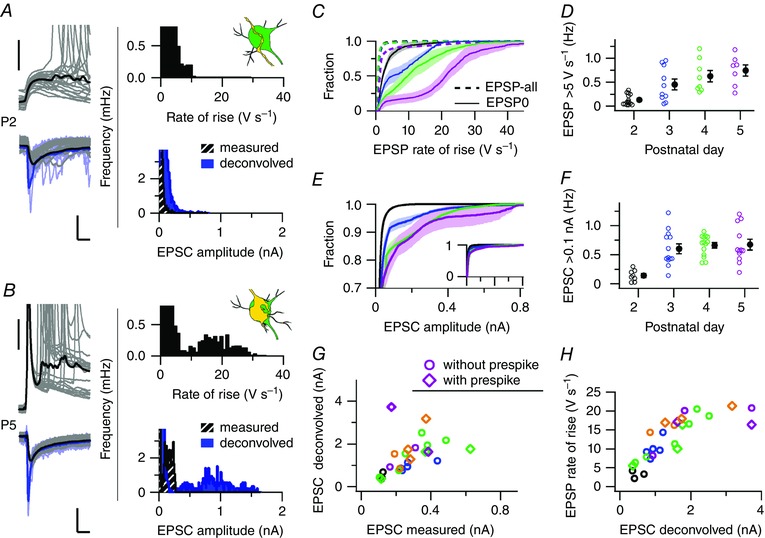
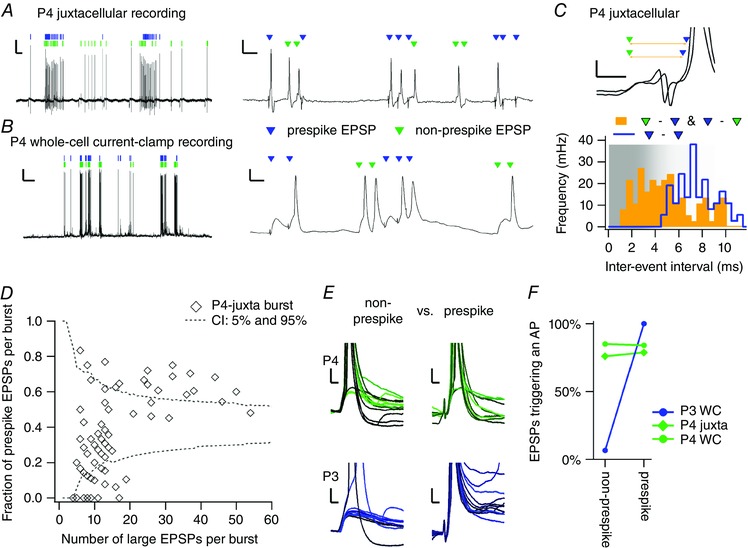
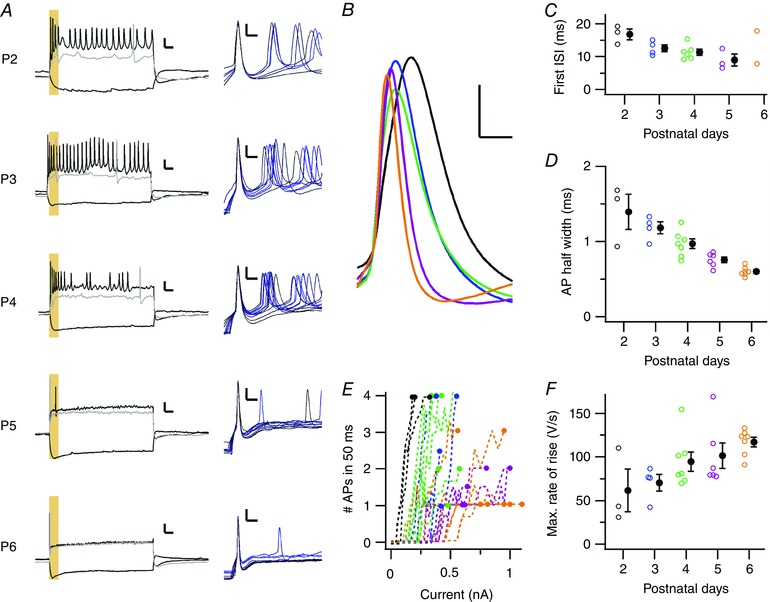
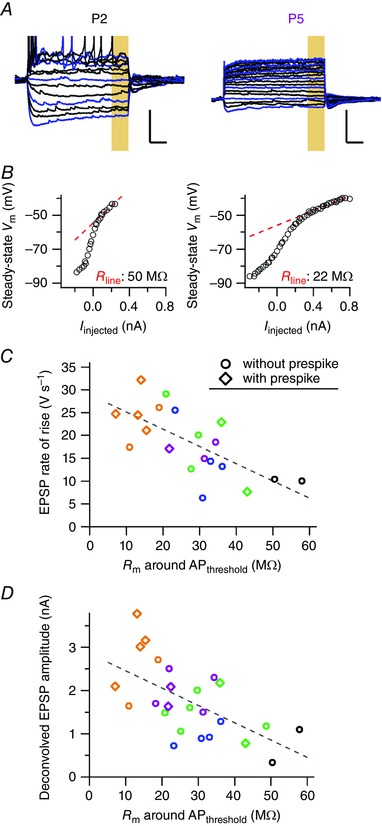
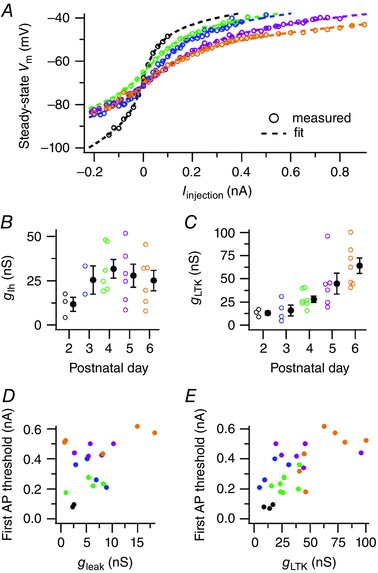
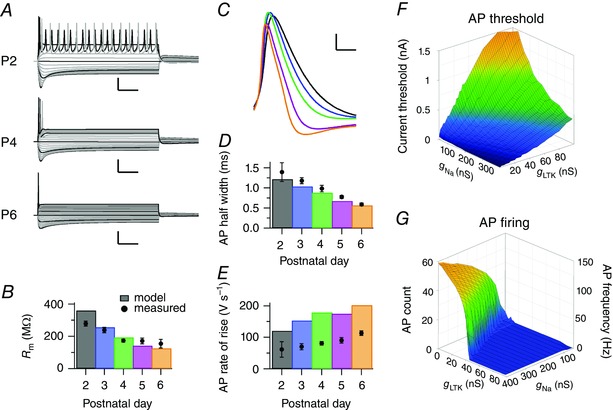
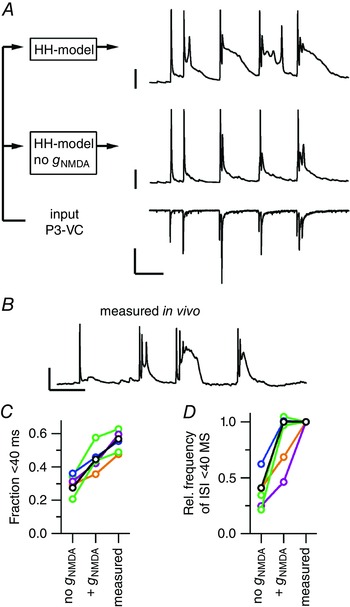
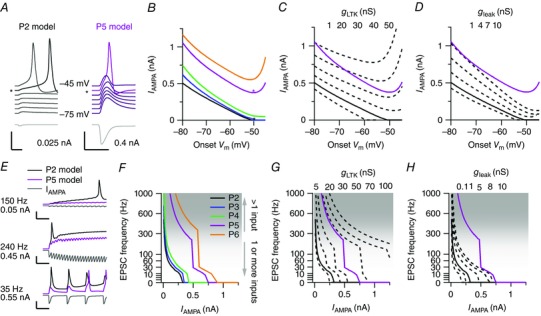
Key points: Neurons in the medial nucleus of the trapezoid body of anaesthetized rats of postnatal day (P)2-6 showed burst firing with a preferred interval of about 100 ms, which was stable, and a second preferred interval of 5-30 ms, which shortened during development. In 3 out of 132 cases, evidence for the presence of two large inputs was found. In vivo whole-cell recordings revealed that the excitability of the principal neuron and the size of its largest synaptic inputs were developmentally matched. At P2-4, action potentials were triggered by barrages of small synaptic events that summated to plateau potentials, while at later stages firing depended on a single, large and often prespike-associated input, which is probably the nascent calyx of Held. Simulations with a Hodgkin-Huxley-like model, which was based on fits of the intrinsic postsynaptic properties, suggested an essential role for the low-threshold potassium conductance in this transition.

Abstract: In the adult, principal neurons of the medial nucleus of the trapezoid body (MNTB) are typically contacted by a single, giant terminal called the calyx of Held, whereas during early development a principal neuron receives inputs from many axons. How these changes in innervation impact the postsynaptic activity has not yet been studied in vivo. We therefore recorded spontaneous inputs and intrinsic properties of principal neurons in anaesthetized rat pups during the developmental period in which the calyx forms. A characteristic bursting pattern could already be observed at postnatal day (P)2, before formation of the calyx. At this age, action potentials (APs) were triggered by barrages of summating EPSPs causing plateau depolarizations. In contrast, at P5, a single EPSP reliably triggered APs, resulting in a close match between pre- and postsynaptic firing. Postsynaptic excitability and the size of the largest synaptic events were developmentally matched. The developmental changes in intrinsic properties were estimated by fitting in vivo current injections to a Hodgkin-Huxley-type model of the principal neuron. Our simulations indicated that the developmental increases in Ih , low-threshold K+ channels and leak currents contributed to the reduction in postsynaptic excitability, but that low-threshold K+ channels specifically functioned as a dampening influence in the near-threshold range, thus precluding small inputs from triggering APs. Together, these coincident changes help to propagate bursting activity along the auditory brainstem, and are essential steps towards establishing the relay function of the calyx of Held synapse.

Keywords: excitability; response homeostasis; synapse formation.


Figures

Figure 1
Figure 1. Developmental changes in characteristic bursting pattern
A, illustration of the experimental approach. The MNTB is ventrally approached for electrophysiological recordings, using the origin of the bifurcation of the anterior–inferior cerebellar artery as a landmark. B, illustration of the structural development of the axon innervating the principal neuron of the MNTB. Left: a P2 principal neuron (green) is innervated by a passing axon (yellow). Right: at P5, the same neuron is covered by a protocalyx. C, four representative juxtacellular recordings obtained at P2–5 showing alternating periods of high activity and silence (upper trace). For each postnatal day, the left lower panel shows a single burst; the right lower panel shows that a burst is composed of minibursts, defined as a period with interspike intervals (ISIs) <40 ms. Orange bars indicate the periods that are expanded in the other panels. Scale bars for each age: 1 mV; upper panel: 10 s; left lower panel: 0.5 s; right lower panel: 20 ms. D, ISI against the time of recording of the P5 example shown in C. E, top: ISIs of individual experiments were logarithmically binned and coded in grey scale. Every horizontal line represents the probability density function of the ISIs of a single recording; the recordings were grouped by pup age, separated by the broken lines. Bottom: probability density functions averaged per postnatal day. While the 100 ms interval was unchanged, the miniburst interval shortened during development. F, median miniburst interval against postnatal day. G, fraction of miniburst intervals against postnatal day. Open circles are single neurons, filled circles are averages with SEM. [Colour figure can be viewed at wileyonlinelibrary.com]
Figure 2
Figure 2. Increased dependency of postsynaptic activity on a calyceal input in in vivo juxtacellular recordings from P2–5 rat pups
A, waterfall plots of aligned consecutive prespikes (arrowheads) from recordings from P2–5 pups. For each cell all recorded prespikes are shown. The jitter in the delay between prespike and postsynaptic eAP decreased with age. Black trace in front is a representative trace. Calibration bars are 2 ms and 1 mV. B, cumulative fraction of the prespike–eAP intervals of the example recordings in A, illustrating that the prespike interval became shorter and less variable during development. C, developmental increase in the fraction of prespikes that triggered a postsynaptic eAP. D, developmental increase in the fraction of eAPs that were preceded by a prespike. E, developmental decrease in average prespike–eAP latency. F, developmental changes in the coefficient of variation (CV) of the prespike–eAP latency. Open circles in CF are single data points, filled circles are averages with SEM. [Colour figure can be viewed at wileyonlinelibrary.com]
Figure 3
Figure 3. Action potentials are typically triggered in vivo by summation of small EPSPs at P2 and by a single, strong input at P4 or older
A, immunofluorescent stainings of the MNTB at P2 (left) and at P4 (right). Dotted line, MNTB borders; blue, nucleotide stain Sytox Blue; green, biocytin; orange, glutamate vesicle marker VGlut1/2. Scale bar = 50 μm. Ventral is to the bottom and medial is to the left. B, three‐dimensional reconstructions of biocytin‐stained neurons with nearby VGlut1/2 staining. C, example whole‐cell recordings from a principal neuron at P2 (top panel) and P5 (bottom panel) showing a period of increased activity; current‐clamp recordings (CC, top traces) show EPSPs and APs; voltage‐clamp recordings (VC, bottom traces) show EPSCs and, especially at P5, voltage‐clamp escaping action currents (orange arrowheads). Broken lines mark 0 pA for the VC recording and the −75 mV level for the CC recording. Bar = 30 mV, 500 pA and 500 ms. D, four example traces (colour‐coded) aligned on the first AP of a miniburst (red arrowhead) show the prelude to a miniburst at P2 (above) and P5 (below). At P2, multiple EPSPs summated to reach the AP threshold, whereas at P5 no summation was seen. Calibration bars = 10 mV, 10 ms. Grey dashed line marks the resting membrane potential of the recorded neuron. E, overview of the detection method based on the rate of rise. In the upper trace the CC recording with EPSPs and truncated APs obtained from a P2 pup is shown; the middle trace is the first time derivative of the CC recording; the lower trace is the second time derivative of the CC recording. Orange circles indicate the maximum rate of rise of the EPSP; light blue circles indicate the EPSP onset; purple circles indicate the EPSP peak. Calibration bars = 5 mV and 10 ms (top); 5 V s−1 (middle); 8 V s–2 (below). F, average onset membrane potential of the EPSPs preceding the first AP of the miniburst is plotted against the order number of the EPSP preceding the AP; EPSP0 is the EPSP reaching the AP threshold, EPSP1 the EPSP preceding EPSP0, etc. The membrane potentials are plotted relative to the resting membrane potential (RMP). Data points have been horizontally offset for display purposes. G, developmental changes in the average onset membrane potential of the EPSP directly preceding the first AP of the miniburst (EPSP0). The averages (filled circles with SEM) are also shown in F. [Colour figure can be viewed at wileyonlinelibrary.com]
Figure 4
Figure 4. Emergence of a large input during development
A, in a P2 principal neuron 20 EPSPs in CC (upper left) and 20 EPSCs in VC (lower left, grey), and the average big EPSP (black) and EPSC (black) aligned on the onset. VC recordings were deconvolved off‐line for capacitive filtering. The same EPSCs after deconvolution (light blue) and the average deconvolved EPSC (blue) are shown. Bars = 20 mV (upper), and 200 pA and 5 ms (lower). Upper right panel, the frequency distribution of EPSP rate of rise; lower right panel, the frequency distribution of EPSC amplitude. B, as A for a P5 principal neuron, illustrating the appearance of a separate population of large EPSPs and EPSCs. Bars as in A. C, averaged cumulative distributions of the maximal rate of rise of all EPSPs (dotted line) and the AP‐triggering EPSP (EPSP0, line) at the different ages (colour‐coded). A population of large EPSPs (>5 V s−1) emerges during development. Colours correspond to the age as in D. D, the frequency of large EPSPs (>5 V s−1) against postnatal day. E, truncated averaged cumulative distributions of the EPSC amplitude of different postnatal days (colour‐coded). Similar to C, large inputs (>100 pA) appeared during development. EPSCs were not deconvolved. Inset: the entire distributions with the same range of EPSC amplitudes. F, developmental increase in the frequency of large EPSCs (>100 pA). G, EPSC amplitudes before and after deconvolution. The data points are derived from a defined population of EPSCs based on either their rate of rise or the presence of a prespike. The deconvolution retrieved the fast peak of the EPSC, as shown in A and B. Circles are the large EPSCs, diamonds are the prespike‐related EPSCs. Colours correspond to age as in D and F, orange is P6. H, deconvolved EPSC amplitude against the rate of rise of the EPSP recorded from the same principal neuron. The two measures correlated almost linearly. Colours as in G. Open circles are single data points, filled circles are averages with SEM. [Colour figure can be viewed at wileyonlinelibrary.com]
Figure 5
Figure 5. Anecdotal evidence for multiple large inputs
A, juxtacellular recording of a P4 principal neuron with two inputs that often trigger an AP, of which one showed a prespike (blue triangle) and the other did not (green triangle). They were co‐active in the same bursts (left) and in the same miniburst (right). Calibration bars = 2 mV, 500 ms (left panel) and 10 ms (right panel). B, similar to A, but for a whole‐cell recording of a P4 principal neuron. C, two examples from the P4 juxtacellular recording where the non‐prespike‐related EPSP (green) was followed within 3 ms by a prespike‐related EPSP (blue). The yellow line indicates the inter‐event interval. Bars = 1 mV and 1 ms. Bottom, frequency of the inter‐event intervals; orange, intervals between prespike‐related and non‐prespike‐related EPSPs; blue, intervals between prespike‐related EPSPs. The shaded area depicts the intervals that might only be obtained from distinct inputs. D, fraction of prespike‐related EPSPs against the total number of large EPSPs (prespike + non‐prespike) within a single burst recorded from the P4 juxtacellular recording shown in A. Every diamond represents a burst. Dotted line indicates the confidence intervals based on the expected binomial distribution with the number of prespike‐EPSP/all large EPSPs. E, comparison of the synaptic strength of both large inputs. From the two whole‐cell recordings (P3 and P4) examples of the non‐prespike EPSP aligned on the maximal rate of rise (left) and of the prespike EPSP aligned on the prespike (right). In the P4 whole‐cell recording (top panel), both kinds of EPSPs were comparable in size and ability to trigger APs. In contrast, in the P3 whole‐cell example (bottom panel) the prespike‐related EPSPs were bigger and reliably triggered an AP while the non‐prespike EPSPs only rarely did. Bars = 5 mV and 2 ms. F, comparison of the percentage of EPSPs that triggered an AP for non‐prespike and prespike‐related EPSPs. A single line represents a single recording; the P3 whole‐cell recording is indicated with a blue circle, and was illustrated in E; the P4 juxtacellular recording is shown as a green diamond, and is illustrated in A and C; the P4 whole‐cell recording is shown as a green circle, and is illustrated in B and E. [Colour figure can be viewed at wileyonlinelibrary.com]
Figure 6
Figure 6. Developmental changes in postsynaptic action potentials
A, left, response of principal neurons to constant current injections at different postnatal days. Responses to a hyperpolarizing and two depolarizing current injections of 600 ms are shown. The response of the principal neuron to the smallest current injection that elicited AP firing is shown in grey. The yellow box indicates the first 50 ms of current injections. Right, the APs that were elicited at the start of the current injections are shown aligned on the peak potential. Colour corresponds to injected current amplitude. Bars = 20 mV and 50 ms in the left panels and 10 mV and 5 ms in the right panels. B, the average waveforms of the AP elicited at the start of the current injections in the five neurons shown in A are aligned on their AP threshold, illustrating that the AP kinetics become faster with age. Bars = 10 mV and 1 ms. Colours correspond to age as in C. C, developmental changes in first interspike interval (ISI). Around P5 the neurons typically fired only a single AP. D, developmental changes in AP half width. E, relationship between average number of APs elicited within the first 50 ms of the current injection (yellow box in A) and strength of current injection. Every line represents an average count of a single recorded neuron; the age is colour‐coded as in C. F, developmental change in maximal rate of rise of the AP. Open circles in C, D and F are single data points, filled circles are averages with SEM. [Colour figure can be viewed at wileyonlinelibrary.com]
Figure 7
Figure 7. Matching of excitability and synaptic inputs of principal neurons
A, membrane potential during constant‐current injections in a principal neuron from a P2 (left) and a P5 (right) rat pup. Displayed constant‐current injection responses start at −120 pA; blue, multiples of 60 pA; black, multiples of 20 pA. Bars = 20 mV and 100 ms. B, Corresponding I–V curves derived from the last 100 ms of the constant‐current injection (yellow box in A). The steady‐state membrane potentials between −50 and −45 mV were fitted and the slope of the fitted line (red dotted line) gave the steady‐state membrane resistance around AP threshold for both neurons. C, the average rate of rise of large EPSPs (>5 V s−1) against the membrane resistance around AP threshold. D, the deconvolved amplitude of large EPSCs (>0.1 nA) against the membrane resistance around AP threshold. For C and D, the dotted line correspond to a linear fit; black, blue, green, magenta and orange correspond to P2, P3, P4, P5 and P6, respectively; every point corresponds to a single neuron. [Colour figure can be viewed at wileyonlinelibrary.com]
Figure 8
Figure 8. Hodgkin–Huxley model fit of voltage‐dependent changes in membrane resistance
A, relationship between steady‐state membrane potentials against the injected current of five principal neurons. Broken lines show results of HH‐model fit. Individual points show averages from multiple current‐injections of a single cell; see B for colour lookup. B, developmental changes in fitted g Ih. Individual data points represent cells for which g Ih made a significant contribution to the fit. C, developmental changes in fitted g LTK. D, relationship between the minimal injected current needed for AP firing and fitted g leak. Only cells in which the leak conductance significantly contributed to the fit are displayed. E, relationship between the minimal injected current for AP firing and fitted g LTK. For B and C, open circles represent a single neuron, filled circles averages with SEM. For D and E, circles represent single neurons. [Colour figure can be viewed at wileyonlinelibrary.com]
Figure 9
Figure 9. The Hodgkin–Huxley model reproduced the in vivo intrinsic properties of the principal neuron
A, simulations for current injections using the standard model neuron for P2 (P2, top), P4 (P4, middle) and P6 (bottom). The first simulated current injection was at −200 pA; grey steps are incremental current injections of Δ20 pA; black steps of Δ100 pA. Calibration bars = 25 mV and 100 ms. B, bars, the developmental changes in membrane resistance according to the simulations, which were calculated from the steady‐state conductances at −70 to −75 mV; circles, average in vivo membrane resistance with SEM. C, average simulated AP waveforms of the first current‐injection elicited APs reveal similar developmental changes as in vivo (cf. Fig. 6 B). Calibration bars = 10 mV and 2 ms; colours correspond to age as in B. D, comparison of measured (filled circles) and simulated (bars) AP half widths shows similar developmental shortening. E, as D, except maximal rate of rise of the AP. F, relationship between g Na and g LTK and the minimum current injection needed to elicit an AP. Colours correspond to injected current. G, relationship between g Na and g LTK and AP frequency or number of evoked APs per 400 ms; g leak, g HTK and g Ih were kept constant at 2.5, 100 and 25 nS, respectively. Colours correspond to AP count; the blue plateau indicates one AP. [Colour figure can be viewed at wileyonlinelibrary.com]
Figure 10
Figure 10. Contribution of the NMDA conductance to the minibursts
A, left‐hand scheme indicates the modelling conditions with a P3 voltage‐clamp recording as input for the Hodgkin–Huxley model (HH‐model) either with or without the NMDA conductance with parameters based on the in vivo recorded neuron. Right, P3 voltage‐clamp recording that was used as input for the model (bottom), modelled current‐clamp recording without NMDA conductance (middle), modelled current‐clamp recording with NMDA conductance (top). Calibration bars = 1 nA (bottom), 25 mV (middle, top) and 100 ms. B, representative trace from the in vivo current‐clamp recording from the same neuron as in A. Calibration bars = 25 mV and 100 ms. C, the fraction of interspike intervals < 40 ms for six neurons (lines) for either the modelled values or the in vivo recording. D, as C, but for the frequency of intervals < 40 ms relative to the in vivo recording. Colours in C and D correspond to age: P2 black, P3 blue, P4 green, P5 magenta, P6 orange; the P3 neuron is shown in A and B. [Colour figure can be viewed at wileyonlinelibrary.com]
Figure 11
Figure 11. Dissection of the effect of the low‐threshold potassium conductance and the leak conductance on postsynaptic firing induced by one or multiple EPSCs
A, left, P2 model output in response to a 25 pA EPSC (grey, bottom panel) at onset membrane potentials ranging between −45 mV (top) and −75 mV (bottom). Right, P5 model output in response to 400 pA EPSC. The asterisk indicates the most negative onset membrane potential at which an AP was detected. Note that in the P5 model the EPSC did not elicit an AP at the −45 mV onset membrane potential. Both calibration bars = 20 mV, 300 pA and 10 ms. Colours are added for visual aid. B, relationship between the EPSC amplitude minimally needed to trigger an AP and the onset potential for different parameter sets, as illustrated in A. The asterisks correspond to the traces indicated with an asterisk in A. C, relationship between EPSC amplitude and the onset potential at different g LTK values for the P2 model (broken lines, values given at the top). Continuous lines indicate the standard P2 and P5 model for reference. D, as in C, but for g leak. E, three examples of EPSC trains (bottom, grey) with different frequencies and amplitudes and the corresponding output of the P2 model (top, black) and P5 model (top, magenta). Top traces start at −70 mV. Calibration bars = 25 mV, 500 pA and 20 ms. F, relationship between amplitude minimally needed to trigger an AP and the EPSC frequency for different parameter sets. Shaded area illustrates the frequency range that is unlikely to be attained by a single axon. G, relationship between the amplitude minimally needed to trigger an AP and EPSC frequency at different g LTK values for the P2 model (broken lines, values given at the top side). Continuous lines show the standard P2 and P5 model for reference. H, as in G but for different g leak values. For C, D, G and H, the conductance values listed on top from left to right correspond to the traces from left to right. For FH, the resting membrane potential was set at −70 mV. [Colour figure can be viewed at wileyonlinelibrary.com]

Similar articles

Cited by

References

    1. Allene C & Cossart R (2010). Early NMDA receptor‐driven waves of activity in the developing neocortex: physiological or pathological network oscillations? J Physiol 588, 83–91. - PMC - PubMed
    1. Ankri N, Legendre P, Faber DS & Korn H (1994). Automatic detection of spontaneous synaptic responses in central neurons. J Neurosci Methods 52, 87–100. - PubMed
    1. Banks MI & Smith PH (1992). Intracellular recordings from neurobiotin‐labeled cells in brain slices of the rat medial nucleus of the trapezoid body. J Neurosci 12, 2819–2837. - PMC - PubMed
    1. Belleau ML & Warren RA (2000). Postnatal development of electrophysiological properties of nucleus accumbens neurons. J Neurophysiol 84, 2204–2216. - PubMed
    1. Bergsman JB, De Camilli P & McCormick DA (2004). Multiple large inputs to principal cells in the mouse medial nucleus of the trapezoid body. J Neurophysiol 92, 545–552. - PubMed

Publication types

LinkOut - more resources