. 2016 Aug 8;26(15):1975-1989.
doi: 10.1016/j.cub.2016.06.012. Epub 2016 Jul 14.

Systems Analysis of the Dynamic Inflammatory Response to Tissue Damage Reveals Spatiotemporal Properties of the Wound Attractant Gradient

Affiliations

Systems Analysis of the Dynamic Inflammatory Response to Tissue Damage Reveals Spatiotemporal Properties of the Wound Attractant Gradient

Helen Weavers et al. Curr Biol. .

Abstract

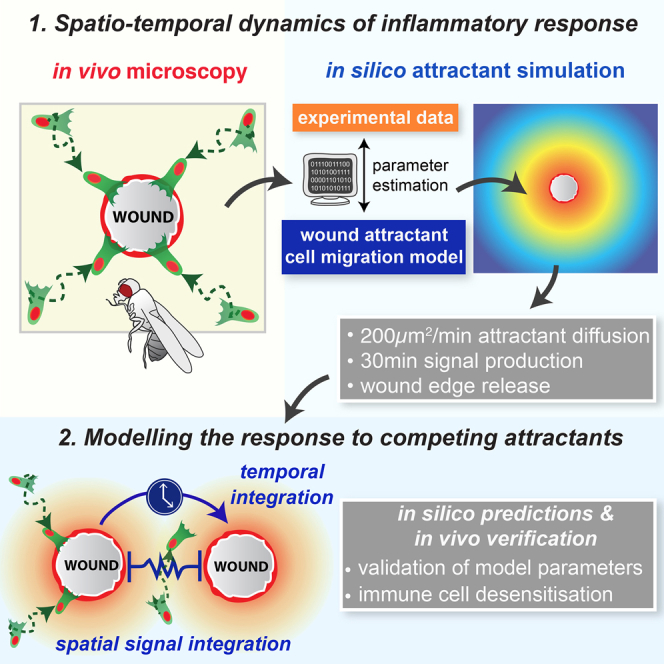
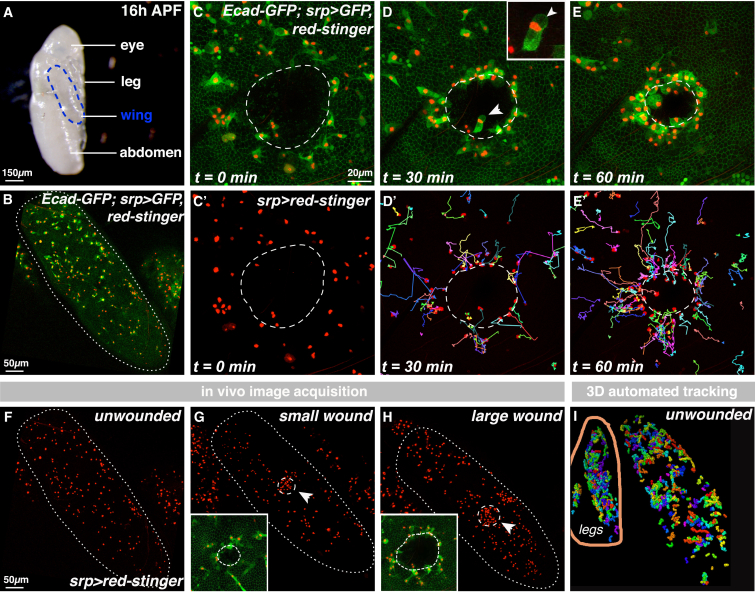
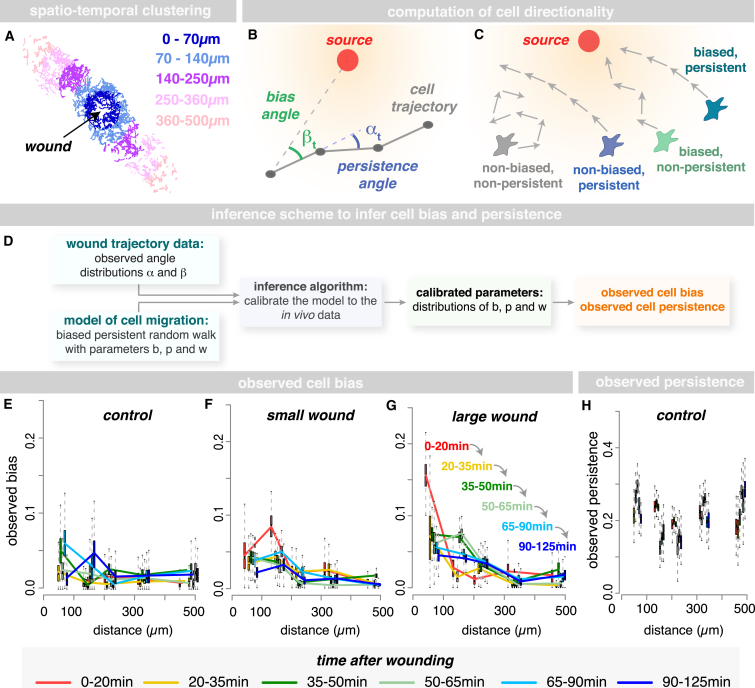
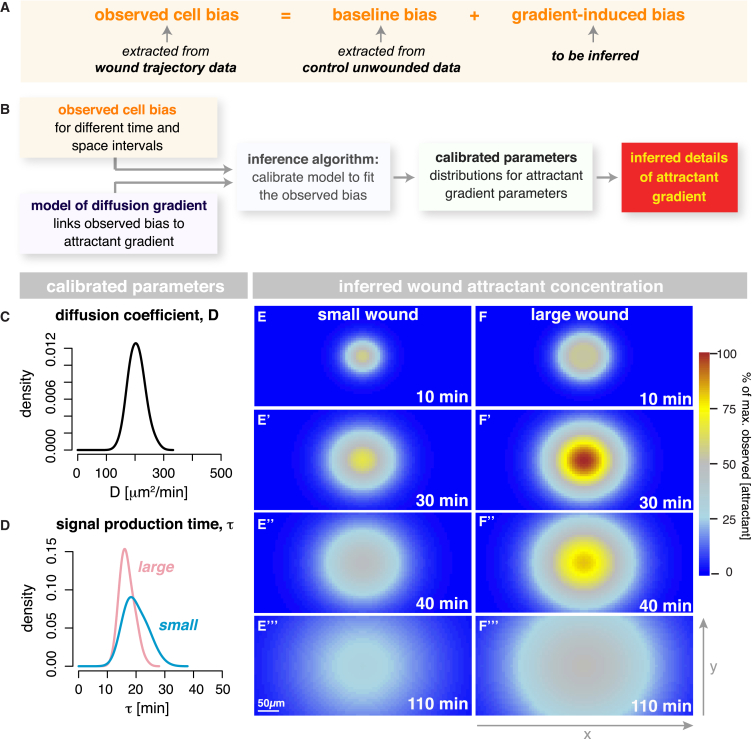
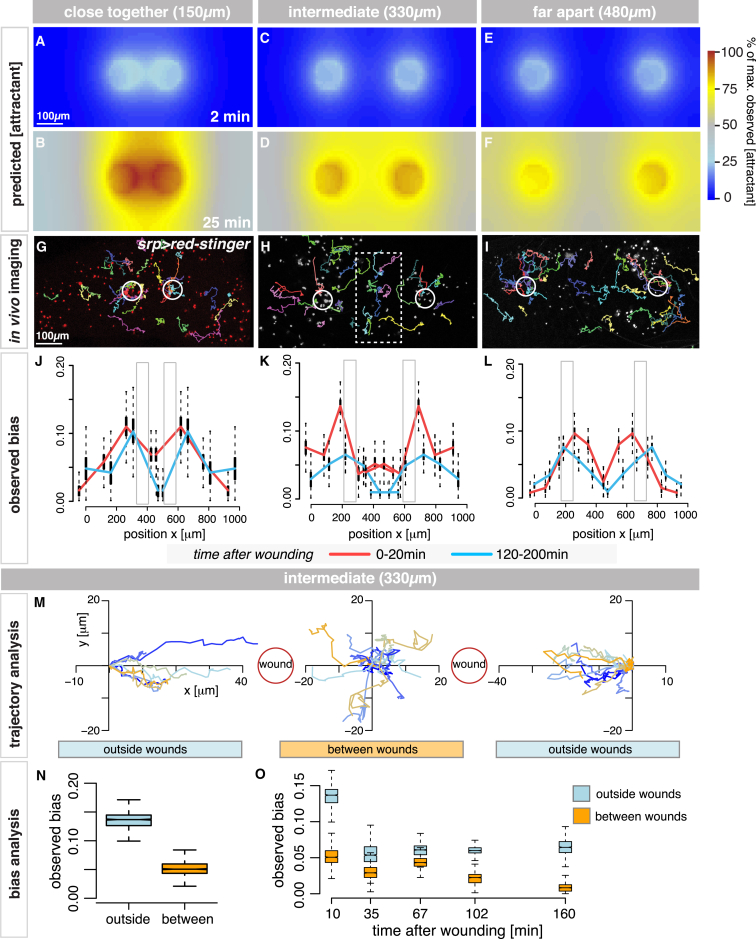
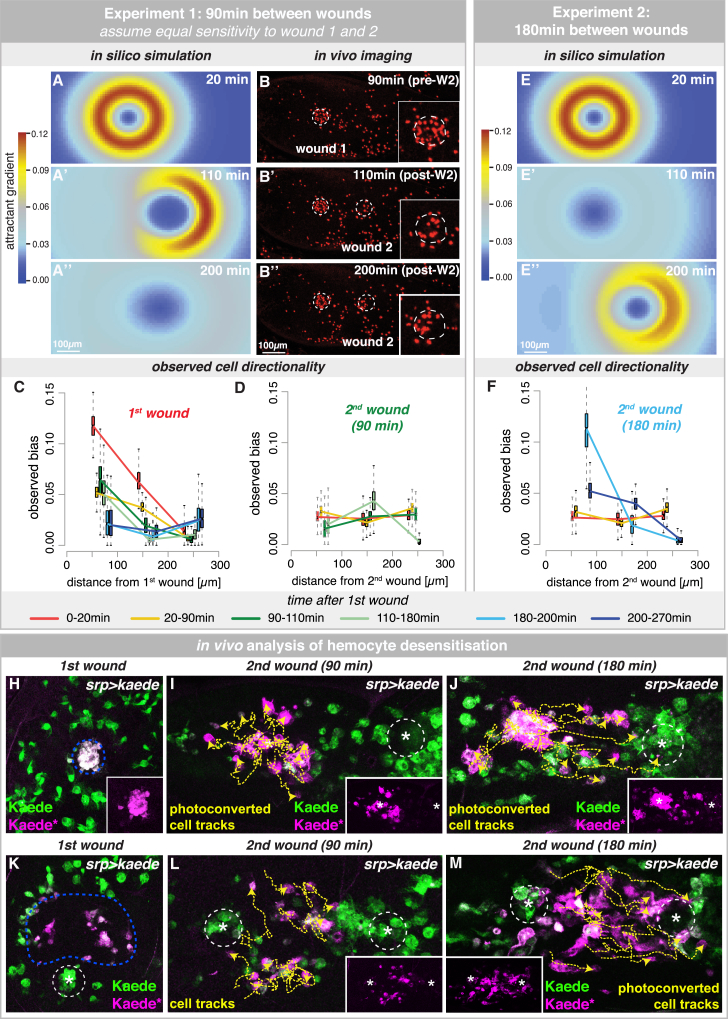
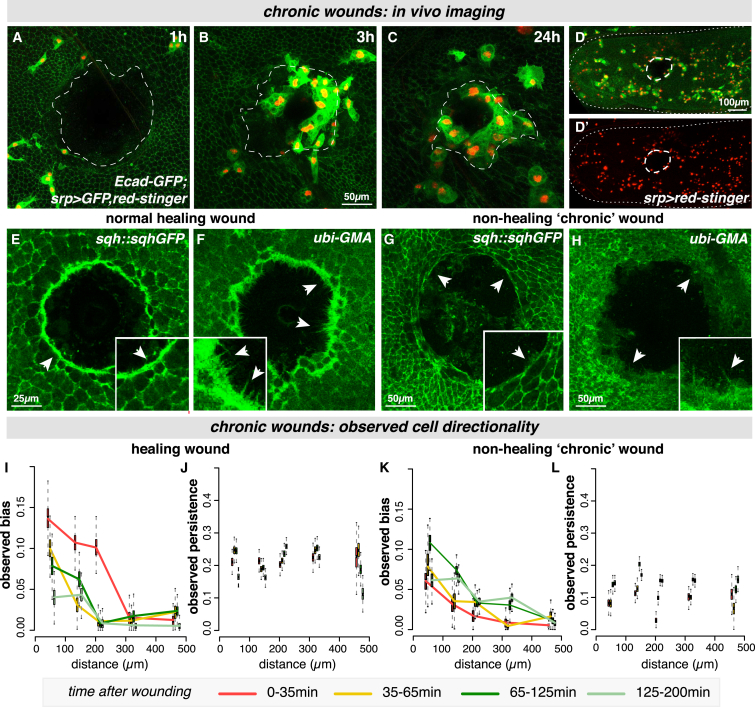
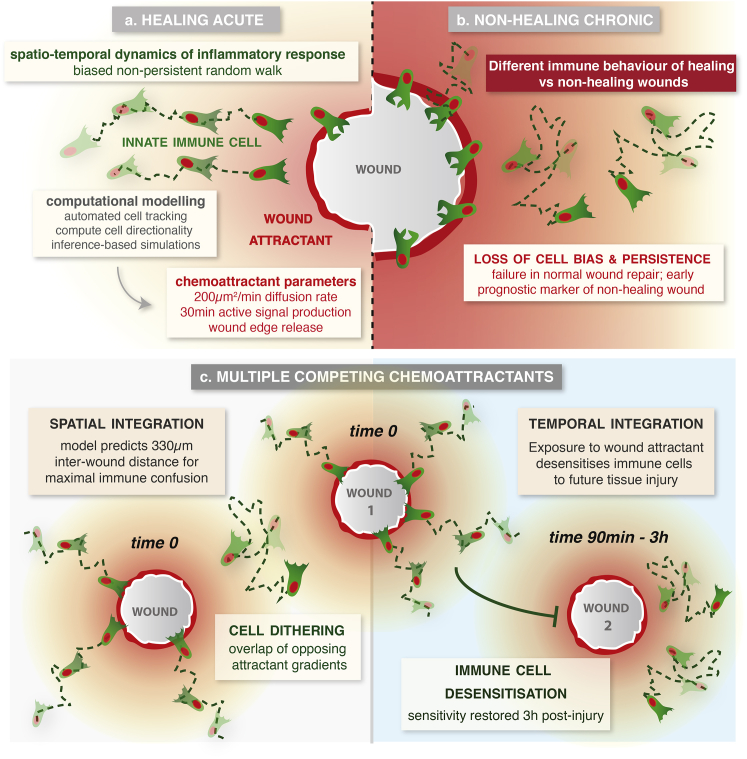
In the acute inflammatory phase following tissue damage, cells of the innate immune system are rapidly recruited to sites of injury by pro-inflammatory mediators released at the wound site. Although advances in live imaging allow us to directly visualize this process in vivo, the precise identity and properties of the primary immune damage attractants remain unclear, as it is currently impossible to directly observe and accurately measure these signals in tissues. Here, we demonstrate that detailed information about the attractant signals can be extracted directly from the in vivo behavior of the responding immune cells. By applying inference-based computational approaches to analyze the in vivo dynamics of the Drosophila inflammatory response, we gain new detailed insight into the spatiotemporal properties of the attractant gradient. In particular, we show that the wound attractant is released by wound margin cells, rather than by the wounded tissue per se, and that it diffuses away from this source at rates far slower than those of previously implicated signals such as H2O2 and ATP, ruling out these fast mediators as the primary chemoattractant. We then predict, and experimentally test, how competing attractant signals might interact in space and time to regulate multi-step cell navigation in the complex environment of a healing wound, revealing a period of receptor desensitization after initial exposure to the damage attractant. Extending our analysis to model much larger wounds, we uncover a dynamic behavioral change in the responding immune cells in vivo that is prognostic of whether a wound will subsequently heal or not. VIDEO ABSTRACT.


Figures

None
Graphical abstract
Figure 1
Figure 1
In Vivo Imaging and 3D Tracking of the Acute Inflammatory Response (A–E′) The pupal wing (outlined in A and B) contains innate immune cells (hemocytes, B; srp-Gal4 drives hemocyte expression of UAS-nuclear-red-stinger and UAS-GFP). Upon wounding the epithelium (dashed outline, C and C′; Ecadherin-GFP), hemocytes are recruited toward the damage site (D and E; multicolored cell tracks in D′ and E′), where they phagocytose wound debris (phagocytic vacuole indicated by arrows in D and inset). (F–H) in vivo data acquisition: unwounded controls for basal hemocyte behavior (F) and two wound sizes for the spatiotemporal dynamics of hemocyte wound recruitment (arrows and insets; small, 55 μm, wounds in G and large, 110 μm, wounds in H). (I) 3D automated tracking extracts cell trajectories (shown for control unwounded wings). Data from outside the wing (e.g., legs) were manually excluded. See also Figure S1 and Movies S1 and S2.
Figure 2
Figure 2
Modeling Spatiotemporal Dynamics of the Inflammatory Response (A–D) Trajectories are subdivided into five spatial clusters (A). Cell directionality inferred using a biased persistent random walk model (B and C) and trajectories described as a sequence of motion vectors (gray, B) between consecutive time points (black dots, B). Cell bias and persistence are inferred from the angles βt (green, B) between the motion vector and the direction toward the source (red dot, B) and the angles αt (blue, B) between the current and preceding motion vector, using an inference-based approach (D, with b and p describing the persistence and bias parameters, respectively, and w describing the probability of a biased motion). (E–H) Control hemocytes migrate with a constant persistence (H) and very low basal bias (E). Injury causes a rapid increase in bias toward the wound (small wound, F; large wound, G); cells located nearest to the injury (0–100 μm) respond most rapidly (red lines, F and G). Hemocytes distant to the wound respond at successively later time points (yellow, green, and blue lines in G). Boxplots represent estimated marginal posterior parameter distributions for observed bias (E–G) and persistence (H), showing the full distribution with median and 5th, 25th, 75th, and 95th percentiles. See also Figure S2.
Figure 3
Figure 3
Quantification of the Wound-Induced Chemoattractant Gradient (A and B) Cell bias depends on “baseline bias,” which exists in the absence of injury, and “wound-induced bias,” triggered by tissue damage (A). In (B), a wound attractant gradient is modeled, using a standard 2D diffusion model. Using a Bayesian inference approach, we infer the set of parameters that best explains our experimental data. (C–F′′′) The best-fit model indicates that the wound attractant diffuses at approximately 200 μm2/min (C) and is actively produced by the wound for ∼30 min (D). Quantification of the spatiotemporal behavior of the wound attractant for both small (E–E′′′) and large (F–F′′′) wounds (heatmaps in E and F). Colors (see scale bar) represent attractant concentrations relative to the highest predicted concentration from 0% to 100%. See also Figure S3 and Movie S3.
Figure 4
Figure 4
Modeling the Inflammatory Response to Competing Attractant Cues (A–F) For wounds close together, attractant gradients overlap and mimic a single, very large wound (A and B), predicting less biased migration in the inter-wound region. For wounds far apart, attractant gradients will not interact (E and F), and hemocytes respond as for two single wounds. For wounds of intermediate distance apart (C), attractant gradients will strongly overlap by 25 min (D), creating shallower gradients in the inter-wound region. (G–O) In vivo imaging (G–I) with representative hemocyte tracks; srp-Gal4 drives UAS-nuclear-red-stinger. Two close wounds caused reduced bias in the inter-wound region (red and blue, J) while two wounds far apart behaved separately, with slightly reduced bias on the outer sides of the wing (L). For wounds at an intermediate distance, cell bias was significantly lower in the inter-wound region (K and N) for all time points examined (O), with clear hemocyte confusion in vivo (boxed cell tracks in H and plotted trajectories in M). Gray boxes indicate wound position (J–L). See also Figure S4 and Movies S4 and S5.
Figure 5
Figure 5
Modeling Repetitive Tissue Injury Uncovers a Period of Hemocyte Desensitization (A–D) Simulated interaction of attractants from wounds made 90 min apart, assuming that hemocytes respond to both wounds with equal sensitivity (A–A′′). Crescent shape of attractant gradient reflects impact of residual wound 1 attractant on newly made wound 2 (W2) (A′). In vivo time-lapse imaging (B–B′′; srp>nuclear-red-stinger) confirms a normal response to the first wound (C) but reveals a significantly reduced response to the second wound, more similar to unwounded tissues (D). (E and F) Simulated interaction of attractant gradients for two wounds made 3 hr apart, assuming hemocytes are fully resensitized to the attractant (E–E′′). In vivo imaging confirms this prediction (F). In (C, D, and F), boxplots represent the marginal posterior parameter distributions for the observed bias estimated from extracted cell trajectories for each spatiotemporal cluster. (H–M) srp-Gal4 drives expression of photoconvertible fluorophore Kaede (green) in hemocytes. Kaede photoconversion (majenta) tags hemocytes localized at (H–J) or adjacent to (K–M) the first wound. Tagged hemocytes (magenta; also see insets) are blind to a second wound made 90 min after the initial injury (I and L) but drawn to a second wound made 3 hr later (J and M). Representative tracks (yellow) of tagged cells show hemocyte behavior following the second wound. See also Figure S5.
Figure 6
Figure 6
Distinct Hemocyte Behaviors Associated with Non-healing Wounds (A–D′) In vivo imaging of extra-large “chronic” wounds (130-μm diameter) that fail to heal and remain open 24 hr post-injury (A–C; wound edge outlined in white) with low-level persistent inflammation (B–D). Epithelium labeled with E-cadherin-GFP and hemocytes with srp > nuclear-red-stinger, GFP. Data from live-imaging in (D′) used to compute hemocyte directionality. (E–H) Normal healing wounds close using a contractile acto-myosin cable (sqh-GFP, arrowheads, E) and leading-edge protrusions (GFP-moesin, arrowheads, F), but chronic “non-healing” wounds lack a stable actin cable (arrowheads, G) and have only rare protrusions (arrowheads, H). (I–L) For healing wounds, hemocytes respond with similar levels of bias and persistence as for previous large wounds (I and J). Hemocytes associated with “non-healers” exhibited little or no bias toward the wound (K), even at the earliest time points (red line, K), and significantly less persistence (L). Boxplots represent estimated parameter distributions for bias and persistence. See also Figure S6 and Movie S6.
Figure 7
Figure 7
Modeling the In Vivo Inflammatory Response to Single Acute, Chronic, and Competing Wounds Computational modeling uncovered the spatiotemporal dependence of immune cell behavior in response to wounding in vivo, revealing a wave-like cell response that enabled quantification of the wound attractant gradient (a). For extra-large wounds that fail to heal (b), immune cells behave dramatically differently, exhibiting very low bias and persistence even from earliest stages. Using these parameters, we model more complex immune behavior (c), predicting the inter-wound distance to generate maximal immune cell confusion due to spatial integration of overlapping attractants and revealing a temporary desensitization period after initial wound exposure.

Comment in

References

    1. Eming S.A., Martin P., Tomic-Canic M. Wound repair and regeneration: mechanisms, signaling, and translation. Sci. Transl. Med. 2014;6:265sr6. - PMC - PubMed
    1. Nourshargh S., Hordijk P.L., Sixt M. Breaching multiple barriers: leukocyte motility through venular walls and the interstitium. Nat. Rev. Mol. Cell Biol. 2010;11:366–378. - PubMed
    1. McDonald B., Kubes P. Cellular and molecular choreography of neutrophil recruitment to sites of sterile inflammation. J. Mol. Med. (Berl) 2011;89:1079–1088. - PubMed
    1. McDonald B., Pittman K., Menezes G.B., Hirota S.A., Slaba I., Waterhouse C.C., Beck P.L., Muruve D.A., Kubes P. Intravascular danger signals guide neutrophils to sites of sterile inflammation. Science. 2010;330:362–366. - PubMed
    1. Davalos D., Grutzendler J., Yang G., Kim J.V., Zuo Y., Jung S., Littman D.R., Dustin M.L., Gan W.-B. ATP mediates rapid microglial response to local brain injury in vivo. Nat. Neurosci. 2005;8:752–758. - PubMed

Publication types

Substances

LinkOut - more resources