. 2016 Jul 28;166(3):582-595.
doi: 10.1016/j.cell.2016.06.024. Epub 2016 Jul 14.

AIRE-Deficient Patients Harbor Unique High-Affinity Disease-Ameliorating Autoantibodies

Collaborators, Affiliations

AIRE-Deficient Patients Harbor Unique High-Affinity Disease-Ameliorating Autoantibodies

Steffen Meyer et al. Cell. .

Abstract

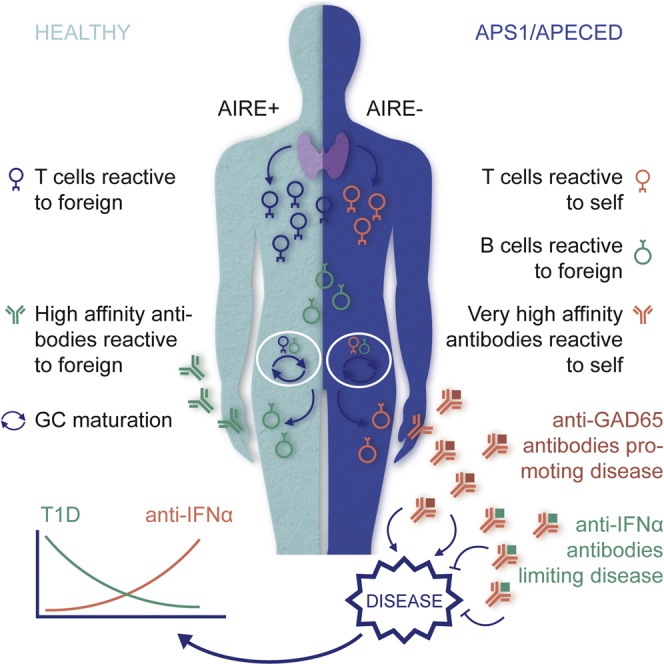
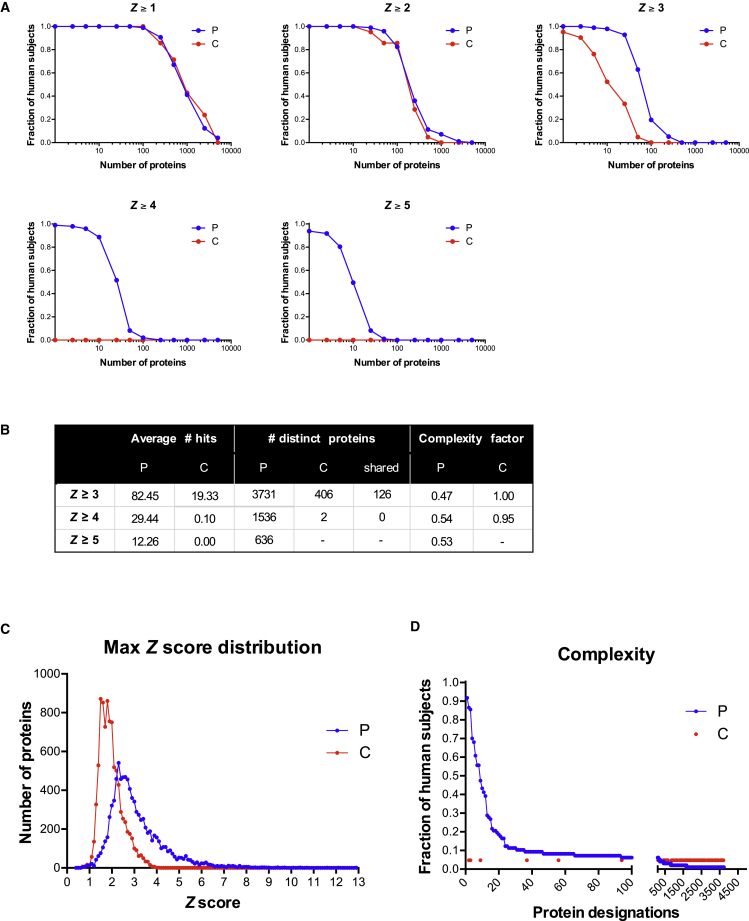
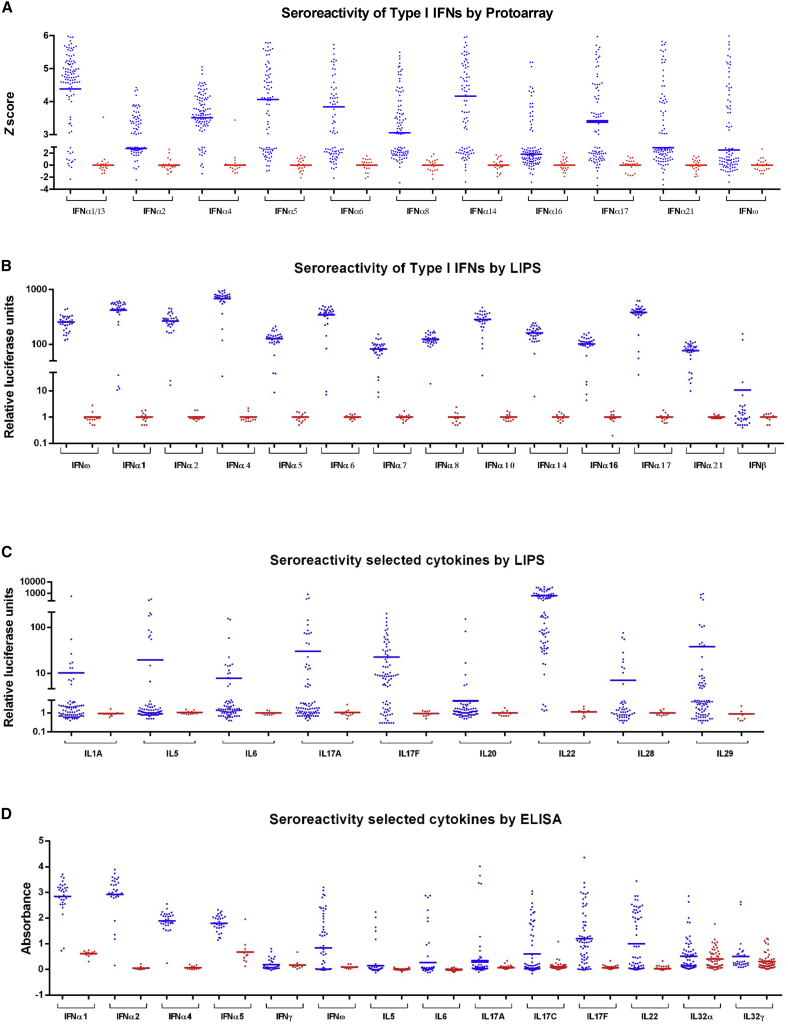
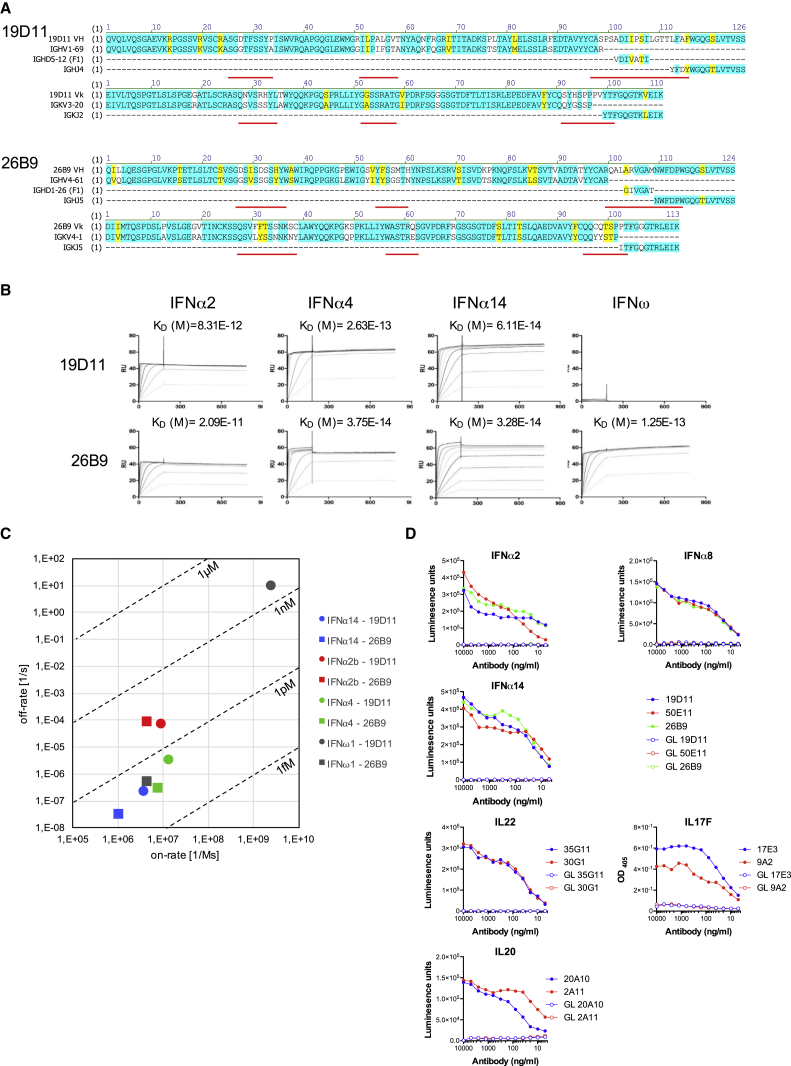
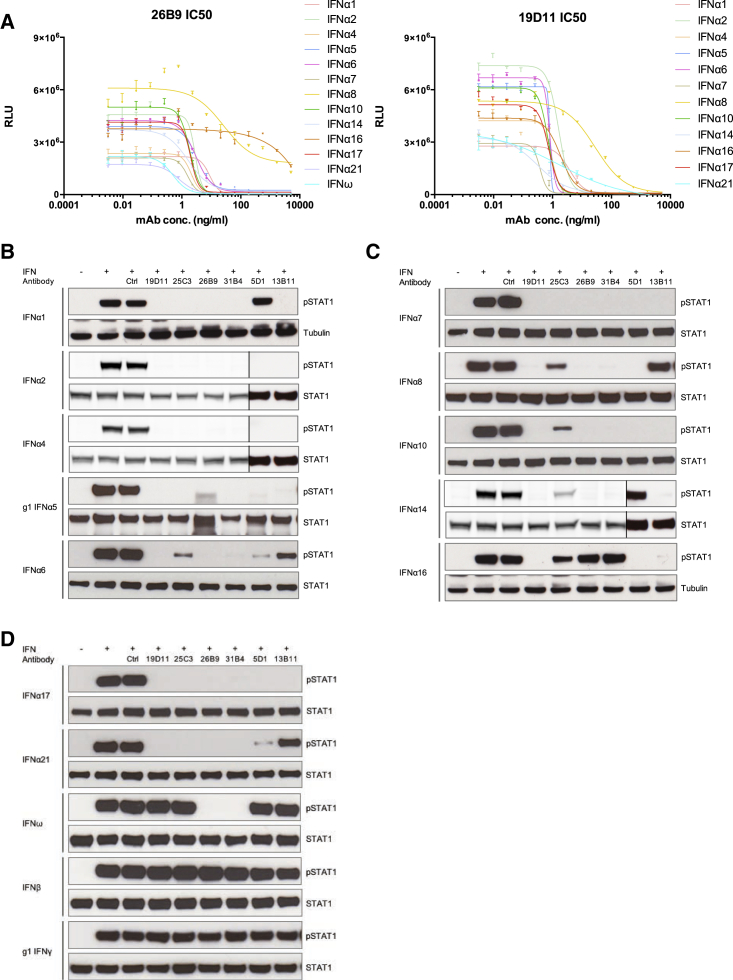
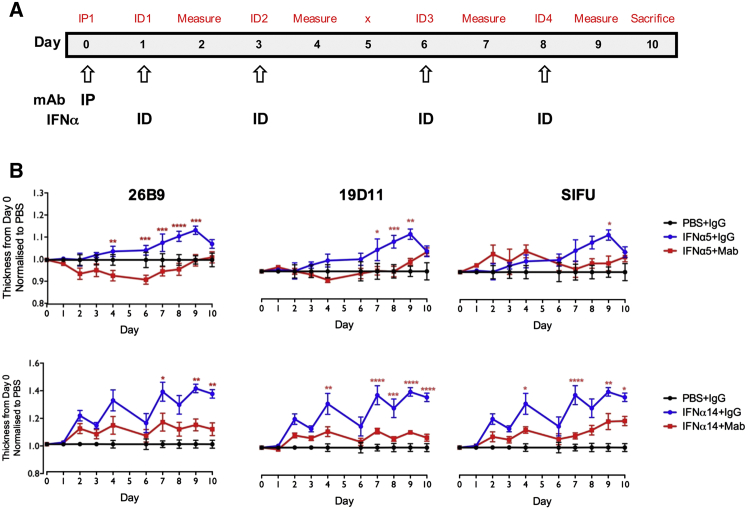
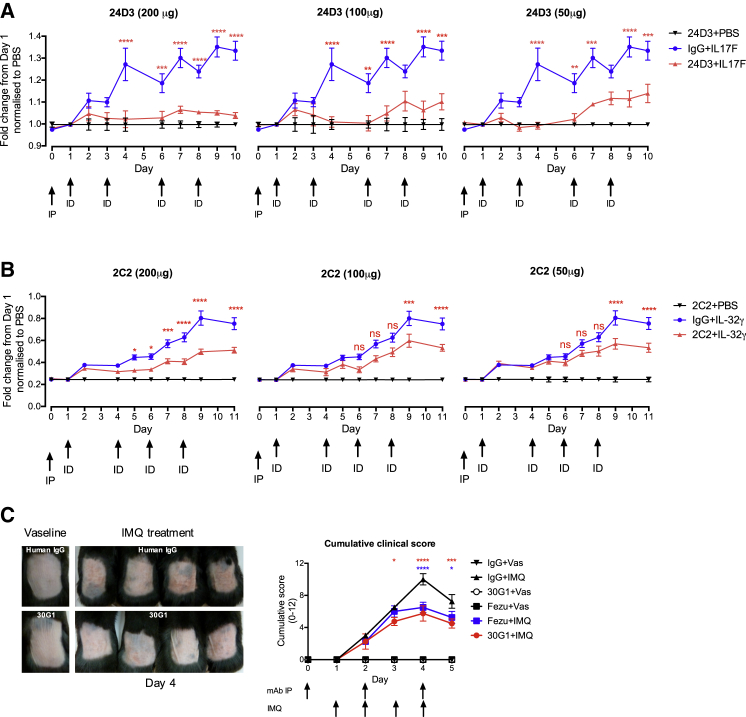
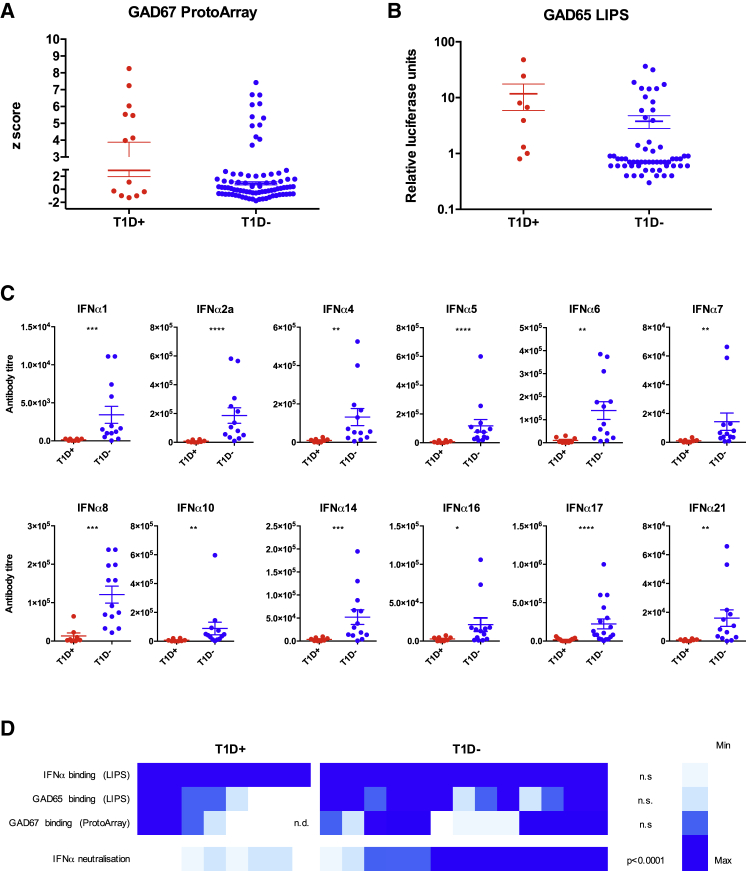
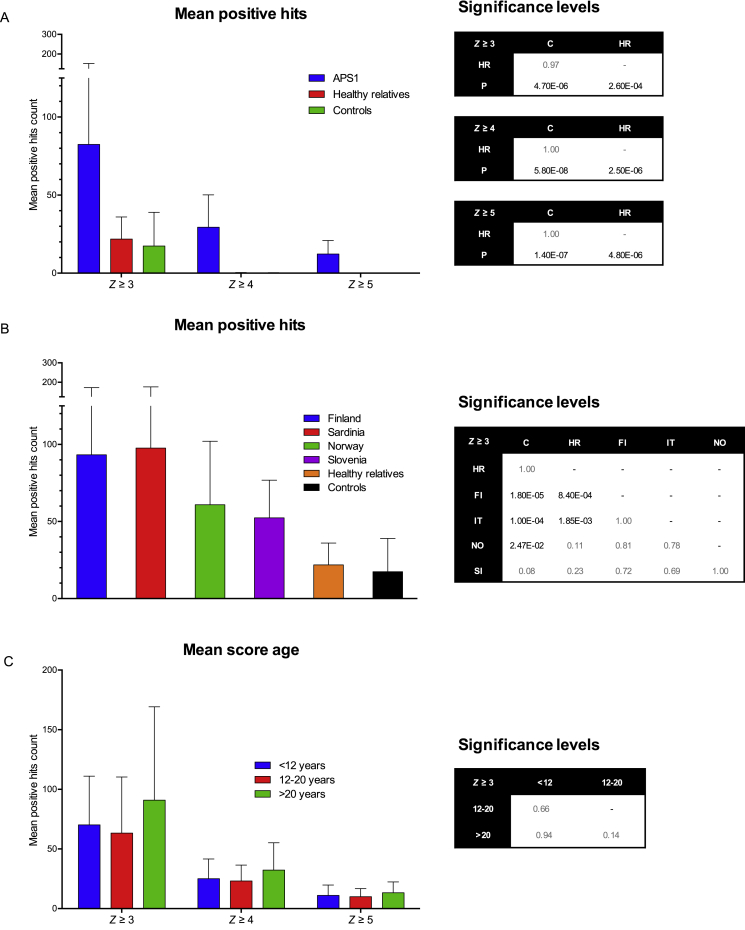
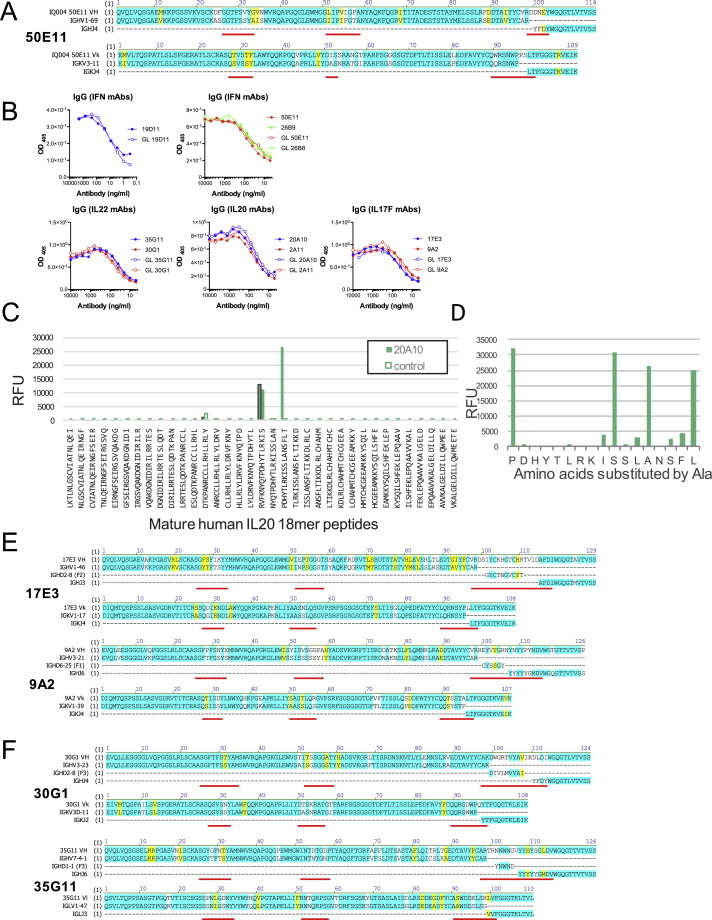
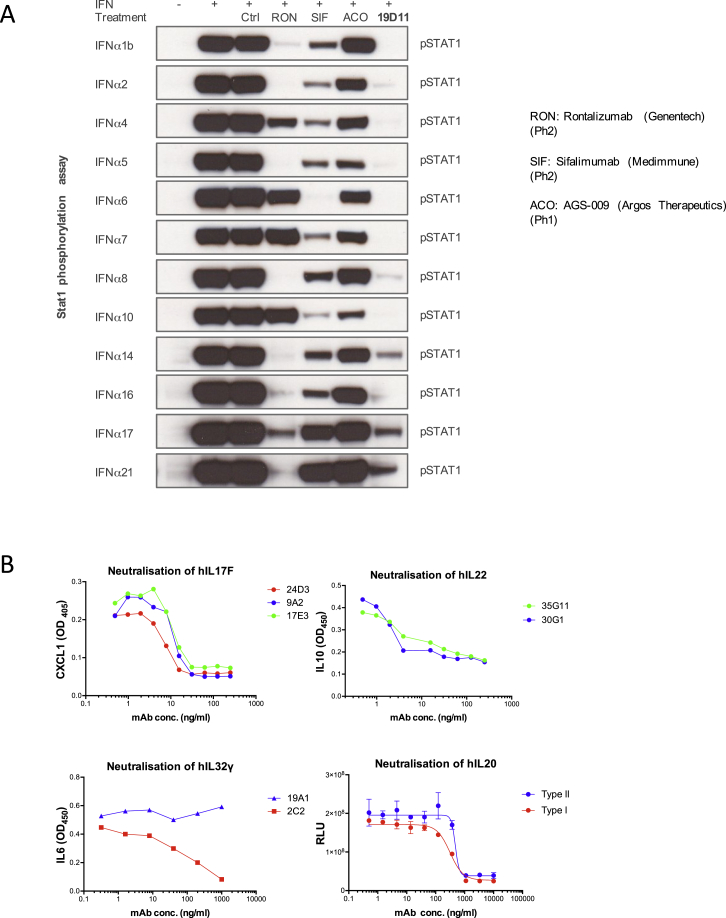
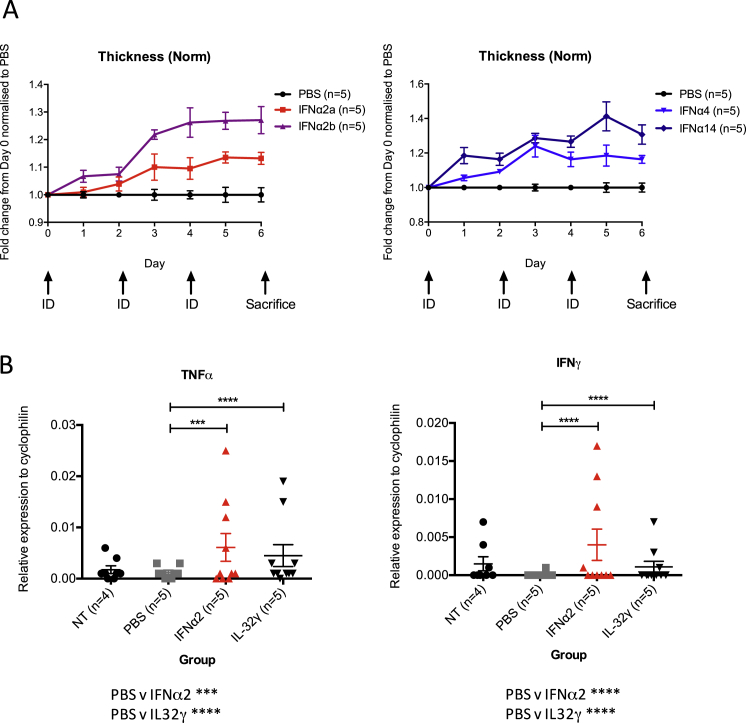
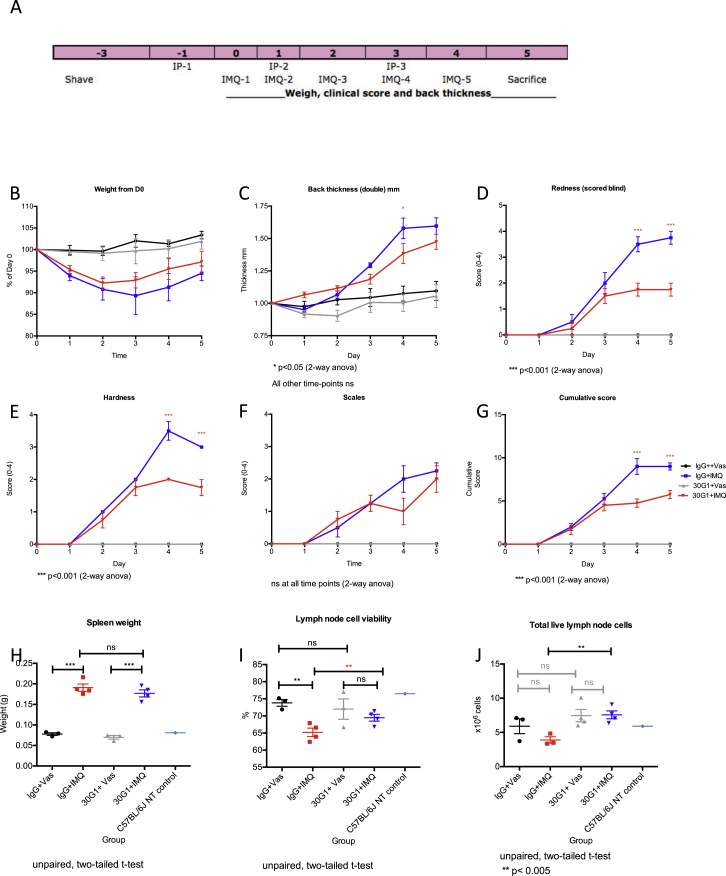
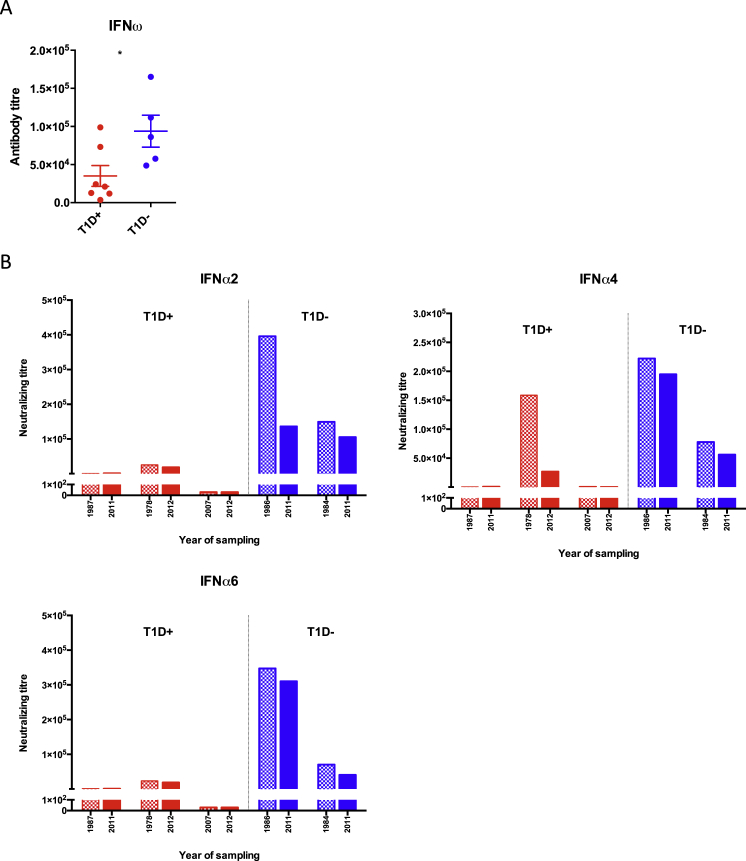
APS1/APECED patients are defined by defects in the autoimmune regulator (AIRE) that mediates central T cell tolerance to many self-antigens. AIRE deficiency also affects B cell tolerance, but this is incompletely understood. Here we show that most APS1/APECED patients displayed B cell autoreactivity toward unique sets of approximately 100 self-proteins. Thereby, autoantibodies from 81 patients collectively detected many thousands of human proteins. The loss of B cell tolerance seemingly occurred during antibody affinity maturation, an obligatorily T cell-dependent step. Consistent with this, many APS1/APECED patients harbored extremely high-affinity, neutralizing autoantibodies, particularly against specific cytokines. Such antibodies were biologically active in vitro and in vivo, and those neutralizing type I interferons (IFNs) showed a striking inverse correlation with type I diabetes, not shown by other anti-cytokine antibodies. Thus, naturally occurring human autoantibodies may actively limit disease and be of therapeutic utility.


Figures

None
Graphical abstract
Figure 1
Figure 1
Immune Response Profiling of APS1/APECED (A) Distributions of hits between patients and controls at different Z scores. (B) Z scores for all samples against all protein features and mean hits for each group calculated for Z ≥ 3, Z ≥ 4, and Z ≥ 5. The number of distinct proteins targeted in each group (P, n = 97; C, n = 21) at Z scores denoted. The complexity factor was calculated by dividing the number of distinct proteins by average number of hits per patient. (C) The max Z score distribution of all proteins in patient and control groups. (D) Fraction of patients recognizing each of 3,731 proteins at Z ≥ 3. Red dots depict 126 proteins shared between patients and controls.
Figure 2
Figure 2
Serology of APS1/APECED to IFNs and Other Cytokines Seroreactivity of APS1/APECED patients (blue) and contols (red) toward selected interferons and cytokines as measured in ProtoArray (A), LIPS (B and C), and ELISA (D).
Figure 3
Figure 3
Affinity of Patient-Derived mAbs (A) Amino acid sequences of 26B9 and 19D11 anti-IFN antibodies aligned with closest corresponding germline IgVH, DH, JH, VL, and JL sequences. Identities highlighted in blue; conservative mutations in yellow; non-conservative in white; CDRs underlined in red. (B) Plasmon resonance data: antibodies 19D11 and 26B9 were immobilized on Biacore chips; different concentrations of recombinant human IFNα2b, IFNα4, IFNα14, and IFNω were passed over; response units were recorded; and dissociation constants (KD) calculated. (C) Scatter chart of KD values derived from (B). (D) Binding determined by LIPS of APS1/APECED-derived mAbs and of germline counterparts to IFNα2, IFNα8, IFNα14 (19D11, 50E11, and 26B9), IL22 (35G11 and 30G1), and IL20 (20A10 and 2A11). Binding to immobilized IL17F (17E3 and 9A2) was determined by ELISA.
Figure 4
Figure 4
In Vitro Neutralization (A) IC50 analysis of APS1/APECED-derived anti-IFN mAbs 19D11 and 26B9 in HEK293T MSR cells transfected with ISRE dual-luciferase reporter constructs and treated with IFNα subtypes shown. Error bars correspond to SEM of multiple measurements. (B–D) IFN-induced STAT1 tyrosine phosphorylation detected by western blot and normalized to total STAT1 or to tubulin levels as loading controls. Vertical lines in (B) and (C) denote cropped lanes.
Figure 5
Figure 5
Biological Activity of IFN mAbs (A) Experimental timeline: mAb administered i.p. at day 0; human IFNα administered i.d. on days 1, 3, 6, and 8. Ear thickness measured on all days (prior to cytokine injection) except for day 5. (B) I.p.-administered IFN mAbs reduced IFNα-induced ear inflammation. Significance calculated by two-way ANOVA, with p ≤ 0.05, ∗∗p ≤ 0.01, ∗∗∗p ≤ 0.001, and ∗∗∗∗p ≤ 0.0001. Error bars denote SEM.
Figure 6
Figure 6
In Vivo Activity of Cytokine-Reactive mAbs (A) mAb administered i.p. at day 0, and human IL17F administered i.d. on days 1, 3, 6, and 8. Ear thickness measured on all days (prior to cytokine injection) except day 5. (B) As in (A), but with human IL32γ administered i.d. (C) anti-IL22-specific mAb injected i.p. into 9-week mice prior to and during IMQ treatment. Efficacy measured by Psoriasis Area and Severity Index (PASI). Significance calculated by two-way ANOVA, with p ≤ 0.05, ∗∗p ≤ 0.01, ∗∗∗p ≤ 0.001, and ∗∗∗∗p ≤ 0.0001. Error bars denote SEM.
Figure 7
Figure 7
Clinical Correlation of T1D and IFN Neutralization (A and B) Seroreactivity to GAD67 and GAD65 measured by ProtoArray and LIPS in APS1/APECED patients with (red) or without (blue) T1D. (C) IFNα-neutralizing titers in patients with T1D (n = 8) and anti-GAD65 seropositive patients without T1D (n = 13). y axis shows inhibitory concentration IC50 reflecting serum dilutions at which IFN activity was reduced 50%. (D) Heatmap of seroreactivity toward GAD67, GAD65, and IFNα analyzed by ProtoArray and LIPS combined with neutralization capacity in patients with and without T1D. Significance calculated by Mann Whitney using GraphPad Prism v.6, with p < 0.05, ∗∗p < 0.01, ∗∗∗p < 0.001, ∗∗∗∗p < 0.0001. Error bars denote SEM. Significance values in (D) compare T1D+ and T1D groups for each parameter.
Figure S1
Figure S1
Related to Figure 1 (A) Z scores for all samples against all protein features were calculated as described in experimental procedures and the mean hits for each group were calculated for either Z score ≥ 3, Z score ≥ 4, and Z score ≥ 5. There is a significant difference between patients and healthy relative and controls but no significant difference between healthy relatives and controls. (B) Mean hits score for Z ≥ 3 were calculated for each geographical location. There is no significant difference between the patient cohorts but all cohorts are significantly different from the controls with the exception of the Slovenian and significantly different from the healthy relatives with exception of the Norwegian and Slovenian. (C) Mean hits score for Z ≥ 3 were calculated for age-grouped patients with no significant difference between the groups. Data are represented as mean ± SEM and statistical significance levels were calculated by Kruskal-Wallis testing.
Figure S2
Figure S2
Related to Figure 3 (A) Corresponding closest germlines and heavy chain diversity regions of APS1 patient-derived mAb 50E11 targeting IFNαs. (B) IgG concentration of APECED/APS1 derived mAbs and its closest germline antibodies as measured by ELISA. (C) Mapping of the epitope of the patient-derived anti-IL20 antibody 20A10 by primary peptide array. The antibody specifically binds to the peptide comprising amino acids P101 to T118. Signals at the 18-mer peptides starting with R93 and D73 are caused by binding of the detection antibody as shown in the control. (D) Alanine-scan of the epitope comprising residues P101 to L117. Alanine substitutions at positions D102, H103, Y104, T105, L106, R107, K108, S111, N114, S115, and F116 lead to a breakdown of mAb binding. (E and F) Corresponding closest germlines and heavy chain diversity regions of APS1 patient-derived mAbs. (E) anti-IL17F mAbs. (F) anti-IL22 mAbs. Identical amino acids are highlighted in blue, mutated but similar amino acids in yellow and CDRs are underlined in red.
Figure S3
Figure S3
Related to Figure 3 (A) Tfh cells were gated as CD3+, CD8, TCR Vδ1, TCR Vδ2, CXCR5+, ICOS+ cells. (B) PBMCs from 8 APS1/APECED patients (4 children and 4 adults) and 8 age-matched healthy individuals were tested. No statistically significant differences were revealed in circulating Tfh cell percentages, neither of their CCR7lo ICOShi subset nor in the mean fluorescence index (MFI) of ICOS or CCR7 among Tfh cells.
Figure S4
Figure S4
Related to Figure 4 (A) Neutralization of IFNα induced STAT1 signaling by APS/APECED patient-derived and other mAbs. (B) Neutralization of IL17F, IL22, IL32α, and IL20 by the antibodies indicated as described in Experimental Procedures. For IL20 neutralization, data are shown for cells expressing type I and type II IL20 receptors, respectively. Error bars denote standard error of the mean of multiple parallel measurements.
Figure S5
Figure S5
Related to Figure 5 (A) Intradermal injection of human IFNα creates a inflammatory response causing ear swelling. (B) The inflammatory response caused by i.d. injection of human IFNα caused a significant increase in mRNA levels of TNFα and IFNγ. Error bars denote standard error of the mean of multiple parallel measurements.
Figure S6
Figure S6
Related to Figure 6 (A) Experimental setup of Imiquimod-induced psoriasiform lesion in vivo model. Skin of 9-week-old C57BL/6Jax mice were shaved prior to antibody administration i.p. at day −1, day 1, and day 3. The mice were treated locally with IMQ from day 0 to day 4. (B) Treatment with IMQ and/or 30G1 does not cause any changes in body weight. (C–G) efficacy of 30G1 by Psoriasis Area and Severity Index (PASI). (H) There is no significant difference in spleen weight in mice treated with 30G1 versus IgG. (I) Lymph node cell viability and (J) total live lymph node cells are significantly different in mice treated with 30G1 versus IgG. Error bars denote standard error of the mean of multiple parallel measurements.
Figure S7
Figure S7
Related to Figure 7 (A) IFNω-neutralizing titers in APS1/APECED patients with T1D (n = 7) and anti-GAD65 seropositive APS1/APECED patients without T1D (n = 5). y axis represents the neutralizing capacity in inhibitory concentration IC50 showing the serum dilution in which the activity of the IFNω was reduced to its half. p < 0.05. Error bars denote standard error of denoted patient groups. (B) IFNα-neutralizing titers in longitudinal samples of APS1/APECED patients. Three patients from the T1D+ group (red) and two patients from the T1D group (blue) were tested in two different time points as indicated on x scale. The latest time point is identical to the one in Figure 7C.

Comment in

References

    1. Ambrosi A., Espinosa A., Wahren-Herlenius M. IL-17: a new actor in IFN-driven systemic autoimmune diseases. Eur. J. Immunol. 2012;42:2274–2284. - PubMed
    1. Bennett C.L., Christie J., Ramsdell F., Brunkow M.E., Ferguson P.J., Whitesell L., Kelly T.E., Saulsbury F.T., Chance P.F., Ochs H.D. The immune dysregulation, polyendocrinopathy, enteropathy, X-linked syndrome (IPEX) is caused by mutations of FOXP3. Nat. Genet. 2001;27:20–21. - PubMed
    1. Brink R. The imperfect control of self-reactive germinal center B cells. Curr. Opin. Immunol. 2014;28:97–101. - PubMed
    1. Carrero J.A., Calderon B., Towfic F., Artyomov M.N., Unanue E.R. Defining the transcriptional and cellular landscape of type 1 diabetes in the NOD mouse. PLoS ONE. 2013;8:e59701. - PMC - PubMed
    1. Cho M.J., Lo A.S., Mao X., Nagler A.R., Ellebrecht C.T., Mukherjee E.M., Hammers C.M., Choi E.J., Sharma P.M., Uduman M. Shared VH1-46 gene usage by pemphigus vulgaris autoantibodies indicates common humoral immune responses among patients. Nat. Commun. 2014;5:4167. - PMC - PubMed

Publication types

MeSH terms