. 2016 Jul 18:6:29375.
doi: 10.1038/srep29375.

Topographical functional connectivity patterns exist in the congenitally, prelingually deaf

Affiliations

Topographical functional connectivity patterns exist in the congenitally, prelingually deaf

Ella Striem-Amit et al. Sci Rep. .

Abstract

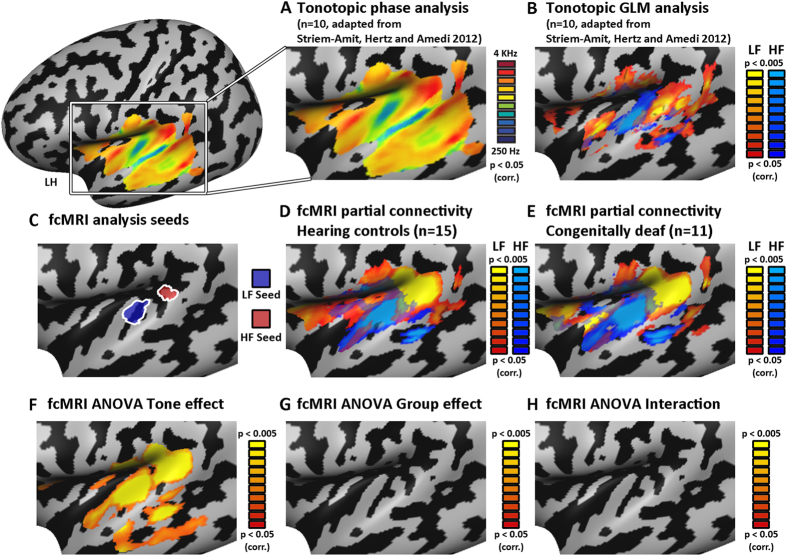
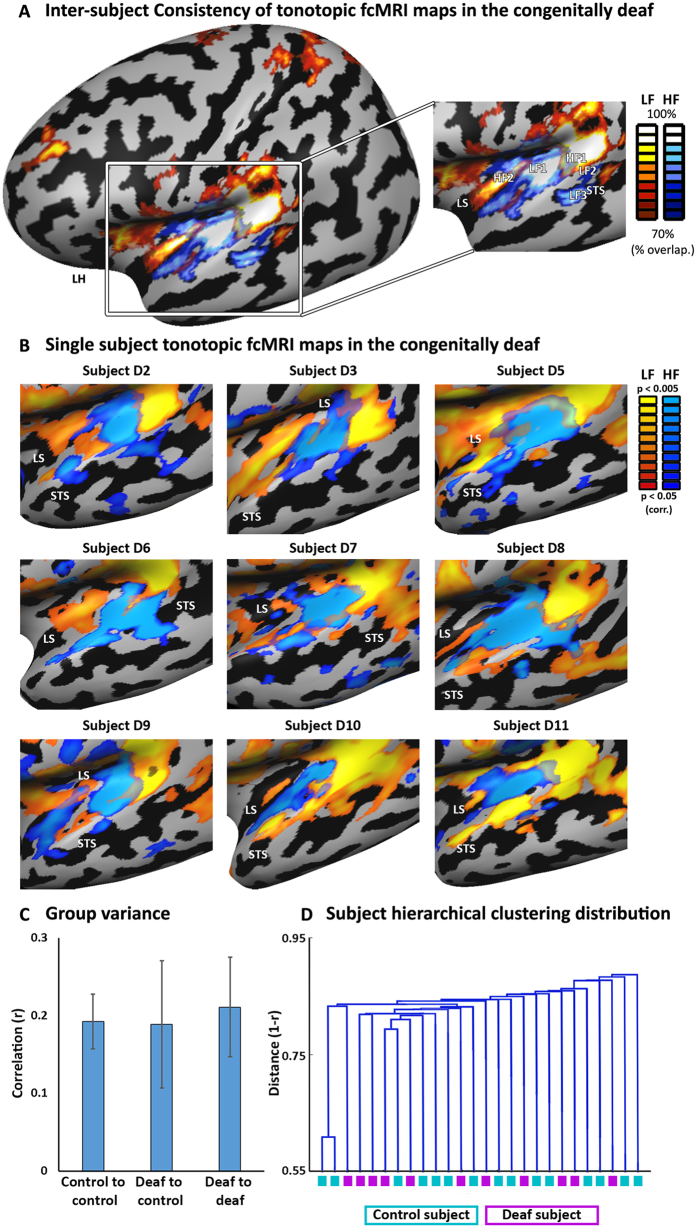
Congenital deafness causes large changes in the auditory cortex structure and function, such that without early childhood cochlear-implant, profoundly deaf children do not develop intact, high-level, auditory functions. But how is auditory cortex organization affected by congenital, prelingual, and long standing deafness? Does the large-scale topographical organization of the auditory cortex develop in people deaf from birth? And is it retained despite cross-modal plasticity? We identified, using fMRI, topographic tonotopy-based functional connectivity (FC) structure in humans in the core auditory cortex, its extending tonotopic gradients in the belt and even beyond that. These regions show similar FC structure in the congenitally deaf throughout the auditory cortex, including in the language areas. The topographic FC pattern can be identified reliably in the vast majority of the deaf, at the single subject level, despite the absence of hearing-aid use and poor oral language skills. These findings suggest that large-scale tonotopic-based FC does not require sensory experience to develop, and is retained despite life-long auditory deprivation and cross-modal plasticity. Furthermore, as the topographic FC is retained to varying degrees among the deaf subjects, it may serve to predict the potential for auditory rehabilitation using cochlear implants in individual subjects.


Figures

Figure 1
Figure 1. Topographic gradients in fcMRI of the deaf auditory cortex mimic tonotopic organization.
(A) Tonotopic gradients are presented on a left inflated cortical hemisphere, and cover a large extent of the temporal lobe when mapped directly using auditory stimuli analyzed with phase-encoding analyses in normally hearing subjects (adapted with permission from56). (B) Tonotopic peaks are identifiable using a direct binary contrast (HF > LF and vice-versa) in task-based tonotopy experiment. Both the core auditory gradient of HF-LF-HF along the superior temporal plane as well as the belt LF lateral band and STG-STS LF peaks are recognizable in this contrast (see peak marking in Figure S1A,B). (C) For fcMRI analysis, seeds corresponding to high-frequency (HF; marked red) and low-frequency (LF; marked blue) peaks in the core auditory cortex were chosen. These seeds were used in a partial-correlation mapping minimizing the common components between the two seeds, illuminating differential FC preferences for LF- and HF-preferring regions. (D) fcMRI analysis of the hearing control group (random-effect GLM analysis) reveals the topographical organization of functional-connectivity which mimics the tonotopic-organization within the auditory core, belt and beyond. Spatial-similarity-analysis quantitatively supports the significant similarity between the tonotopic-gradients and the FC topographic maps (see results). (E) fcMRI analysis (random-effect GLM analysis) reveals topographical organization in the auditory cortex of the congenitally deaf group, which greatly resembles the tonotopic patterns, extending from the core auditory cortex to speech/voice regions and beyond them. For marking of the comparable peaks between FC and tonotopy and across the groups see Figure S1. A spatial-similarity-analysis quantitatively supports the significant similarity between the tonotopic gradients and the FC topographic maps (see results). This suggests these topographical patterns develop regardless of auditory experience. (F–H) Analysis of variance (ANOVA) of the two groups shows that while most of the auditory cortex of both groups is selective for one seed over the other (F, seed/tone effect; see also MGN; Figure S2), it shows no significant group effect (G) or group X seed interaction (H), suggesting that the FC large-scale topographical patterns are identical across groups. For effects of group and interaction outside the auditory cortex see Figure S8, Tables S1,2.
Figure 2
Figure 2. Reproducibility of tonotopic fcMRI maps in the single-subject level.
(A) All single-subject maps for each of the two seeds (each at p < 0.05, corrected) are overlaid and the probability of each voxel to be activated across the subjects is calculated. The resulting map depicts the high inter-subject consistency of the topographical patterns in the deaf. The deaf FC consistently shows not only the core-belt pattern of HF-LF-HF along the temporal plane, but also the posterior-lateral LF band potentially corresponding to speech/voice sensitive regions, as well as the more lateral-inferior LF region in the STG-STS. LS – lateral sulcus, STS – superior temporal sulcus. (B) Topographical tonotopic-like fcMRI bands of the core and belt, including those of speech-sensitive regions, can be seen at the single subject level in many of the congenitally deaf individuals. Subjects D2, D3, D5 and D6 have never attempted to use hearing-aids (see Table 1 for all the deaf participant characteristics). (C) The correlation of the single-subject maps to the leave-one-out group average showed similar variability of subjects FC patterns within and between groups, suggesting again the absence of significant group differences. (D) A dendrogram showing the clustering of the subjects based on their FC pattern correlation distances, as computed by a data-driven independent hierarchical clustering analysis. The deaf and hearing controls are intermixed in the clustering, and no clear group distinction can be made.

Similar articles

Cited by

References

    1. Stevens G. et al.. Global And Regional Hearing Impairment Prevalence: An Analysis Of 42 Studies In 29 Countries. Eur J Public Health. 23, 146–52 (2011). - PubMed
    1. Kral A. Auditory Critical Periods: A Review From System’s Perspective. Neuroscience. 247, 117–33 (2013). - PubMed
    1. Niparko J. K. et al.. Spoken Language Development In Children Following Cochlear Implantation. Jama. 303, 1498–506 (2010). - PMC - PubMed
    1. Campbell R., Macsweeney M. & Woll B. Cochlear Implantation (Ci) For Prelingual Deafness: The Relevance Of Studies Of Brain Organization And The Role Of First Language Acquisition In Considering Outcome Success. Frontiers In Human Neuroscience. 8, 834 (2014). - PMC - PubMed
    1. Gordon K. A. et al.. Use It Or Lose It? Lessons Learned From The Developing Brains Of Children Who Are Deaf And Use Cochlear Implants To Hear. Brain Topogr. 24, 204–19 (2011). - PubMed

Publication types