. 2016 Aug 15;25(16):3524-3538.
doi: 10.1093/hmg/ddw195. Epub 2016 Jul 17.

Cancer-associated isocitrate dehydrogenase mutations induce mitochondrial DNA instability

Affiliations

Cancer-associated isocitrate dehydrogenase mutations induce mitochondrial DNA instability

Joanne M Kingsbury et al. Hum Mol Genet. .

Abstract

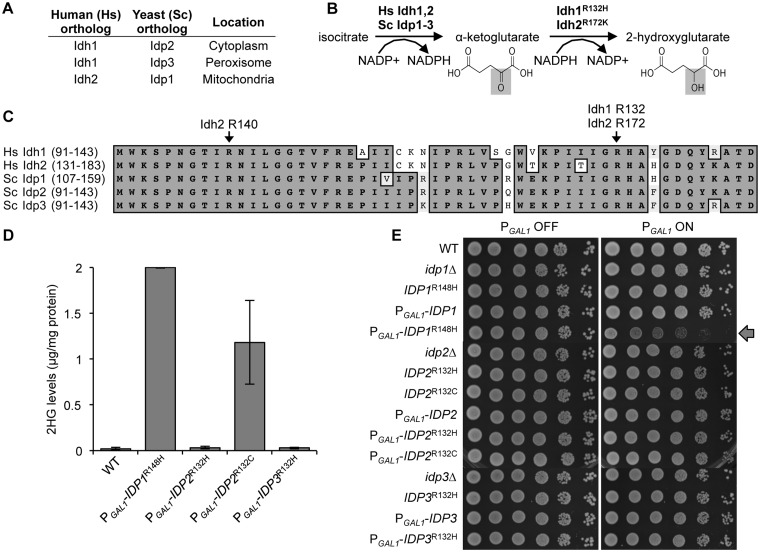
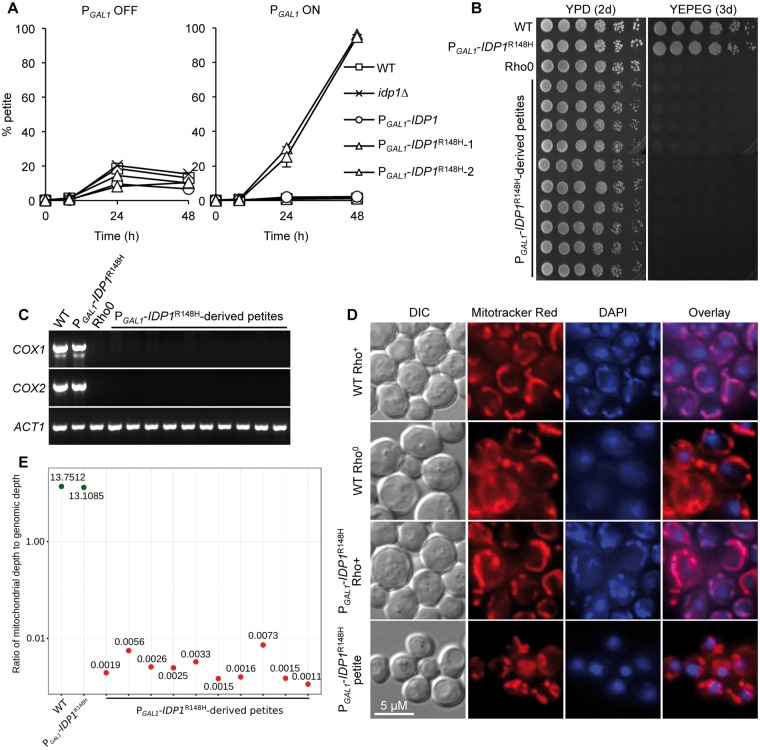
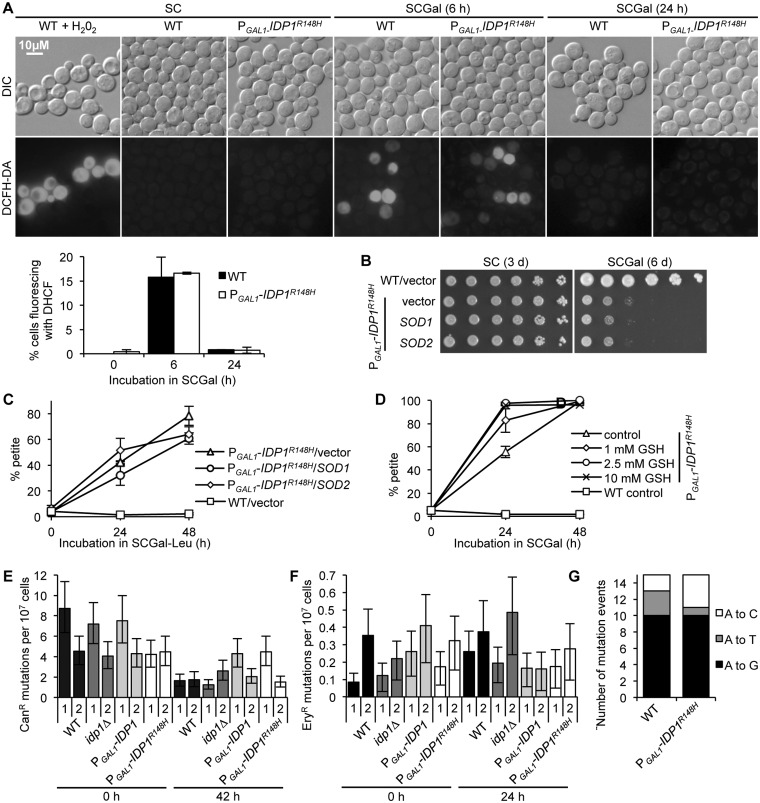
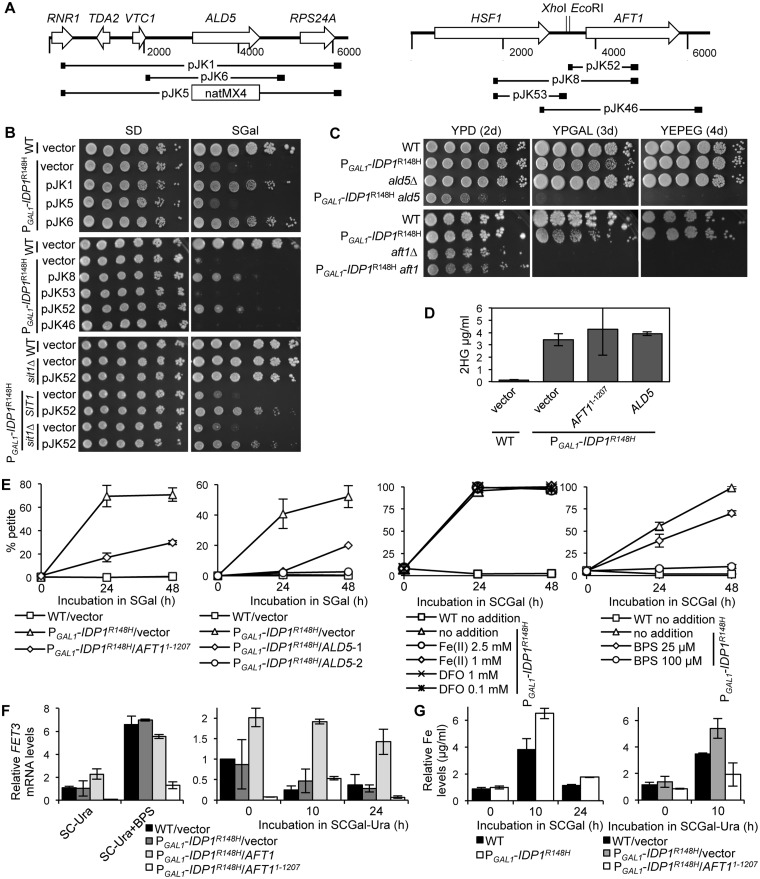
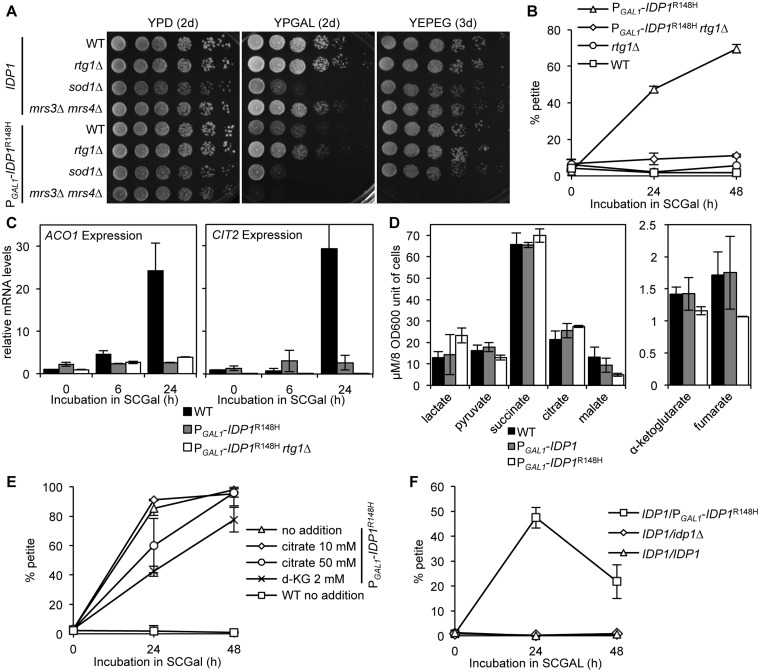
A major advance in understanding the progression and prognostic outcome of certain cancers, such as low-grade gliomas, acute myeloid leukaemia, and chondrosarcomas, has been the identification of early-occurring mutations in the NADP+-dependent isocitrate dehydrogenase genes IDH1 and IDH2 These mutations result in the production of the onco-metabolite D-2-hydroxyglutarate (2HG), thought to contribute to disease progression. To better understand the mechanisms of 2HG pathophysiology, we introduced the analogous glioma-associated mutations into the NADP+ isocitrate dehydrogenase genes (IDP1, IDP2, IDP3) in Saccharomyces cerevisiae Intriguingly, expression of the mitochondrial IDP1R148H mutant allele results in high levels of 2HG production as well as extensive mtDNA loss and respiration defects. We find no evidence for a reactive oxygen-mediated mechanism mediating this mtDNA loss. Instead, we show that 2HG production perturbs the iron sensing mechanisms as indicated by upregulation of the Aft1-controlled iron regulon and a concomitant increase in iron levels. Accordingly, iron chelation, or overexpression of a truncated AFT1 allele that dampens transcription of the iron regulon, suppresses the loss of respirative capacity. Additional suppressing factors include overexpression of the mitochondrial aldehyde dehydrogenase gene ALD5 or disruption of the retrograde response transcription factor RTG1 Furthermore, elevated α-ketoglutarate levels also suppress 2HG-mediated respiration loss; consistent with a mechanism by which 2HG contributes to mtDNA loss by acting as a toxic α-ketoglutarate analog. Our findings provide insight into the mechanisms that may contribute to 2HG oncogenicity in glioma and acute myeloid leukaemia progression, with the promise for innovative diagnostic and prognostic strategies and novel therapeutic modalities.


Figures

Figure 1.
Figure 1.
Introduction of tumour-associated mutations in yeast isocitrate dehydrogenase genes results in high-level 2HG production. (A) NADP+-dependent isocitrate dehydrogenases in humans and yeast. (B) Biochemical reactions catalyzed by WT and mutant NADP+-dependent isocitrate dehydrogenases. The chemical structures of 2HG and α-ketoglutarate are highly similar, differing only at the position indicated by shading. (C) Partial alignment of human (Hs) and yeast (Sc) NADP+-dependent isocitrate dehydrogenases showing a high level of sequence identity and conserved arginine residues (depicted by arrows), which are mutated in various tumours. (D) Relative levels of 2HG from clarified extracts of cells incubated in YPGal for 6 h. The mean and standard deviation of duplicate measurements are shown; an independent experiment yielded similar results. (E) Growth phenotypes conferred by overexpression of the IDP1R147H, IDP2R132H, IDP2R132C, and IDP3R132H alleles. Phenotypes were assayed following plating of 5 µl volumes of five-fold serially diluted cultures on SD + Ura (PGAL1OFF) and SCGal + Ura (PGAL1ON) media. Growth inhibition following induction of PGAL1-IDP1R147H is depicted by an arrow.
Figure 2.
Figure 2.
2HG production by yeast mitochondrial isocitrate dehydrogenases induces extensive mitochondrial DNA loss. (A) The proportion of non-respiring (petite) cells in the strain populations was determined by dilution and plating onto YPGly 0.1% dextrose following incubation in triplicate in YPD (PGAL1 OFF) or YPGal (PGAL1 ON) for the times indicated. (B) Following growth of PGAL1-IDP1R148H in YPGal, ten independently derived and presumptive petite isolates were plated onto YEPEG medium to confirm loss of respiration capability. Five µl volumes of 5-fold serial dilutions were plated on the indicated media and incubated for the time designated. (C) To determine the presence of mtDNA, total DNA was extracted from the ten petite mutants shown in (B), the grande WT and PGAL1-IDP1R148H parent, and a Rho0 strain and subjected to PCR using oligonucleotides specific for mitochondrially encoded COX1 and COX2 gene sequence, and the nuclear-encoded ACT1 gene as a loading control. (D) Mitochondrial DNA was visualized by staining with DAPI (which also stains nuclear DNA) and mitochondrial localization was determined by staining with Mitotracker Red CMXRos. Results are presented for one petite isolate shown in (B), which was representative of all ten isolates. (E) Ratio of reads aligning to the mitochondrial genome as compared to the nuclear genome. Red circles indicate petite isolates derived from PGAL1-IDP1R148H, while green circles indicate strains with intact mitochondrial genomes. Virtually no mitochondrial sequence was detected in the petite strains sequenced in this study.
Figure 3.
Figure 3.
Mitochondrial 2HG production does not elevate ROS levels or the frequency of mitochondrial or chromosomal point mutations. (A) ROS production at time 0 (SC) and following 6 and 24-h induction of 2HG production by incubation in YPGal medium (PGAL1-IDP1R148H-ON) was visualized by fluorescence microscopy of DCFH-DA-stained cells. Cells treated with H202 (25 mM) for 1 hour prior to dye addition served as a positive control for ROS production (Note, due to the brightness of the fluorescent signal, the H202–treated cell image was captured with a shorter exposure time of 100 ms compared with 2 s for the other samples). More than 100 cells were counted from three separate fields of view at each time point, and results from duplicate cultures were averaged to determine the percentage of fluorescent cells. (B, C) The effect of SOD1 and SOD2 high-copy expression on petite formation was ascertained by (B) plating five-fold serial dilutions of the WT and PGAL1-IDP1R148H strains transformed with the vector or high copy plasmids containing SOD1 or SOD2 onto SC or SCGal, or (C) by plating cultures incubated in SCGal-Leu onto YPGly 0.1% dextrose as described in Figure 2A. (D) The effect of reduced glutathione (GSH) on PGAL1-IDP1R148H-dependent petite formation was determined as described in Figure 2A following incubation in media supplemented with GSH at the indicated concentrations. (E) The rate of mutation to canavanine resistance as a measure of nuclear mutation rate was compared following growth in YPGal medium for 0 and 42 h. (F) The mutation rate to erythromycin resistance as an indicator for mitochondrial point mutation rate was determined following incubation in YPGal medium for 0 and 24 h. (E, F) Mutation rates from two independent experiments are shown. (G) The mutation spectrum was determined by sequencing the 1900-2000 region of the 21S rRNA gene of 15 independently isolated WT and PGAL1-IDP1R148H erythromycin resistant isolates arising following incubation in YPGal for 24 h.
Figure 4.
Figure 4.
Overexpression of ALD5 and AFT11-1207 suppresses the 2HG-mediated petite formation. (A) Genetic intervals of high-copy number plasmids that suppressed the PGAL1-IDP1R148H-mediated petite formation. (B) Five-fold serial dilutions of the WT, PGAL1-IDP1R148H, or PGAL1-IDP1R148H sit1Δ strains transformed with the vector or plasmids described in Figure 4A were plated onto SD (control) or SGal media to induce PGAL1-IDP1R148H expression and thereby 2HG production. (C) Five-fold serial dilutions of strains were plated onto the indicated media. (D) Relative levels of 2HG extracted from cultures grown in duplicate following incubation for 6 h in SCGal-Ura. (E) Suppression of petite formation was determined in triplicate by incubation of strains in SGal or SCGal media to induce 2HG production. Where indicated, media was supplemented with either no additions, individual additions of iron (II) sulfate heptahydrate (FeII), deferoxamine mesylate (DFO), or bathophenanthroline disulfonate (BPS). At the times indicated, cells were plated onto YPGly 0.1% dextrose media to determine the proportion of petite and grande colonies. (F) Quantitative RT-PCR measurements of FET3 transcript levels relative to ACT1. RNA was extracted from strains grown in duplicate for 0 (SC-Ura), 10 or 24 h in SCGal-Ura, or 6 h following incubation in SC-Ura + BPS (100 µM). (G) Analysis of cellular iron content. Cells were grown in galactose medium for the times indicated, washed, and nitric acid cell extracts were analyzed for iron content by ICP-MS. Data shown is the average of three independent replicates. (D-G) Strains contained plasmids pRS426 (vector), pJK6 (ALD5), pJK52 (AFT11-1207), or pJK46 (AFT1).
Figure 5.
Figure 5.
Mutation of RTG1 or α-ketoglutarate addition suppress 2HG-mediated petite formation. (A) The WT IDP1 or PGAL1-IDP1R148H strains and their isogenic derivatives mutated for the genes indicated were cultured overnight in YPD, washed twice, serially diluted five-fold, plated onto YPD, YPGal, and YEPEG, and incubated for various times. (B, E, F) Triplicate cultures of strains were incubated in SCGal for the indicated times and plated onto YPGly 0.1% dextrose media to differentiate petite from grande colonies. For (E), strains cultured overnight in YEPEG were washed and inoculated in triplicate into SCGal, as indicated, with no additions, 10 or 50 mM sodium citrate, or 2 mM d-KG. (C) Quantitative RT-PCR measurements of ACO1 and CIT2 transcript levels relative to ACT1. RNA was extracted from strains grown in duplicate for 0, 6, and 24 h in SCGal-Ura. (D) TCA cycle intermediate levels extracted from strains incubated for 6 h in SCGal medium.

Similar articles

Cited by

References

    1. Parsons D.W., Jones S., Zhang X., Lin J.C., Leary R.J., Angenendt P., Mankoo P., Carter H., Siu I.M., Gallia G.L., et al. (2008) An integrated genomic analysis of human glioblastoma multiforme. Science, 321, 1807–1812. - PMC - PubMed
    1. Yan H., Parsons D.W., Jin G., McLendon R., Rasheed B.A., Yuan W., Kos I., Batinic-Haberle I., Jones S., Riggins G.J., et al. (2009) IDH1 and IDH2 mutations in gliomas. N. Engl. J. Med., 360, 765–773. - PMC - PubMed
    1. Bleeker F.E., Lamba S., Leenstra S., Troost D., Hulsebos T., Vandertop W.P., Frattini M., Molinari F., Knowles M., Cerrato A., et al. (2009) IDH1 mutations at residue p.R132 (IDH1R132) occur frequently in high-grade gliomas but not in other solid tumors. Hum. Mutat., 30, 7–11. - PubMed
    1. Hartmann C., Meyer J., Balss J., Capper D., Mueller W., Christians A., Felsberg J., Wolter M., Mawrin C., Wick W., et al. (2009) Type and frequency of IDH1 and IDH2 mutations are related to astrocytic and oligodendroglial differentiation and age: a study of 1,010 diffuse gliomas. Acta Neuropathol., 118, 469–474. - PubMed
    1. Mardis E.R., Ding L., Dooling D.J., Larson D.E., McLellan M.D., Chen K., Koboldt D.C., Fulton R.S., Delehaunty K.D., McGrath S.D., et al. (2009) Recurring mutations found by sequencing an acute myeloid leukemia genome. N. Engl. J. Med., 361, 1058–1066. - PMC - PubMed