

Efficacy and safety of triamcinolone acetonide alone and in combination with 5-fluorouracil for treating hypertrophic scars and keloids: a systematic review and meta-analysis
- PMID: 27427423
- PMCID: PMC7949502
- DOI: 10.1111/iwj.12629
Efficacy and safety of triamcinolone acetonide alone and in combination with 5-fluorouracil for treating hypertrophic scars and keloids: a systematic review and meta-analysis
Abstract
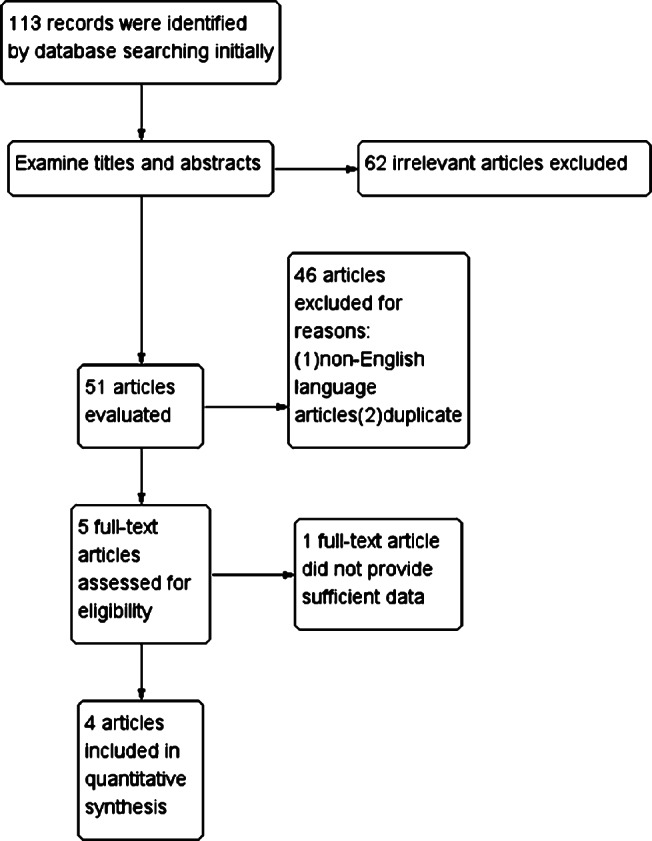
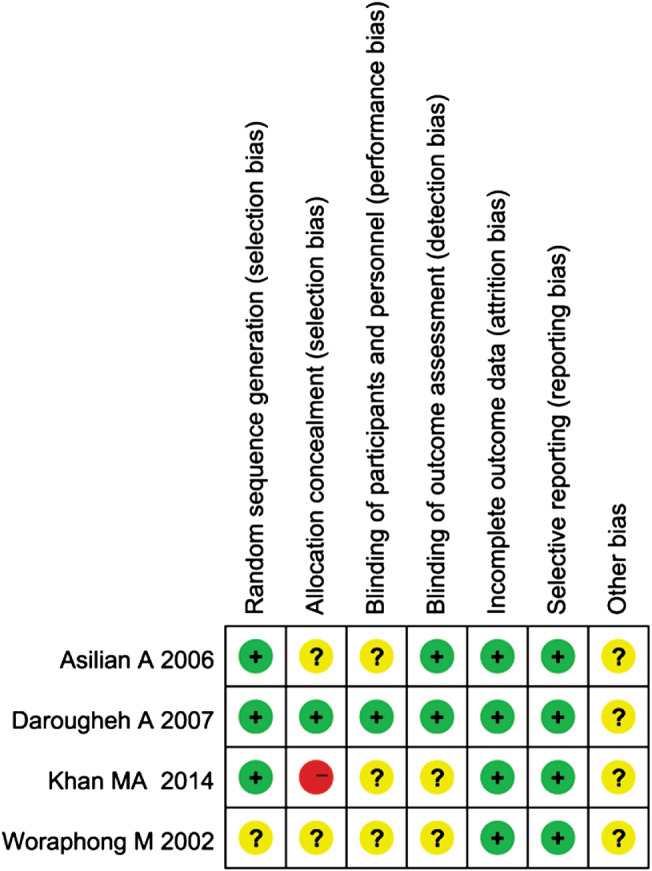
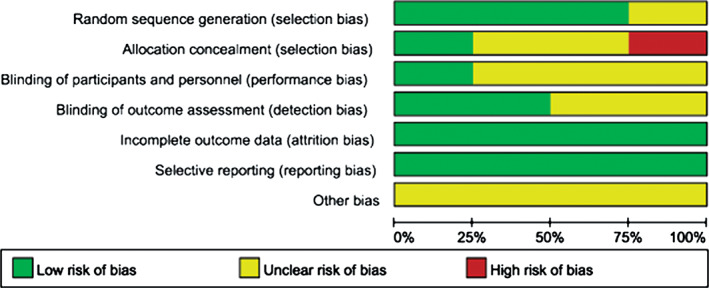
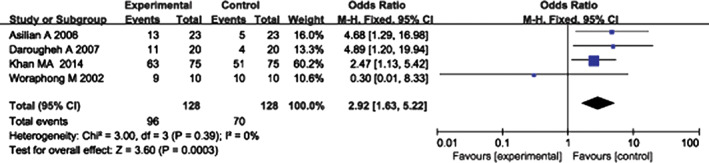
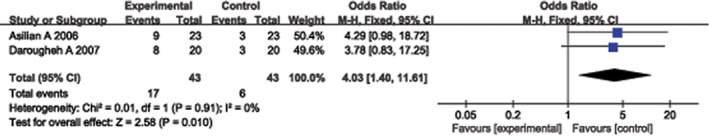
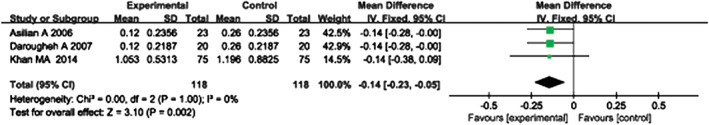
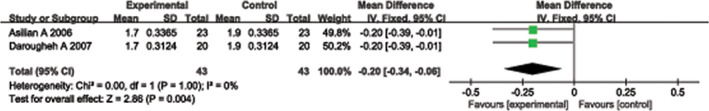
Pathological scars, such as keloids and hypertrophic scars, readily cause physical and psychological problems. Combination 5-fluorouracil (5-FU) with triamcinolone acetonide (TAC) is presumed to enhance the treatment of pathological scars, although supportive evidence is lacking. We aimed to compare the efficacy and safety of TAC alone and in combination with 5-FU for the treatment of hypertrophic scars and keloids. Five databases (PubMed, Medline, Cochrane databases, Embase and CNKI) were searched with the limitations of human subjects and English-language text. Mean differences (MDs), odds ratios (ORs) and 95% confidence intervals (CIs) were calculated. The Cochrane Collaboration's Risk of Bias Tool was used to assess the risk of bias. The control group received intralesional TAC alone, and the experimental group received TAC combined with 5-FU injection. A pooled analysis of the effectiveness based on patient self-assessment after treatment showed that the experimental group achieved better results than the control group (OR = 2·92, 95% CI = 1·63-5·22, P = 0·0003). Similarly, a pooled analysis of the effectiveness based on observer assessment following treatment produced the same conclusion (OR = 4·03, 95% CI = 1·40-11·61, P = 0·010). A meta-analysis of scar height after treatment showed that the experimental group performed better than the control group (MD = -0·14, 95% CI = -0·23-0·05, P = 0·002). The erythema score of the experimental group after treatment was superior (MD = -0·20, 95% CI = -0·34-0·06, P = 0·004). The heterogeneity test showed no heterogeneity among the studies (P > 0·1, I2 = 0%). TAC combined with 5-FU is more suitable for the treatment and prevention of hypertrophic scars and keloids, with greater improvement in scar height and patient satisfaction as well as fewer side effects.
Keywords: 5-Fluorouracil; Hypertrophic scars; Keloids; Meta-analysis; Triamcinolone acetonide.
© 2016 Medicalhelplines.com Inc and John Wiley & Sons Ltd.
Figures
Similar articles
-
The safety and efficacy of intralesional triamcinolone acetonide for keloids and hypertrophic scars: A systematic review and meta-analysis.Burns. 2021 Aug;47(5):987-998. doi: 10.1016/j.burns.2021.02.013. Epub 2021 Feb 24. Burns. 2021. PMID: 33814214
-
Laser therapy for treating hypertrophic and keloid scars.Cochrane Database Syst Rev. 2022 Sep 26;9(9):CD011642. doi: 10.1002/14651858.CD011642.pub2. Cochrane Database Syst Rev. 2022. PMID: 36161591 Free PMC article.
-
Efficacy and Safety of Verapamil Versus Triamcinolone Acetonide in Treating Keloids and Hypertrophic Scars: A Systematic Review and Meta-Analysis.Aesthetic Plast Surg. 2023 Feb;47(1):473-482. doi: 10.1007/s00266-022-03229-3. Epub 2022 Dec 23. Aesthetic Plast Surg. 2023. PMID: 36562775
-
Efficacy of triamcinolone acetonide combined with botulinum toxin A in the treatment of hypertrophic scars and keloids: A meta-analysis.Burns. 2024 Dec;50(9):107250. doi: 10.1016/j.burns.2024.08.016. Epub 2024 Aug 24. Burns. 2024. PMID: 39447283
-
Comparative Efficacy and Safety of Common Therapies in Keloids and Hypertrophic Scars: A Systematic Review and Meta-analysis.Aesthetic Plast Surg. 2020 Feb;44(1):207-218. doi: 10.1007/s00266-019-01518-y. Epub 2019 Oct 21. Aesthetic Plast Surg. 2020. PMID: 31637502
Cited by
-
Network Meta-Analysis of Different Clinical Commonly Used Drugs for the Treatment of Hypertrophic Scar and Keloid.Front Med (Lausanne). 2021 Sep 9;8:691628. doi: 10.3389/fmed.2021.691628. eCollection 2021. Front Med (Lausanne). 2021. PMID: 34568361 Free PMC article.
-
Deciphering the single-cell transcriptome network in keloids with intra-lesional injection of triamcinolone acetonide combined with 5-fluorouracil.Front Immunol. 2023 May 19;14:1106289. doi: 10.3389/fimmu.2023.1106289. eCollection 2023. Front Immunol. 2023. PMID: 37275903 Free PMC article.
-
Keloids: Current and emerging therapies.Scars Burn Heal. 2020 Aug 10;6:2059513120940499. doi: 10.1177/2059513120940499. eCollection 2020 Jan-Dec. Scars Burn Heal. 2020. PMID: 32844039 Free PMC article. Review.
-
Comprehensive Insights into Keloid Pathogenesis and Advanced Therapeutic Strategies.Int J Mol Sci. 2024 Aug 12;25(16):8776. doi: 10.3390/ijms25168776. Int J Mol Sci. 2024. PMID: 39201463 Free PMC article. Review.
-
Scar Management in Pediatric Patients.Medicina (Kaunas). 2025 Mar 21;61(4):553. doi: 10.3390/medicina61040553. Medicina (Kaunas). 2025. PMID: 40282843 Free PMC article. Review.
References
-
- Diegelmann RF, Evans MC. Wound healing: an overview of acute, fibrotic and delayed healing. Front Biosci 2004;9:283–9. - PubMed
-
- Slemp AE, Kirschner RE. Keloids and scars: a review of keloids and scars, their pathogenesis, risk factors, and management. Curr Opin Pediatr 2006;18:396–402. - PubMed
-
- Epstein FH, Singer AJ, Clark RAF. Cutaneous wound healing. N Engl J Med 1999;341:738–46. - PubMed
Publication types
MeSH terms
Substances
LinkOut - more resources
Full Text Sources
Other Literature Sources
Medical
Research Materials
Miscellaneous
