

Screening Mammography Use Among Older Women Before and After the 2009 U.S. Preventive Services Task Force Recommendations
- PMID: 27427790
- PMCID: PMC5069708
- DOI: 10.1089/jwh.2015.5701
Screening Mammography Use Among Older Women Before and After the 2009 U.S. Preventive Services Task Force Recommendations
Abstract
Background: It is uncertain how changes in the U.S. Preventive Services Task Force breast cancer screening recommendations (from annual to biennial mammography screening in women aged 50-74 and grading the evidence as insufficient for screening in women aged 75 and older) have affected mammography use among Medicare beneficiaries.
Materials and methods: Cohort study of 12 million Medicare fee-for-service women aged 65-74 and 75 and older to measure changes in 3-year screening use, 2007-2009 (before) and 2010-2012 (after), defined by two measures-proportion screened and frequency of screening by age, race/ethnicity, and hospital referral region.
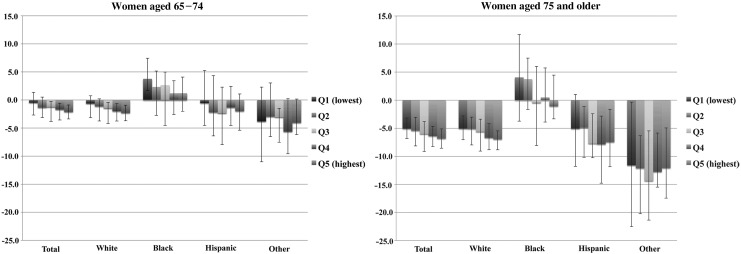
Results: Fewer women were screened, but with similar frequency after 2009 for both age groups (after vs. before: age 65-74: 60.1% vs. 60.8% screened, 2.1 vs. 2.1 mammograms per screened woman; age 75 and older: 31.7% vs. 33.6% screened, 1.9 vs. 1.9 mammograms per screened woman; all p < 0.05). Black women were the only subgroup with an increase in screening use, and for both age groups (after vs. before: age 65-74: 55.4% vs. 54.0% screened and 2.0 vs. 1.9 mammograms per screened woman; age 75 and older: 28.5% vs. 27.9% screened and 1.8 vs. 1.8 mammograms per screened woman; all p < 0.05). Regional change patterns in screening were more similar between age groups (Pearson correlation r = 0.781 for proportion screened; r = 0.840 for frequency of screening) than between black versus nonblack women (Pearson correlation r = 0.221 for proportion screened; r = 0.212 for frequency of screening).
Conclusions: Changes in screening mammography use for Medicare women are not fully aligned with the 2009 recommendations.
Keywords: USPSTF recommendations; change in screening; mammography; older women; race/ethnicity difference; regional variation.
Conflict of interest statement
Author Disclosure Statement The authors declare no competing financial interests.
Figures
References
-
- U. S. Preventive Services Task Force. Screening for breast cancer: U.S. Preventive Services Task Force recommendation statement. Ann Intern Med 2009;151:716–726, W-236 - PubMed
-
- Biller-Andorno N, Juni P. Abolishing mammography screening programs? A view from the Swiss medical board. N Engl J Med 2014;370:1965–1967 - PubMed
-
- Welch HG, Passow HJ. Quantifying the benefits and harms of screening mammography. JAMA Inter Med 2014;174:448–454 - PubMed
MeSH terms
Grants and funding
LinkOut - more resources
Full Text Sources
Other Literature Sources
Medical
