. 2016 Oct 2;12(10):1902-1916.
doi: 10.1080/15548627.2016.1208889. Epub 2016 Jul 18.

Transcription factor NFE2L2/NRF2 is a regulator of macroautophagy genes

Affiliations

Transcription factor NFE2L2/NRF2 is a regulator of macroautophagy genes

Marta Pajares et al. Autophagy. .

Abstract

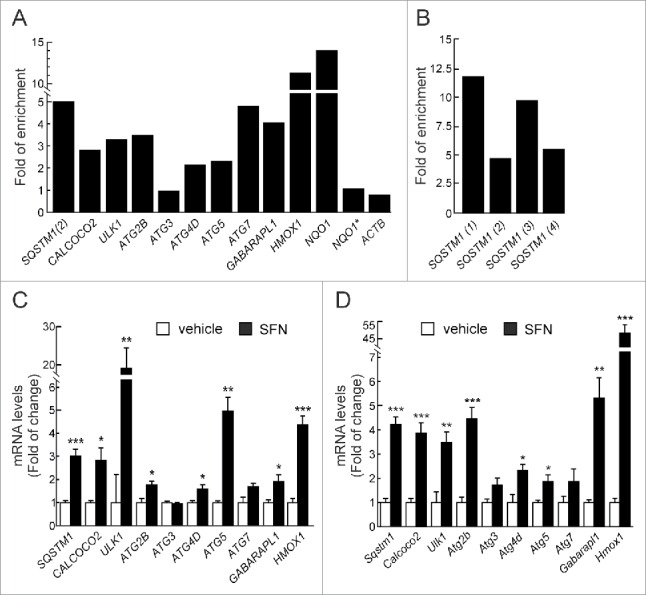
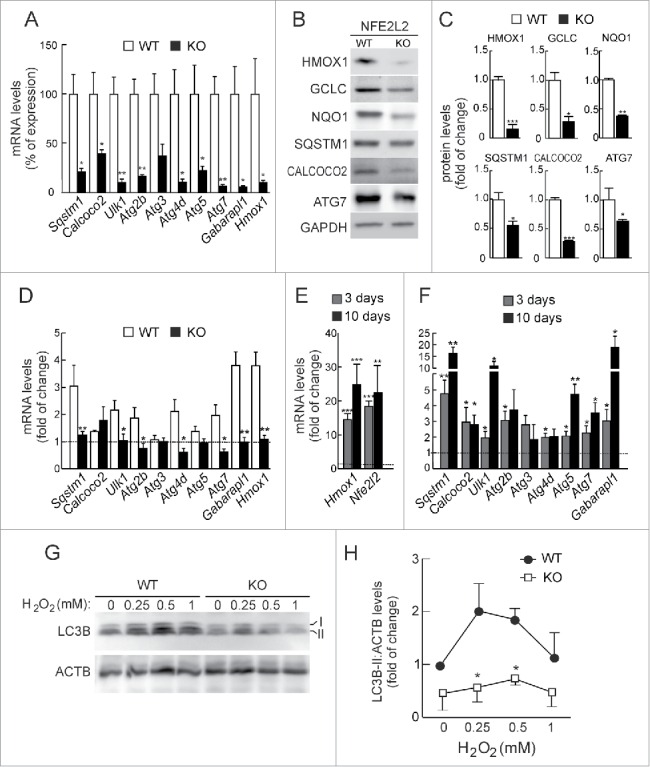
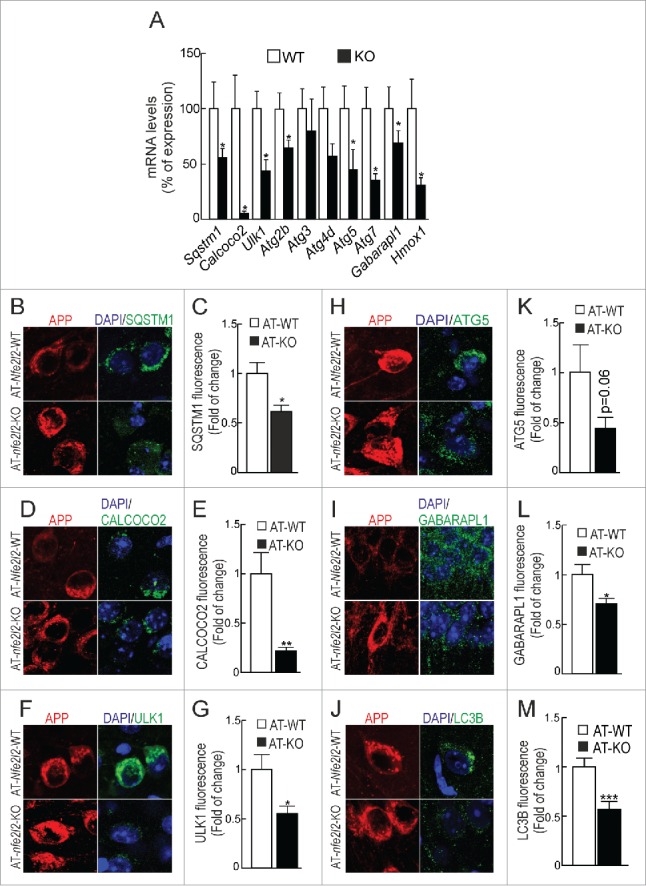
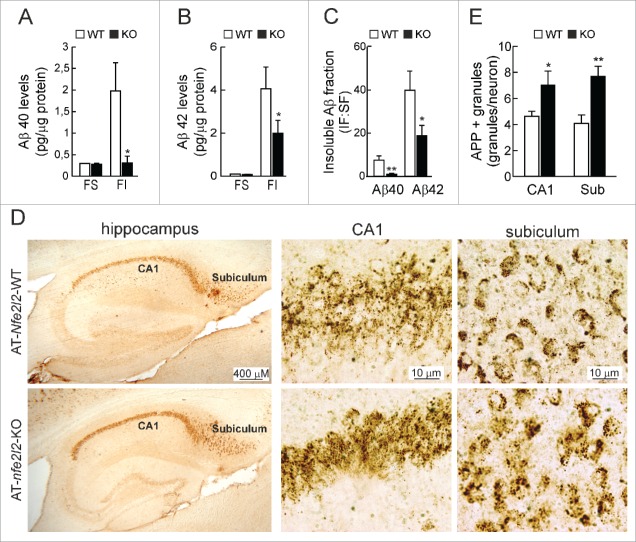
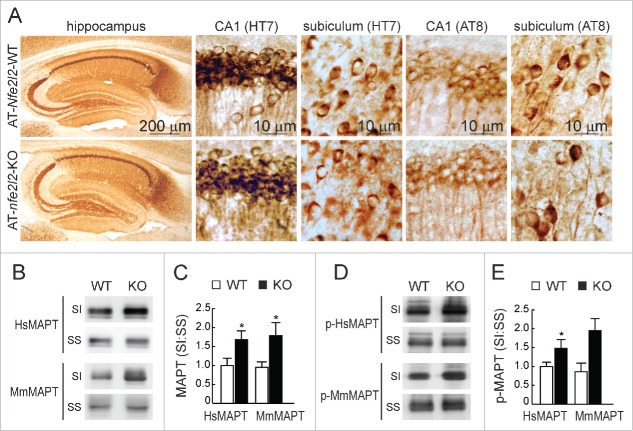
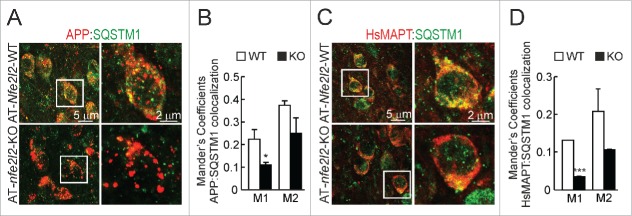
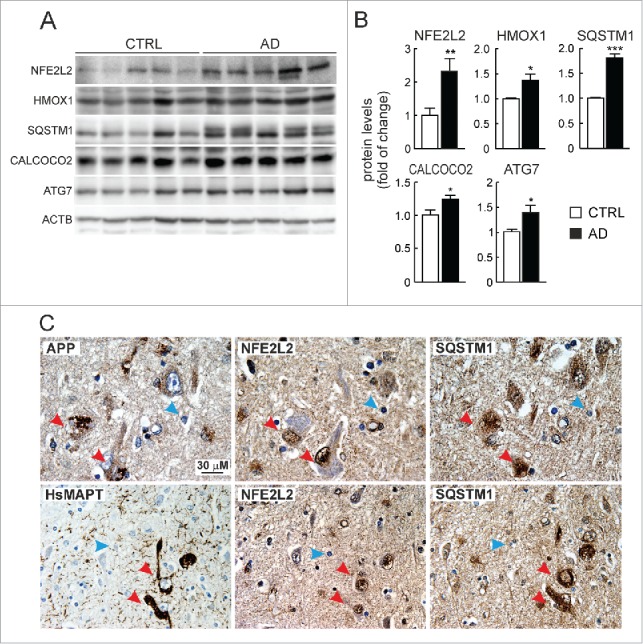
Autophagy is a highly coordinated process that is controlled at several levels including transcriptional regulation. Here, we identify the transcription factor NFE2L2/NRF2 (nuclear factor, erythroid 2 like 2) as a regulator of autophagy gene expression and its relevance in a mouse model of Alzheimer disease (AD) that reproduces impaired APP (amyloid β precursor protein) and human (Hs)MAPT/TAU processing, clearance and aggregation. We screened the chromatin immunoprecipitation database ENCODE for 2 proteins, MAFK and BACH1, that bind the NFE2L2-regulated enhancer antioxidant response element (ARE). Using a script generated from the JASPAR's consensus ARE sequence, we identified 27 putative AREs in 16 autophagy-related genes. Twelve of these sequences were validated as NFE2L2 regulated AREs in 9 autophagy genes by additional ChIP assays and quantitative RT-PCR on human and mouse cells after NFE2L2 activation with sulforaphane. Mouse embryo fibroblasts of nfe2l2-knockout mice exhibited reduced expression of autophagy genes, which was rescued by an NFE2L2 expressing lentivirus, and impaired autophagy flux when exposed to hydrogen peroxide. NFE2L2-deficient mice co-expressing HsAPPV717I and HsMAPTP301L, exhibited more intracellular aggregates of these proteins and reduced neuronal levels of SQSTM1/p62, CALCOCO2/NDP52, ULK1, ATG5 and GABARAPL1. Also, colocalization of HsAPPV717I and HsMAPTP301L with the NFE2L2-regulated autophagy marker SQSTM1/p62 was reduced in the absence of NFE2L2. In AD patients, neurons expressing high levels of APP or MAPT also expressed SQSTM1/p62 and nuclear NFE2L2, suggesting their attempt to degrade intraneuronal aggregates through autophagy. This study shows that NFE2L2 modulates autophagy gene expression and suggests a new strategy to combat proteinopathies.

Keywords: Alzheimer disease; Tau; amyloid precursor protein; neurodegenerative diseases; neuroprotection; oxidative stress; proteostasis.


Figures

Figure 1.
Figure 1.
NFE2L2 modulates autophagy gene expression. (A) HEK293T cells were transfected with an expression vector for NFE2L2ΔETGE-V5. ChIP analysis was performed with anti-IgG or anti-V5 antibodies and the potential AREs with the highest score were analyzed by qRT-PCR. (B) The same ChIP analysis of putative AREs in the promoter of SQSTM1. The figures show representative data normalized as the fold of enrichment with the anti-V5 antibody vs. the IgG antibody. In (A), ACTB and an upstream region of NQO1 that does not contain any ARE (NQO1*) were analyzed as negative controls. Previously described AREs in HMOX1, NQO1, SQSTM1 and CALCOCO2 were analyzed as positive controls. These experiments were repeated 3 times with similar results. In (B), numbers in brackets indicate the AREs from Table 1 specifically amplified. (C and D) HEK293T and HT22 cells were submitted to sulforaphane (SFN, 15 μM) for 12 h. mRNA levels of the indicated genes were determined by qRT-PCR and normalized by Actb levels. Data are mean ± SEM (n = 3). Statistical analysis was performed with the Student t test. *, p < 0.05; **, p < 0.01; and ***, p < 0.001 vs. untreated conditions.
Figure 2.
Figure 2.
NFE2L2 deficiency results in decreased autophagy gene expression. (A) Expression levels of the indicated genes from Nfe2l2-WT and nfe2l2-KO mouse embryonic fibroblasts (MEFs) were determined by qRT-PCR and normalized by Actb levels. Data are mean ± SEM (n = 3). Statistical analysis was performed with the Student t test. *, p < 0.05; **, p < 0.01; and ***, p < 0.001 vs. Nfe2l2-WT MEFs. (B) Representative immunoblots for the indicated proteins of Nfe2l2-WT and nfe2l2-KO MEFs. (C) Densitometric quantification of representative blots from (B) relative to GAPDH levels. Data are mean ± SEM (n = 3). Statistical analysis was performed using the Student t test. *, p < 0.05; **, p < 0.01; and ***, p < 0.001 vs. Nfe2l2-WT MEFs. (D) Nfe2l2-WT and nfe2l2-KO MEFs were submitted to SFN (15 µM, 6 h). mRNA levels of the indicated genes were determined by qRT-PCR and normalized to Actb levels. (E) nfe2l2-KO MEFs were transduced with NFE2L2ΔETGE-V5 or GFP-expressing lentivirus and mRNA levels of the indicated genes were analyzed by qRT-PCR following 3 and 10 after transduction. For (D) and (E), bars represent the fold of change normalized to the untreated condition (D), or GFP-lentivirus infection (E) depicted with the dashed lines. Data are mean ± SEM (n = 3). Statistical analysis was performed with the Student t test. *, p < 0.05; and **, p < 0.01 vs. control conditions. (F) Nfe2l2-WT and nfe2l2-KO cells were treated with the indicated concentrations of H2O2 during 6 h. Representative immunoblots for the indicated proteins of Nfe2l2-WT and nfe2l2-KO MEFs. (G) Densitometric quantification of representative blots from (F) relative to ACTB/β-actin levels. Data are mean ± SEM (n = 3). Statistical analysis was performed using Student t test. *, p < 0.05 vs. Nfe2l2-WT.
Figure 3.
Figure 3.
NFE2L2 deficiency impairs autophagy in neurons. (A) Expression levels of the indicated genes from Nfe2l2-WT and nfe2l2-KO primary hippocampal/cortical neurons were determined by qRT-PCR and normalized to Actb levels. Data are mean ± SEM (n = 3). Statistical analysis was performed with the Student t test. *, p <0.05 vs. Nfe2l2-WT neurons. (B-G) Confocal analysis of double immunofluorescence with anti-APP/Aβ (4G8, red) and anti-SQSTM1, CALCOCO2, ULK1, ATG5, GABARAPL1 or LC3B (green) antibodies in brain of AT-Nfe2l2-WT and AT-nfe2l2-KO. Fluorescence intensity was analyzed in the cytosol of 100 randomly chosen APP-positive neurons of each genotype. Quantification was derived from 3 independent experiments with 2 fields per experiment. Fluorescence intensity was quantified in 1.5-µm-thick stacks using ImageJ software. Data are mean ± SEM. Statistical analysis was performed with a Student t test. *, p < 0.05; **, p < 0.01; and ***, p < 0.001 vs. AT-Nfe2l2-WT mice.
Figure 4.
Figure 4.
NFE2L2 deficiency leads to intracellular APP/Aβ accumulation. (A-B) Determination of Aβ levels by ELISA in hippocampal brain homogenates of 12–14 mo-old AT-Nfe2l2-WT and AT-nfe2l2-KO mice. Aβ40 and Aβ42 levels were measured in the soluble (FS) and insoluble (FI) fractions (formic acid extracted). Soluble and insoluble Aβ40 (A) and Aβ42 (B) levels were normalized by total protein amount. (C) Ratio IF:SF of Aβ40 and Aβ42 peptides. Data are mean ± SEM (n = 10). Statistical analysis was performed with a Student t test. *, p < 0.05; and **, p < 0.01 comparing AT-Nfe2l2-WT and AT-nfe2l2-KO mice. (D), Immunohistological analysis of APP/Aβ expression (4G8 antibody) in hippocampus of 13-mo-old AT-Nfe2l2-WT and AT-nfe2l2-KO mice. (E) Estimation of the number of APP/Aβ-positive granules in CA1 and subiculum from 12–14-mo-old AT-Nfe2l2-WT and AT-nfe2l2-KO mice. Data are mean ± SEM (n = 8). Statistical analysis was performed with the Student t test. *, p<0.05; and **, p < 0.01 comparing AT-Nfe2l2-WT vs. AT-nfe2l2-KO groups.
Figure 5.
Figure 5.
NFE2L2 deficiency leads to accumulation of aggregated HsMAPT. (A) Immunohistochemical analysis of HsMAPT expression in hippocampus of 13-mo-old AT-Nfe2l2-WT and AT-nfe2l2-KO mice stained with anti HT7 or AT8 antibodies that recognize total (HT7) or phosphorylated (AT8) HsMAPT. (B) Hippocampal tissue lysates from AT-Nfe2l2-WT and AT-nfe2l2-KO mice were separated into sarkosyl-soluble (SS) and sarkosyl-insoluble (SI) fractions. Total HsMAPT and MmMAPT levels were determined using anti-TAU46 antibody that recognizes MAPT from both species. (C) Densitometric quantification of representative blots from (B). (D) Hippocampal tissue lysates from AT-Nfe2l2-WT and AT-nfe2l2-KO mice were separated into sarkosyl-soluble (SS) and sarkosyl-insoluble (SI) fractions and analyzed with anti-PHF1 antibody that recognizes human p-HsMAPT. (E) Densitometric quantification of representative blots from (D). For (C) and (E), data are mean ± SEM (n = 6). Statistical analysis was performed with the Student t test. *, p < 0.05; comparing AT-Nfe2l2-WT and AT-nfe2l2-KO groups.
Figure 6.
Figure 6.
NFE2L2 modulates neuronal autophagy. (A) Confocal analysis of double immunofluorescence with anti-APP/Aβ (4G8, red) and anti-SQSTM1 (green) antibodies in subiculum of AT-Nfe2l2-WT and AT-nfe2l2-KO. (B) Quantification of colocalization between APP/Aβ and SQSTM1 staining expressed as Mander's coefficients. (C) Confocal analysis of double immunofluorescence with anti-HsMAPT (HT7, red) and anti-SQSTM1 (green) in subiculum neurons of AT-Nfe2l2-WT and AT-nfe2l2-KO. (D) Quantification of colocalization between HsMAPT and SQSTM1 expressed as Mander's coefficients. For (B) and (D), Mander's coefficients were derived from 3 independent experiments with 2 fields per experiment. Fluorescence was quantified in 1.5-µm-thick stacks using the JACoP plugin of ImageJ software. Data are mean ± SEM. Statistical analysis was performed with a Student t test. *, p < 0.05; and ***, p < 0.001, comparing M1 and M2 coefficients obtained from AT-Nfe2l2-WT and AT-nfe2l2-KO images.
Figure 7.
Figure 7.
Evidence of NFE2L2 upregulation in neurons of AD subjects expressing high levels of HsAPP and HsMAPT. (A) Immunoblot analysis of NFE2L2, HMOX1, SQSTM1, CALCOCO2, and ATG7 in hippocampus of asymptomatic controls and patients with diagnosed AD who combined amyloidopathy and tauopathy. (B) Densitometric quantification of protein levels from representative immunoblots of (A) relative to ACTB. Data are represented as mean ± SEM (n = 5 controls and n = 5 AD subjects). Statistical analysis was performed with a Student t test. *, p < 0.05; **, p < 0.01; and ***, p < 0.001 comparing control vs. AD groups. (C) Adjacent 4-μm-thick brain sections from AD subjects were immunostained with anti-APP/Aβ (4G8), anti-HsMAPT (HT7), anti-NFE2L2 and anti-SQSTM1 antibodies as indicated. Red arrows point to the same neuron expressing HsAPP or HsMAPT, NFE2L2 and SQSTM1; blue arrows depict internal negative controls for cells that do not express HsAPP or HsMAPT and present basal staining for NFE2L2 and SQSTM1.

References

    1. Rubinsztein DC, Marino G, Kroemer G. Autophagy and aging. Cell 2011; 146:682-95; PMID:21884931; http://dx.doi.org/10.1016/j.cell.2011.07.030 - DOI - PubMed
    1. Ciechanover A, Kwon YT. Degradation of misfolded proteins in neurodegenerative diseases: therapeutic targets and strategies. Exp Mol Med 2015; 47:e147; PMID:25766616; http://dx.doi.org/10.1038/emm.2014.117 - DOI - PMC - PubMed
    1. Klionsky DJ, Emr SD. Autophagy as a regulated pathway of cellular degradation. Science 2000; 290:1717-21; PMID:11099404; http://dx.doi.org/10.1126/science.290.5497.1717 - DOI - PMC - PubMed
    1. Kim J, Kundu M, Viollet B, Guan KL. AMPK and mTOR regulate autophagy through direct phosphorylation of Ulk1. Nat Cell Biol 2011; 13:132-41; PMID:21258367; http://dx.doi.org/10.1038/ncb2152 - DOI - PMC - PubMed
    1. Settembre C, Di Malta C, Polito VA, Garcia Arencibia M, Vetrini F, Erdin S, Erdin SU, Huynh T, Medina D, Colella P, et al.. TFEB links autophagy to lysosomal biogenesis. Science 2011; 332:1429-33; PMID:21617040; http://dx.doi.org/10.1126/science.1204592 - DOI - PMC - PubMed

Publication types

Substances