. 2016 Aug 1;126(8):3089-103.
doi: 10.1172/JCI83404. Epub 2016 Jul 18.

p21 mediates macrophage reprogramming through regulation of p50-p50 NF-κB and IFN-β

p21 mediates macrophage reprogramming through regulation of p50-p50 NF-κB and IFN-β

Gorjana Rackov et al. J Clin Invest. .

Abstract

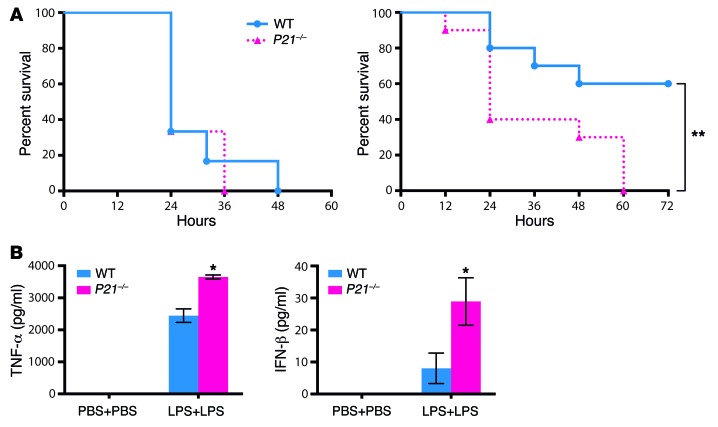
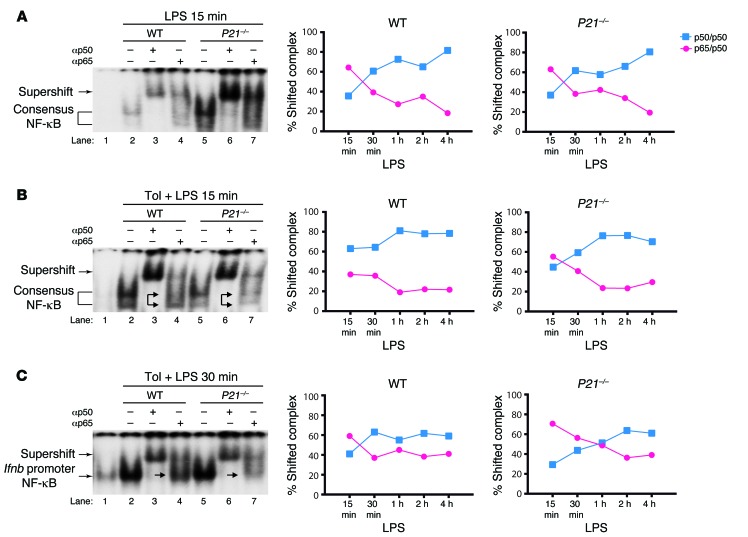
M1 and M2 macrophage phenotypes, which mediate proinflammatory and antiinflammatory functions, respectively, represent the extremes of immunoregulatory plasticity in the macrophage population. This plasticity can also result in intermediate macrophage states that support a balance between these opposing functions. In sepsis, M1 macrophages can compensate for hyperinflammation by acquiring an M2-like immunosuppressed status that increases the risk of secondary infection and death. The M1 to M2 macrophage reprogramming that develops during LPS tolerance resembles the pathological antiinflammatory response to sepsis. Here, we determined that p21 regulates macrophage reprogramming by shifting the balance between active p65-p50 and inhibitory p50-p50 NF-κB pathways. p21 deficiency reduced the DNA-binding affinity of the p50-p50 homodimer in LPS-primed and -rechallenged macrophages, impairing their ability to attenuate IFN-β production and acquire an M2-like hyporesponsive status. High p21 levels in sepsis patients correlated with low IFN-β expression, and p21 knockdown in human monocytes corroborated its role in IFN-β regulation. The data demonstrate that p21 adjusts the equilibrium between p65-p50 and p50-p50 NF-κB pathways to mediate macrophage plasticity in LPS tolerance. Identifying p21-related pathways involved in monocyte reprogramming may lead to potential targets for sepsis treatment.


Figures

Figure 1
Figure 1. p21 controls in vivo endotoxin tolerance.
(A) P21–/– and WT mice (n = 6) were treated with a single, high LPS dose, and showed 100% death (left). To induce tolerance, P21–/– and WT mice (n = 10) received a low LPS dose, followed by a high dose after 16 hours. P21–/– mice did not develop tolerance compared to WT mice, as indicated by a Kaplan-Meier survival curve (right). **P < 0.01, log‑rank (Mantel-Cox) test. (B) Blood was collected 2 hours after the second LPS injection and serum cytokines measured by ELISA. Levels of M1-associated cytokines (TNF-α and IFN-β) were elevated in the serum of P21–/– compared with WT mice. Data show the mean ± SD (n = 3 mice), *P < 0.05, 2-tailed Student’s t test.
Figure 2
Figure 2. p21 limits M1 activity during in vivo endotoxin tolerance.
P21–/– and WT mice received 2 LPS doses as in Figure 1. (A) At 2 hours after the second LPS injection, macrophage populations from peritoneal exudates were analyzed by flow cytometry. Representative plots show gated CD11bhiF4/80lo and CD11bhiF4/80hi macrophages. The relative percentages of these 2 populations within the total F4/80+ gate, as well as total macrophage numbers, were similar for WT and P21–/– mice after dual LPS or PBS treatment (right). Data show the mean ± SD (n = 8); NS, not significant. (B) Intracellular staining showed that after dual LPS challenge, TNF-α production by F4/80lo macrophages was higher in P21–/– compared with WT mice. Data show the mean ± SEM (n = 4); **P < 0.01. (C) After dual LPS treatment, intracellular TNF-α levels were elevated in P21–/– F4/80hi compared with WT macrophages. Data show the mean ± SEM (n = 4 mice), *P < 0.05, 2-tailed Student’s t test. SS, side scatter.
Figure 3
Figure 3. P21–/– macrophages show impaired ability to polarize to M2 cells during in vitro endotoxin tolerance.
(A) Scheme showing the in vitro endotoxin tolerance model. Peritoneal macrophages from WT and P21–/– mice were tolerized with 100 ng/ml LPS for 20 hours (Tol), washed with PBS, cultured in medium (2 hours), and restimulated with 100 ng/ml LPS for 4 hours (Tol + LPS). LPS-activated cells were stimulated with LPS for 4 hours without previous tolerization (LPS). Cells left untreated were controls (Ctrl). Total RNA was extracted at 4 hours after LPS treatment and analyzed for gene expression. Culture supernatants were analyzed for cytokine production. (B) RT-PCR analysis showed impaired upregulation of M2-associated genes in P21–/– compared with WT macrophages after tolerization. (C) RT-PCR showed upregulation of representative M1 cytokine genes in P21–/– compared with WT tolerized macrophages. Results were normalized to β-actin and represent fold induction over unstimulated WT cells. (D) M1-associated TNF-α and IFN-β and M2-associated CCL17 production in WT and P21–/– macrophages at different time points after LPS restimulation, as measured by ELISA. In all cases data show the mean ± SEM (n = 3 independent experiments), *P < 0.05, **P < 0.01, ***P < 0.001, 2-tailed Student’s t test.
Figure 4
Figure 4. IFN-β neutralization reduces STAT1 phosphorylation and induces hyporesponsiveness in P21–/– macrophages.
(A) P21 mRNA and protein levels in LPS-rechallenged WT macrophages. (B) STAT1 phosphorylation in WT and P21–/– macrophages. (C) Increased iNOS and CXCL11 expression in tolerized P21–/– macrophages. (D and E) P21–/– peritoneal macrophages were incubated with an IFN-β– or TNF-α–neutralizing antibody or an isotype control during LPS tolerization (20 hours). Cells were washed, cultured in medium (2 hours) and restimulated with LPS (4 hours). (D) Reduction in STAT1 phosphorylation and iNOS expression after antibody treatment at indicated times. (E) RT-PCR analysis of P21–/– macrophages incubated with appropriate antibodies during LPS tolerization (20 hours) and restimulated with LPS (4 hours). (F) After LPS tolerization, P21–/– macrophages were restimulated with LPS (4 hours) in the presence of anti–IFN-β or isotype control antibody. Immunoblot shows a reduction in STAT1 phosphorylation and iNOS expression. (G) WT macrophages were treated with IFN-β during LPS tolerization, restimulated with LPS (4 hours), and analyzed by RT-PCR. (H) P21–/– mice were challenged with 2 LPS doses as in Figure 1. At 2 hours before LPS rechallenge, mice were treated i.p. with anti-IFNAR1 antibody or control IgG. Inhibition of IFNAR1 improved tolerance to LPS, as shown by a Kaplan-Meier survival curve (n = 9), ***P < 0.001, log‑rank (Mantel-Cox) test. For all RT-PCR analyses, results were normalized to β‑actin and show fold induction over unstimulated WT cells. Data shown as the mean ± SEM (n = 3 independent experiments), *P < 0.05, **P < 0.01, ***P < 0.001. For A and E, 1-way ANOVA. For C and G, 2-tailed Student’s t test. NS, not significant. For immunoblots, β-actin was used as a loading control. Western blots in A and B were derived from the same experiment. Representative gels of 3 experiments are shown.
Figure 5
Figure 5. p21 modulates the balance between p65-p50 and p50-p50 NF-κB dimers in LPS-tolerized macrophages.
WT and P21–/– resting or tolerized (20 hours) peritoneal macrophages were stimulated with LPS (4 hours). NF-κB complexes that bound the consensus or the Ifnb promoter sequence were analyzed by EMSA. Anti–p50 and –p65 NF-κB antibodies were used for supershift analysis. Supershift intensity was assessed by densitometry and plotted as the percentage of supershifted complex at indicated times after LPS stimulation. (A) Left, Increased NF-κB binding to the consensus sequence in P21–/– (lane 5) compared with WT (lane 2) LPS-activated macrophages (shown at 15 minutes). Right, Relative NF-κB complex composition at different times after LPS activation. (B) Left, Similar NF-κB binding to the consensus sequence in WT (lane 2) and P21–/– (lane 5) LPS-tolerized macrophages (shown at 15 minutes) and reduced p50-p50 DNA binding in P21–/– macrophages as indicated by arrows (compare lanes 4 and 7). Right, Delayed switch to p50-p50 NF-κB complex composition in P21–/– LPS-tolerized macrophages. (C) Left, Similar NF-κB binding to the Ifnb promoter sequence in WT (lane 2) and P21–/– (lane 5) macrophages after LPS restimulation (shown at 30 minutes) and reduced p50-p50 DNA binding in P21–/– macrophages (compare lanes 4 and 7; arrow). Right, Delayed switch to p50-p50 NF-κB complexes bound to the Ifnb promoter sequence in P21–/– LPS-tolerized macrophages. In all gels, the first lane is nuclear extract of untreated macrophages (negative control). Representative results of 2 independent experiments are shown.
Figure 6
Figure 6. p21 regulates p50-p50 NF-κB DNA binding.
(A) RT-PCR analysis showing similar Nfkb1 (encoding p105) and Bcl3 gene expression in WT and P21–/– LPS-tolerized/restimulated peritoneal macrophages. Results were normalized to β‑actin and show fold induction over unstimulated WT cells. Data are representative of 3 independent experiments. (B) Immunoblot showing similar p50 protein levels in the cytoplasmic and nuclear fractions of WT and P21–/– LPS-tolerized/restimulated peritoneal macrophages. β-Actin and histone H1 were used as loading controls for the cytoplasmic and nuclear fractions, respectively. (C) Reduced ubiquitination of p50 in P21–/– LPS-tolerized/restimulated peritoneal macrophages. Equal amounts of protein were immunoprecipitated with antibody against p50 and immunoblotted with antibody against ubiquitin. n.c., negative control; IP performed in the absence of cell extracts. (D) Reduced p50 phosphorylation in P21–/– LPS-tolerized/restimulated peritoneal macrophages. Equal amounts of protein were immunoprecipitated with antibody against p50 and immunoblotted with antibody against phospho-serine/threonine. (E) p21 increases p50 homodimer binding to DNA by increasing its affinity. Tolerized (20 hours) WT and P21–/– peritoneal macrophages were stimulated with LPS (15 minutes). Anti–p50 NF-κB antibody was used for supershift assays with increasing amounts of unlabeled oligonucleotide (cold probe), and NF-κB complexes binding the Ifnb promoter sequence were analyzed by EMSA. (F) p50-p50 and p65-p50 DNA binding was measured by densitometry of autoradiogram in E. Shown are representative gels of at least 2 experiments performed.
Figure 7
Figure 7. p21 regulates hyporesponsiveness of human monocytes from healthy donors and sepsis patients.
(A) Total RNA was extracted from monocytes isolated from sepsis patients and healthy volunteers and analyzed by RT-PCR. Top, P21 mRNA levels were significantly higher in monocytes from sepsis patients than those from controls. The median is shown (n = 7), *P < 0.05, 2-tailed Mann-Whitney U test. Bottom, Correlation between P21 and Ifnb levels in monocytes from sepsis patients. Results were normalized to β-actin and log2 values were used to calculate correlation; n = 7, 2-tailed Pearson’s test r = –0.7944, *P < 0.05. (B) Monocytes from healthy volunteers and sepsis patients were challenged ex vivo with 10 ng/ml LPS (1 hour). RT-PCR analysis showed Ifnb upregulation in monocytes from healthy donors but not from sepsis patients (top). High P21 expression was detected in monocytes from sepsis patients before and after LPS treatment (bottom); (n = 5), 1-tailed Student’s t test. NS, not significant. (C) Cultured human monocytes from healthy volunteers were tolerized with LPS, washed, and restimulated with LPS. RT-PCR analysis showed high P21 expression in tolerant human monocytes (top). Ifnb expression was downregulated in tolerant cells; (n = 4), 1-way ANOVA. (D) Cultured human monocytes from healthy volunteers were transfected with p21 siRNA or control siRNA. Cells were then LPS tolerized and rechallenged with LPS. After LPS rechallenge, RT-PCR showed that P21 mRNA was abolished in cultures transfected with P21-specific siRNA, and Ifnb expression was upregulated compared with control siRNA–transfected cells; (n = 4), 2-tailed Student’s t test. In all RT-PCR experiments, results were normalized to β-actin. Data shown as the mean ± SEM. *P < 0.05, **P < 0.01, ***P < 0.001.

Similar articles

Cited by

References

    1. Gordon S, Taylor PR. Monocyte and macrophage heterogeneity. Nat Rev Immunol. 2005;5(12):953–964. doi: 10.1038/nri1733. - DOI - PubMed
    1. Lawrence T, Natoli G. Transcriptional regulation of macrophage polarization: enabling diversity with identity. Nat Rev Immunol. 2011;11(11):750–761. doi: 10.1038/nri3088. - DOI - PubMed
    1. Mosser DM, Edwards JP. Exploring the full spectrum of macrophage activation. Nat Rev Immunol. 2008;8(12):958–969. doi: 10.1038/nri2448. - DOI - PMC - PubMed
    1. Biswas SK, Mantovani A. Macrophage plasticity and interaction with lymphocyte subsets: cancer as a paradigm. Nat Immunol. 2010;11(10):889–896. doi: 10.1038/ni.1937. - DOI - PubMed
    1. Gordon S, Martinez FO. Alternative activation of macrophages: mechanism and functions. Immunity. 2010;32(5):593–604. doi: 10.1016/j.immuni.2010.05.007. - DOI - PubMed

Publication types

MeSH terms