. 2016 Aug 1;126(8):3036-52.
doi: 10.1172/JCI83416. Epub 2016 Jul 18.

Tandem CAR T cells targeting HER2 and IL13Rα2 mitigate tumor antigen escape

Tandem CAR T cells targeting HER2 and IL13Rα2 mitigate tumor antigen escape

Meenakshi Hegde et al. J Clin Invest. .

Expression of concern in

  • Tandem CAR T cells targeting HER2 and IL13Rα2 mitigate tumor antigen escape.
    Hegde M, Mukherjee M, Grada Z, Pignata A, Landi D, Navai SA, Wakefield A, Fousek K, Bielamowicz K, Chow KK, Brawley VS, Byrd TT, Krebs S, Gottschalk S, Wels WS, Baker ML, Dotti G, Mamonkin M, Brenner MK, Orange JS, Ahmed N. Hegde M, et al. J Clin Invest. 2019 Jul 2;129(8):3464. doi: 10.1172/JCI131246. eCollection 2019 Jul 2. J Clin Invest. 2019. PMID: 31264975 Free PMC article. No abstract available.

Abstract

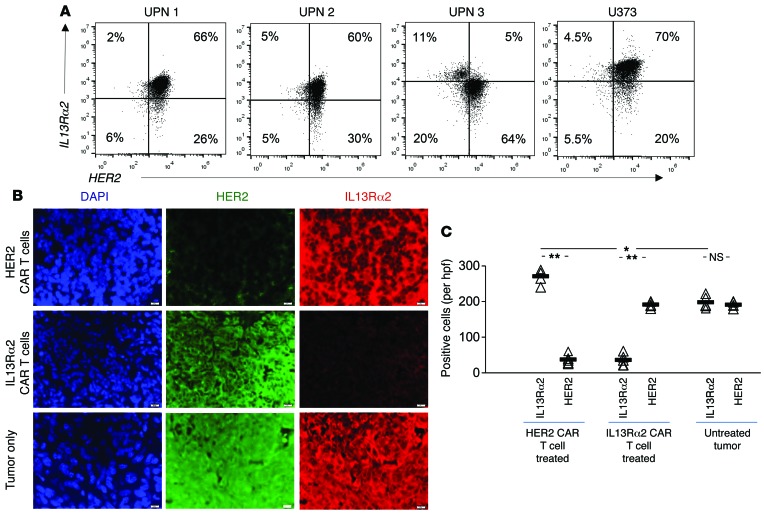
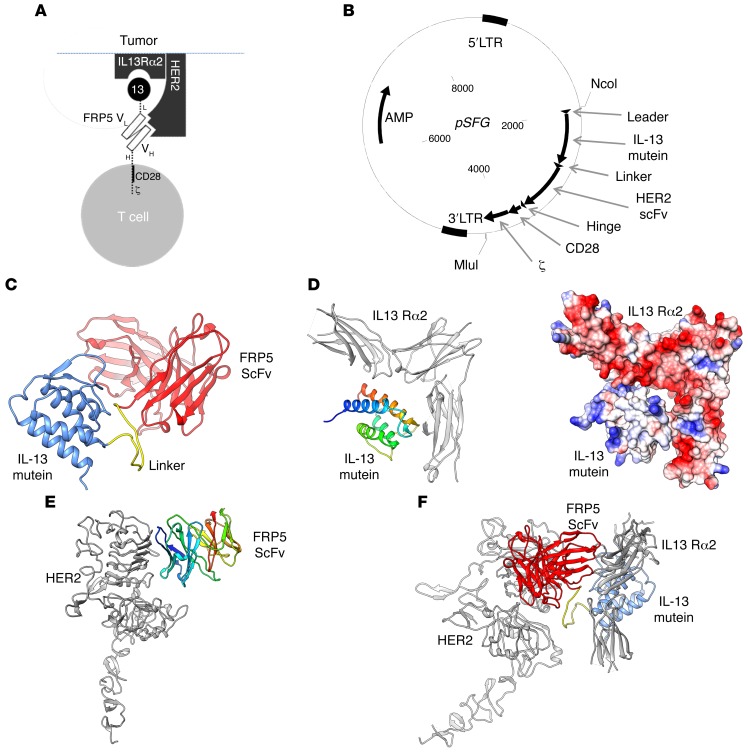
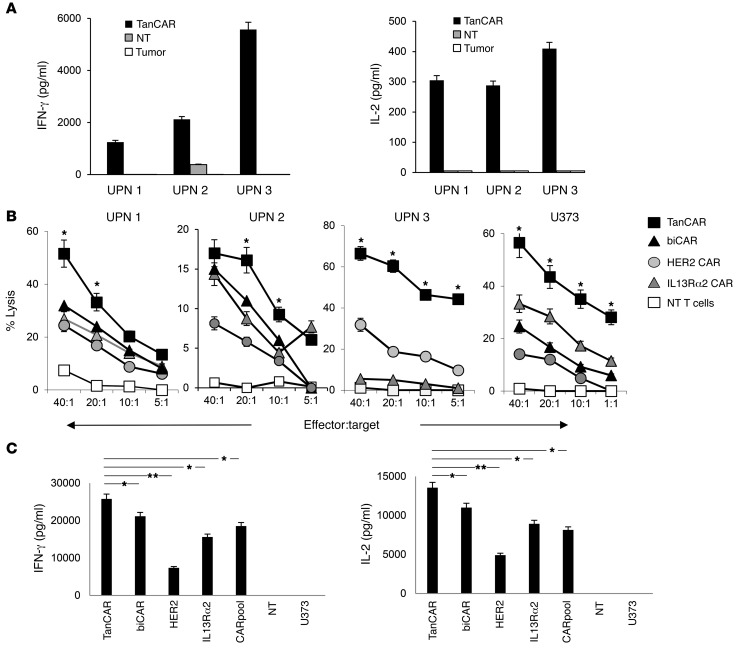
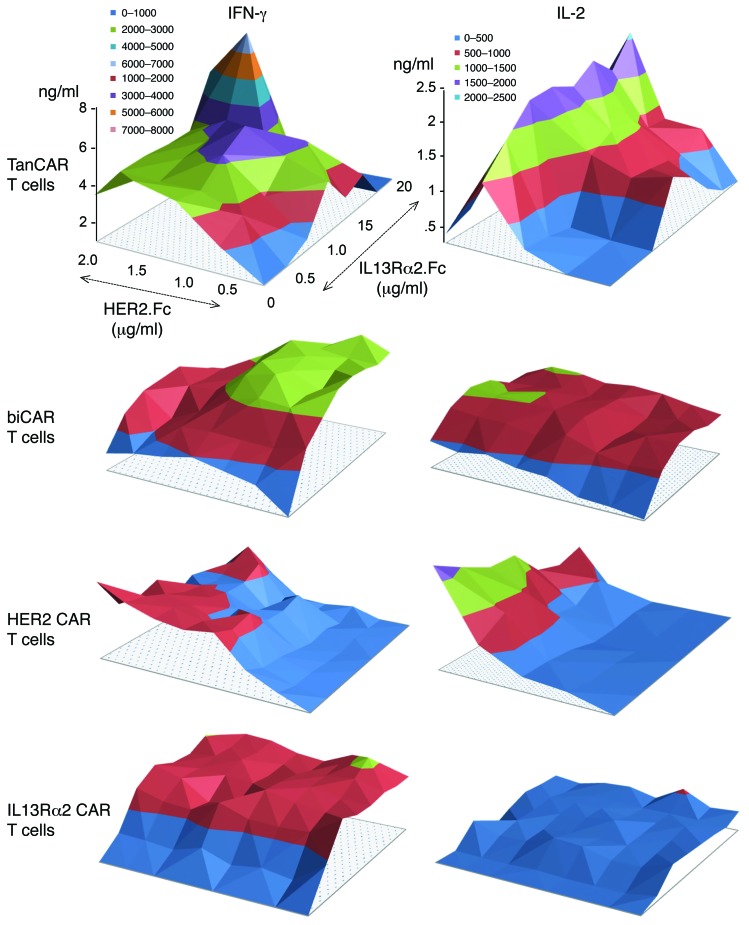
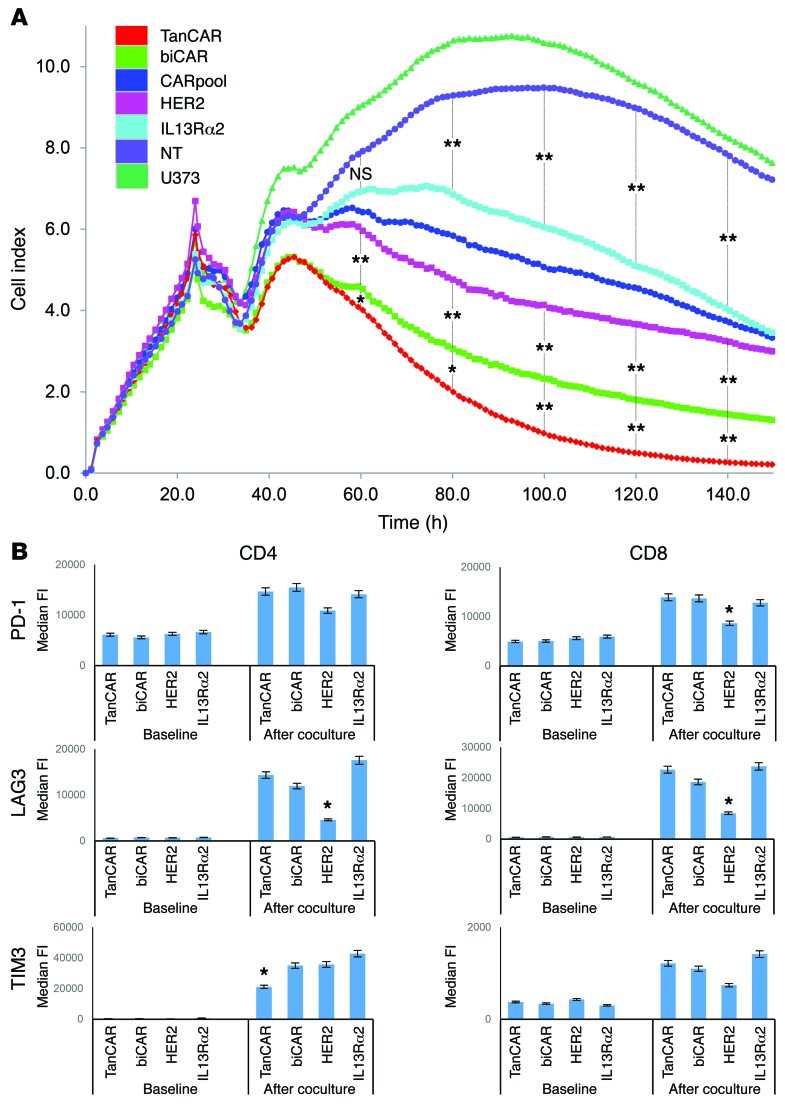
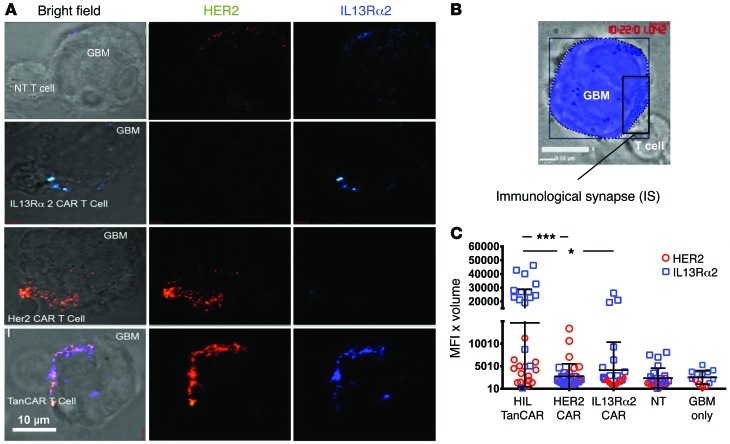
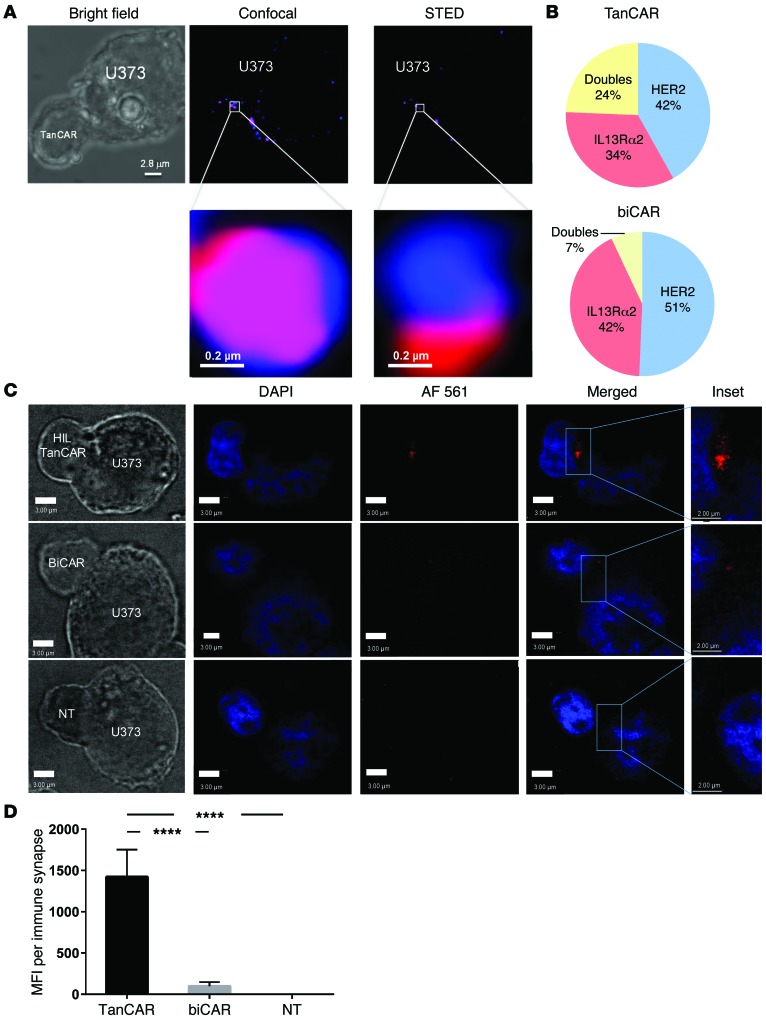
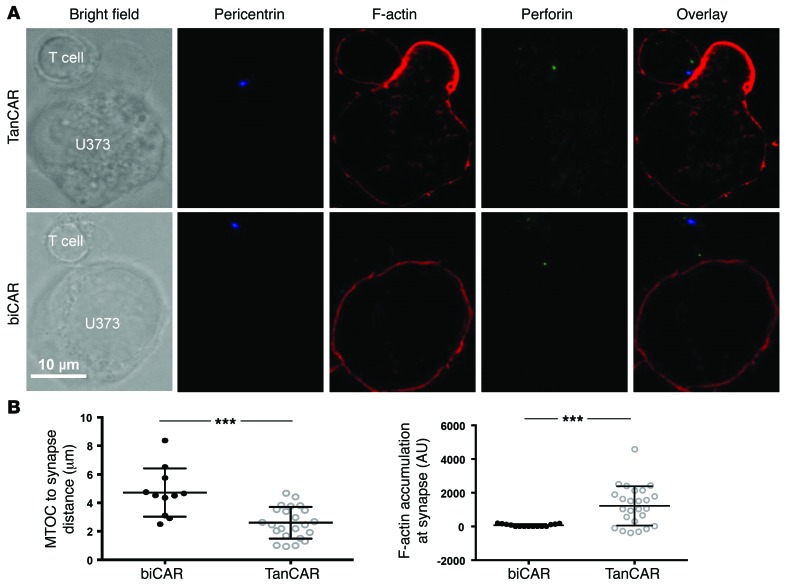
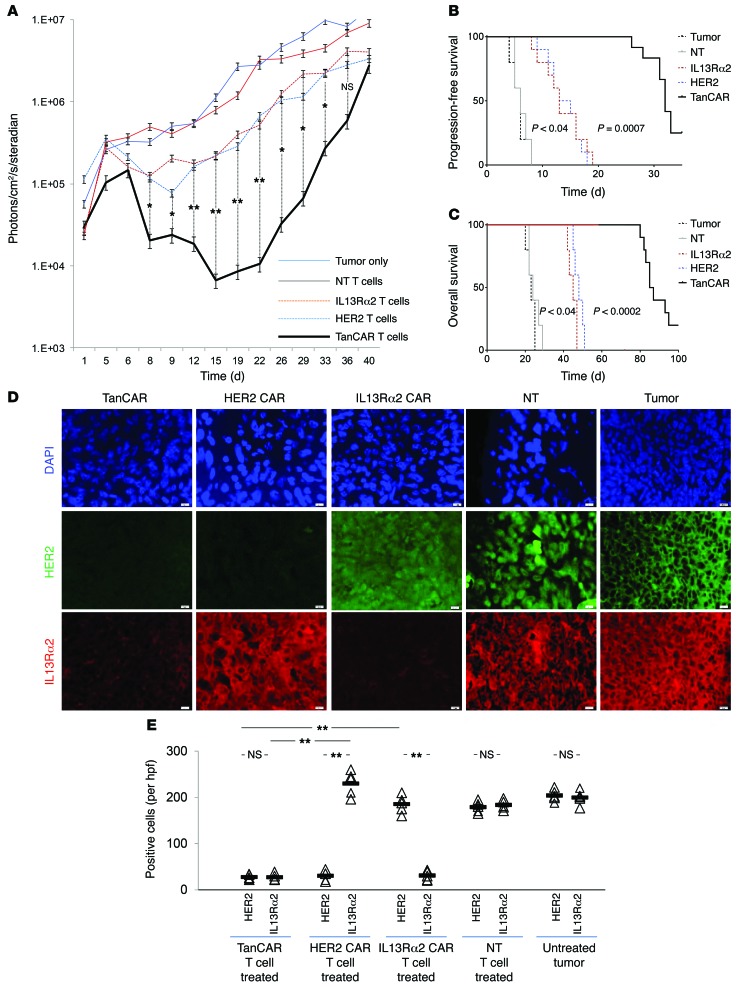
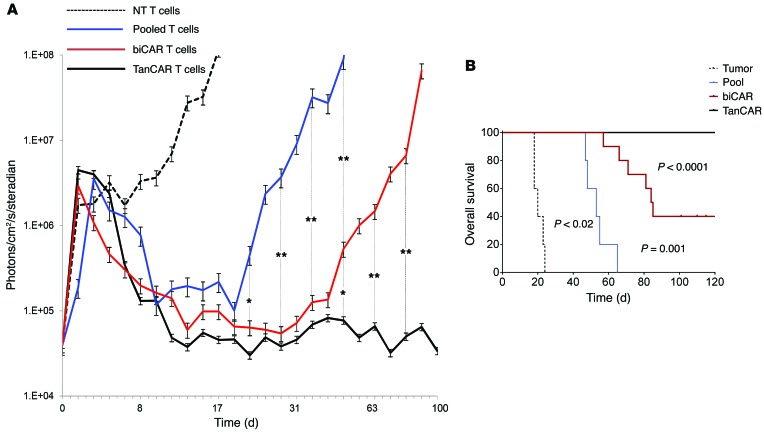
In preclinical models of glioblastoma, antigen escape variants can lead to tumor recurrence after treatment with CAR T cells that are redirected to single tumor antigens. Given the heterogeneous expression of antigens on glioblastomas, we hypothesized that a bispecific CAR molecule would mitigate antigen escape and improve the antitumor activity of T cells. Here, we created a CAR that joins a HER2-binding scFv and an IL13Rα2-binding IL-13 mutein to make a tandem CAR exodomain (TanCAR) and a CD28.ζ endodomain. We determined that patient TanCAR T cells showed distinct binding to HER2 or IL13Rα2 and had the capability to lyse autologous glioblastoma. TanCAR T cells exhibited activation dynamics that were comparable to those of single CAR T cells upon encounter of HER2 or IL13Rα2. We observed that TanCARs engaged HER2 and IL13Rα2 simultaneously by inducing HER2-IL13Rα2 heterodimers, which promoted superadditive T cell activation when both antigens were encountered concurrently. TanCAR T cell activity was more sustained but not more exhaustible than that of T cells that coexpressed a HER2 CAR and an IL13Rα2 CAR, T cells with a unispecific CAR, or a pooled product. In a murine glioblastoma model, TanCAR T cells mitigated antigen escape, displayed enhanced antitumor efficacy, and improved animal survival. Thus, TanCAR T cells show therapeutic potential to improve glioblastoma control by coengaging HER2 and IL13Rα2 in an augmented, bivalent immune synapse that enhances T cell functionality and reduces antigen escape.


Figures

Figure 1
Figure 1. Surface expression of HER2 and IL13Rα2 in primary GBM and the GBM cell line U373 and loss of target antigen in CAR T cell–treated xenografts.
(A) Single-cell suspensions of primary GBM excision samples and U373 were costained for HER2 and IL13Rα2, and more than 100,000 events were analyzed by flow cytometry. Shown are representative dot plots of 3 experiments. UPN, unique patient number. (B) Analysis of U373 xenografts recurring after CAR T cell therapy targeting HER2 and IL13Rα2 using coimmunofluorescence for HER2 and IL13Rα2. Original magnification, ×100. Scale bar – 20 µm. (C) Quantification of staining for HER2 and IL13Rα2 of the data shown in B. Cells were counted in 5 high-power fields (hpfs) per sample. Individual values per hpf and average (bar) are shown. A single-step Tukey’s range test was used for multiple comparisons. *P < 0.05, **P < 0.005.
Figure 2
Figure 2. The HER2/IL13Rα2 tandem CAR (TanCAR) structure, its encoding transgene, and in silico interrogation of its docking properties.
(A) Cartoon depicting the TanCAR docking to respective targets. 13, IL-13 mutein; L, linker; VL, FRP5 variable domain of the Ig light chain; VH, FRP5 variable domain of the Ig heavy chain; H, hinge. (B) SFG vector encoding the HER2/IL13Rα2 TanCAR. (CF) In silico modeling of HIL TanCAR to respective targets: (C) A computational rendition of the TanCAR structure. The FRP5-scFv is shown in red, while the IL-13 mutein domain is shown in blue. The glycine/serine linker is highlighted in yellow. (D) The computational docking of the IL-13 mutein domain to IL13Rα2. The receptor is colored in gray, while the IL-13 mutein domain is rainbow colored (blue to red, N- to C-terminus). The IL-13 receptor is shown with its C-terminus pointing down. The docking model shows good electrostatic complementarity, where red is negatively charged and blue positively charged, between the 2 molecules. (E) Docking of the FRP5-scFv to the HER2 receptor. Coloring is as in D; the scFv domain is rainbow colored, and the receptor is gray. (F) A favorable model of the TanCAR bound to both HER2 and IL13Rα2.
Figure 3
Figure 3. Activity of GBM patients’ TanCAR T cells against autologous GBM and U373.
(A) Cytokine (IFN-γ and IL-2) production of TanCAR and nontransduced (NT) T cells generated from GBM patients detected in the supernatant 24 hours after coculture with autologous primary GBM cells. Shown are pooled data from 2 experiments done in triplicates. (B) Four-hour 51Cr-release assays of primary TanCAR T cells from UPN 1, 2, and 3 against autologous GBM cells compared with the unispecific CAR T cells, a pooled product of aliquots thereof (CARpool), T cells coexpressing both HER2 and IL13Rα2 CARs (biCAR), and NT T cells, all generated from the same patient. Healthy donor-derived T cells were tested against the U373-GBM line. biCAR T cell product for UPN 3 was not available. Shown are representative data from 3 independent experiments done in triplicates. Two-tailed t test was performed between TanCAR and the T cell product exhibiting the highest degree of killing. *P < 0.05. (C) Cytokine analysis (IFN-γ and IL-2) from supernatants of cocultures of primary TanCAR T cells, biCAR T cells, CARpool T cells, and unispecific CAR T cells with HER2 and IL13α2 expressing U373 GBM cells (25,000 T cells to 100,000 tumor cells), as detected by ELISA. Shown are pooled data from 3 independent experiments done in triplicates. A single-step Tukey’s range test was used. *P < 0.05, **P < 0.005.
Figure 4
Figure 4. Dynamics of activation of TanCAR T cells upon encounter of a density gradient of HER2 and IL13Rα2.
The activation dynamics of TanCAR T cells, biCAR T cells, HER2 CAR T cells, and IL13Rα2 CAR T cells was studied by seeding of the cells onto polypropylene surface-bound HER2 (range 0–2.0 μg/ml), IL13Rα2 (range 0–20 μg/ml), an irrelevant target (GD2.scFv anti-idiotype, 5 µg/ml), and OKT3 (1 µg/ml). Cytokine analysis (IFN-γ and IL-2) of the culture supernatant using ELISA was performed after 24 hours. Shown are representative data from 3 independent experiments done in triplicates. The titration included 10 antigen concentrations on each axis. Two-tailed t test was used to compare TanCAR cytokine values with those for each single-specificity CAR and biCAR T cells. Significant results are reported in Results. Nonspecific positive control OKT3 induced both IFN-γ (5.5 ng/ml) and IL-2 (2.0 ng/ml) release by TanCAR T cells while there was no cytokine production with GD2 anti-idiotype.
Figure 5
Figure 5. Assessment of sustenance of the antitumor activity of TanCAR T cells and their expression of the exhaustion markers PD-1, LAG3, and TIM3.
(A) Continuous graphical output of cell index values up to the 150-hour time point from U373 during incubation with TanCAR, biCAR, CARpool, HER2 CAR, and IL13Rα2 CAR T cells and tumor only using the xCELLigence impedance system. U373 cells were seeded in electrode-coated 96-well plates (e-plates) in triplicates. T cells were added at a ratio of 1 T cell for each 10 U373 tumor cells 24 hours later to allow for U373 attachment and confluence. Electrical impedance was recorded continuously as an indicator of U373 density. (B) Median fluorescence intensity values for PD-1, LAG3, and TIM3 expression on the CD8+ and CD4+ CAR T cell compartment before and after repeated stimulation with U373 tumor cells for 1 week. For both experiments, shown are representative data from 3 independent experiments done in triplicates. A single-step Tukey’s range test was used. *P < 0.05, **P < 0.005.
Figure 6
Figure 6. TanCARs recruit HER2 and IL13Rα2 to form bivalent cytolytic IS.
(A) Three-dimensional confocal microscopy of fixed cells showing representative images of TanCAR T cells, IL13Rα2 CAR T cells, HER2 CAR T cells, and NT T cells, conjugated with GBM cells. After 30 minutes at 37°C on Silane-coated glass slides (Thermo Fisher), conjugates were fixed and stained with anti-IL13Rα2 (blue) and anti-HER2 (red) antibodies. (B) The IS was reconstituted in 3D, and its volume was quantified. (C) HER2 (red circles) and IL13Rα2 (blue squares) show dual clustering at the TanCAR synapse along with significantly higher clustering of IL13Rα2 compared with the single-CAR and NT T cells as well as compared with the normal ligand accumulation on the tumor cell surface. Cells were imaged in Z stacks on a Zeiss Axio-Observer Z1 equipped with a Yokogawa CSU10 spinning disc, Zeiss 63× 1.43 NA objective, and Hamamatsu Orca-AG camera. Images were acquired with Volocity software. Scale bar: 10 μm. Shown are representative data from 3 independent experiments done in triplicates. Two-tailed t test and single-step Tukey’s range test were performed. *P < 0.05, ***P < 0.0005. MFI × Volume indicates the mean fluorescence intensity (MFI) of all voxels included in the Z stacks of a reconstituted IS multiplied by the volume of the IS.
Figure 7
Figure 7. TanCARs heterodimerize HER2 and IL13Rα2 by engaging both target molecules simultaneously.
(A) TanCAR T cells were conjugated to U373-GBM cells for 10 minutes on Silane-coated glass slides and stained for HER2 (red) and IL13Rα2 (blue) on the tumor surface. Conjugated CAR and U373 complexes were then imaged by dual-channel STED super-resolution microscopy. Shown is the same cell with colocalized HER2 and IL13Rα2 detected by bright field (left), confocal (middle), and STED (right). A region of interest is enlarged to show greater resolution of the colocalized ligands (bottom row). (B) Pie chart distribution of single HER2 or IL13Rα2 aggregates or dual aggregates in TanCAR and biCAR T cell conjugates to U373 cells imaged using STED microscopy is shown within a subdiffractive range of light (<200 nm). Full width at half maximum (FWHM) values for HER2 and IL13Rα2 denote that the resolution using STED was 183 nm and 250 nm, respectively. FWHM analysis is shown in Supplemental Figure 2. (C) Fluorescent microscopy of Duolink PLA detecting T cell–GBM interactions. U373 tumor cells were coincubated with TanCAR (top row), biCAR (middle row), and NT (bottom row) T cells. Conjugates were mounted and fixed, and the PLA was performed to detect colocalization of HER2 and IL13Rα2 at the IS with a proximity of less than 40 nm. Images were captured with fluorescent confocal microscopy. Positive signal is indicated by red fluorescence. Scale bar: 3 μm. Inset scale bar: 2.0 μm. (D) The PLA MFI per IS was significantly higher in the TanCAR T cell–U373 interactions than in both the biCAR T cell–U373 and the NT T cell–U373 interactions, suggesting that the TanCAR is simultaneously docking with HER2 and IL13Rα2. Shown are representative data from 4 independent experiments done in triplicates with more than 30 synapses surveyed. Two-tailed t test was used. ****P < 0.00005.
Figure 8
Figure 8. Increased accumulation of F-actin and increased polarization of the microtubular organizing center at the TanCAR-mediated IS.
(A) Representative confocal images of TanCAR and biCAR T cells in immune conjugation with U373-GBM cells showing bright field, anti-pericentrin (blue), single-color anti–F-actin (red), anti-perforin (green), and overlay of all stains. (B) TanCAR T cells (open circles) or biCAR T cells (filled circles) were assessed for their ability to polarize to the target cell (measured by distance from the microtubular organizing center [MTOC] to the IS) and the accumulation of F-actin at the IS. Cells were imaged in Z stacks on a Leica TCS SP8 confocal microscope, Leica ×100 NA objective. Images were acquired with LAS AF software (Leica) and analyzed with Volocity software. Each data point represents an individual synapse and is a collective from 2 independent experiments. ***P < 0.0005.
Figure 9
Figure 9. In vivo stress-test experiment evaluating the antitumor activity of CAR T cell products: effect on time to tumor progression, overall survival, and antigen escape.
Tumors were established by stereotactic injection of 2.5 × 10⁵ eGFP.Firefly luciferase–expressing U373 cells into the right frontal cortex of SCID mice. On day 8 after tumor cell injection, mice were treated with an intratumoral injection of 1 × 10⁶ TanCAR T cells (n = 10), HER2 CAR T cells (n = 10), IL13Rα2 CAR T cells (n = 10), or NT T cells (n = 5). The projected T cell/GBM cell ratio was 1:30. Untreated mice (n = 5) were used as controls. (A) Quantitative bioluminescence imaging done at predetermined time points to monitor tumor growth shows the group median, photons/cm2/second/area imaged. See Supplemental Figure 3 for representative animal images. (B) Kaplan-Meier analysis of progression-free survival closed at 40 days after the tumor was established. (C) Kaplan-Meier analysis of overall survival closed at 100 days after the tumor was established. (D) Progressive or recurrent tumors in all 5 groups were analyzed for their antigen expression pattern using coimmunofluorescence for HER2 (green) and IL13α2 (red). DAPI (blue) was used for nuclear staining. Original magnification, ×100. Scale bar – 20 µm. (E) Quantification of staining for HER2 and IL13Rα2 of the data shown in D. Cells were counted in 5–7 hpfs. Individual values per hpf and average are shown. **P < 0.005. A single-step Tukey’s range test was performed.
Figure 10
Figure 10. In vivo efficacy experiment evaluating the antitumor activity of CAR T cell products: ability to eliminate established tumors and overall survival.
Tumors were established by stereotactic injection of 5 × 10⁴ eGFP.Firefly luciferase–expressing U373 cells into the right frontal cortex of SCID mice. On day 5 after tumor cell injection, mice were treated with an intratumoral injection of 2 × 10⁶ TanCAR T cells (n = 13), biCAR T cells (n = 10), or CARpool T cells (n = 5). Mice treated with NT T cells (n = 5) were used as controls. The projected T cell/GBM cell ratio was 1:3. (A) Quantitative bioluminescence imaging done at predetermined time points to monitor tumor growth shows the group median, photons/cm2/second/area imaged. *P < 0.05, **P < 0.005. (B) Kaplan-Meier analysis of the overall survival closed at 140 days after the tumor was established. TanCAR transduction rate was normalized to the rate of coexpression of HER2 and IL13Rα2 in biCAR T cells and to individual CAR expression in unispecific products. P values as shown in the figure were calculated using log-rank test.

Similar articles

Cited by

References

    1. Eshhar Z, Waks T, Gross G, Schindler DG. Specific activation and targeting of cytotoxic lymphocytes through chimeric single chains consisting of antibody-binding domains and the γ or ζ subunits of the immunoglobulin and T-cell receptors. Proc Natl Acad Sci U S A. 1993;90(2):720–724. doi: 10.1073/pnas.90.2.720. - DOI - PMC - PubMed
    1. Ahmed N, et al. HER2-specific T cells target primary glioblastoma stem cells and induce regression of autologous experimental tumors. Clin Cancer Res. 2010;16(2):474–485. doi: 10.1158/1078-0432.CCR-09-1322. - DOI - PMC - PubMed
    1. Krebs S, et al. T cells redirected to interleukin-13Rα2 with interleukin-13 mutein — chimeric antigen receptors have anti-glioma activity but also recognize interleukin-13Rα1. Cytotherapy. 2014;16(8):1121–1131. doi: 10.1016/j.jcyt.2014.02.012. - DOI - PMC - PubMed
    1. Chow KK, et al. T cells redirected to EphA2 for the immunotherapy of glioblastoma. Mol Ther. 2013;21(3):629–637. doi: 10.1038/mt.2012.210. - DOI - PMC - PubMed
    1. Ahmed N, et al. Immunotherapy for osteosarcoma: genetic modification of T cells overcomes low levels of tumor antigen expression. Mol Ther. 2009;17(10):1779–1787. doi: 10.1038/mt.2009.133. - DOI - PMC - PubMed

Publication types

MeSH terms