. 2016 Aug 1;126(8):2867-80.
doi: 10.1172/JCI82529. Epub 2016 Jul 18.

Schlafen 4-expressing myeloid-derived suppressor cells are induced during murine gastric metaplasia

Schlafen 4-expressing myeloid-derived suppressor cells are induced during murine gastric metaplasia

Lin Ding et al. J Clin Invest. .

Abstract

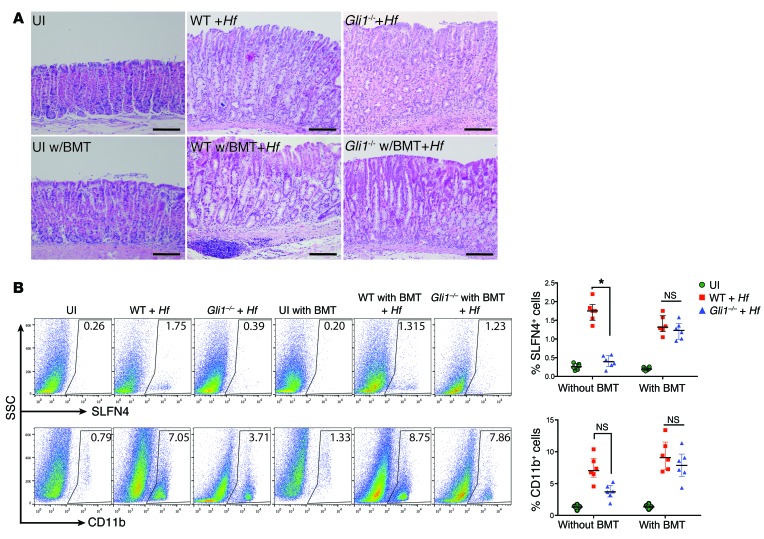
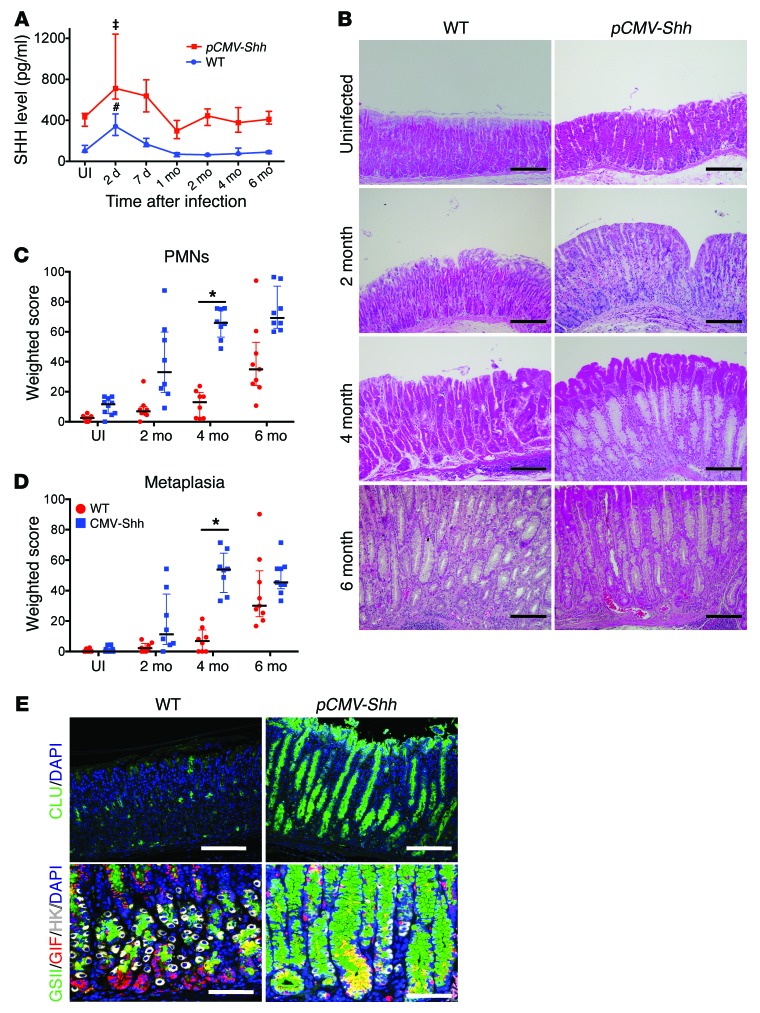
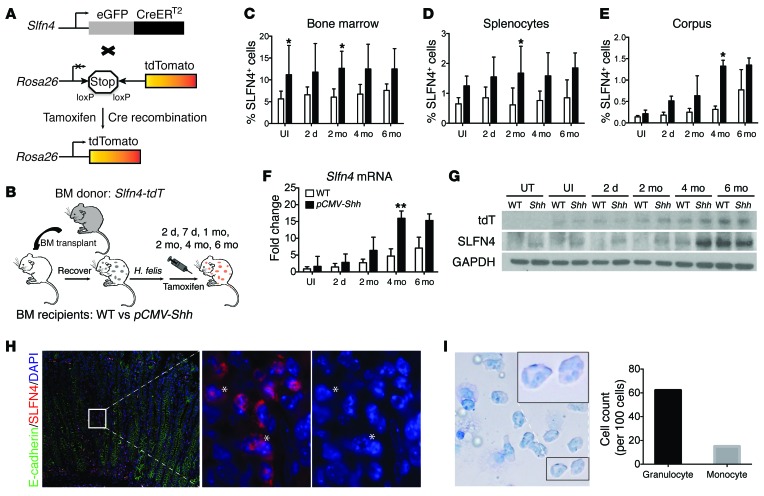
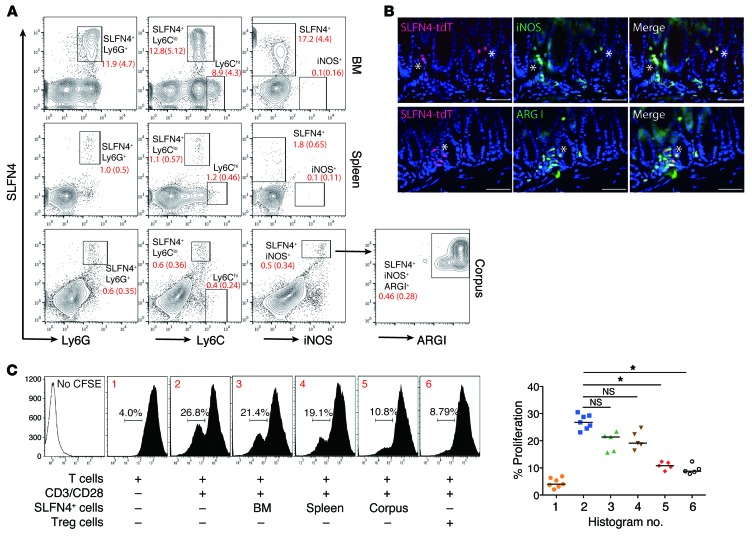
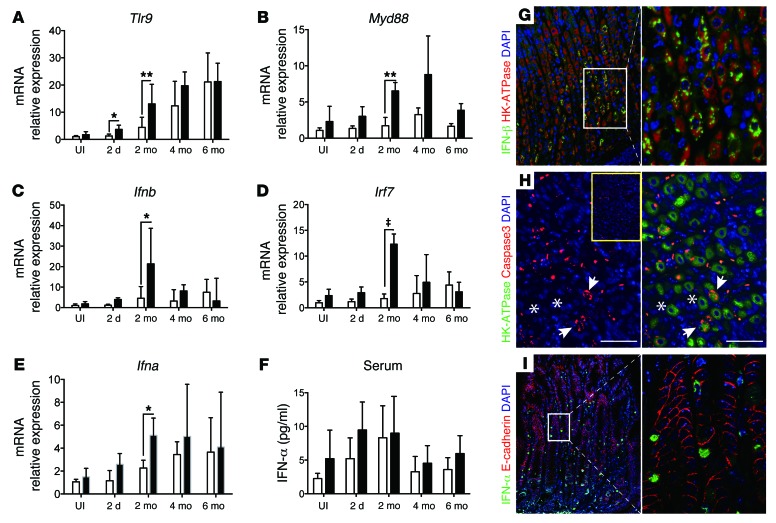
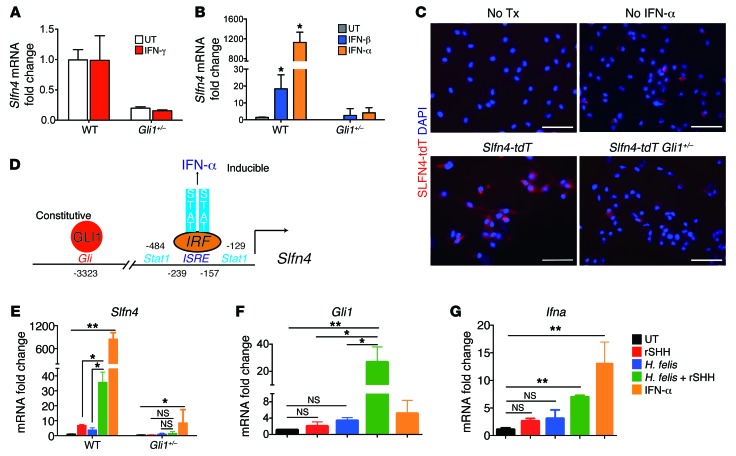
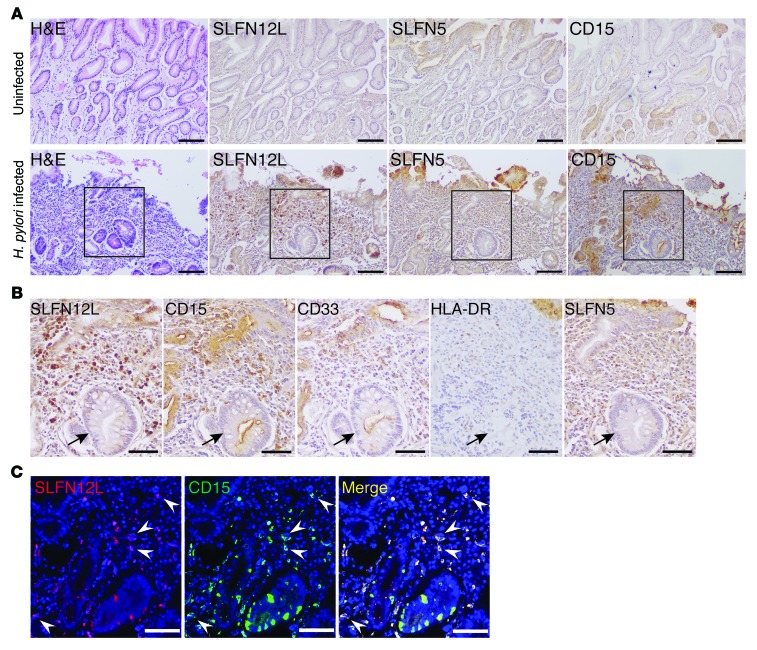
Chronic Helicobacter pylori infection triggers neoplastic transformation of the gastric mucosa in a small subset of patients, but the risk factors that induce progression to gastric metaplasia have not been identified. Prior to cancer development, the oxyntic gastric glands atrophy and are replaced by metaplastic cells in response to chronic gastritis. Previously, we identified schlafen 4 (Slfn4) as a GLI1 target gene and myeloid differentiation factor that correlates with spasmolytic polypeptide-expressing metaplasia (SPEM) in mice. Here, we tested the hypothesis that migration of SLFN4-expressing cells from the bone marrow to peripheral organs predicts preneoplastic changes in the gastric microenvironment. Lineage tracing in Helicobacter-infected Slfn4 reporter mice revealed that SLFN4+ cells migrated to the stomach, where they exhibited myeloid-derived suppressor cell (MDSC) markers and acquired the ability to inhibit T cell proliferation. SLFN4+ MDSCs were not observed in infected GLI1-deficient mice. Overexpression of sonic hedgehog ligand (SHH) in infected WT mice accelerated the appearance of SLFN4+ MDSCs in the gastric corpus. Similarly, in the stomachs of H. pylori-infected patients, the human SLFN4 ortholog SLFN12L colocalized to cells that expressed MDSC surface markers CD15+CD33+HLA-DRlo. Together, these results indicate that SLFN4 marks a GLI1-dependent population of MDSCs that predict a shift in the gastric mucosa to a metaplastic phenotype.


Figures

Figure 1
Figure 1. Bone marrow–derived cells are sufficient to induce SPEM with H. felis.
(A) Representative H&E images (n = 6) for each group as indicated with and without bone marrow transplant (BMT) (from Slfn4-CreERT2 Rosa26-LSL-tdTomato [Slfn4-tdT] mice) with and without H. felis infection (Hf). UI, uninfected. Scale bars: 50 μm. (B) Flow analysis of SLFN4-tdT+ or CD11b+ cells versus side scatter (SSC). The percentage of SLFN4+ or CD11b+ cells per mouse is shown in the representative histograms and plotted in the adjacent scatter graphs for n = 6 mice per group over 3 experiments. Horizontal lines represent the median and interquartile range. Significance was determined using Kruskal-Wallis ANOVA with Dunn’s test of multiple comparisons. *P < 0.05.
Figure 2
Figure 2. Elevated SHH levels accelerate H. felis–induced gastritis and SPEM development.
(A) Serum SHH levels in WT and pCMV-Shh mice infected with H. felis over 6 months. n = 5–10 mice per time point over 3 experiments. One-way ANOVA followed by Dunnett’s multiple comparisons test on log-transformed values was performed. P values are relative to UI; P < 0.001, #P < 0.0001. (B) Representative H&E images of gastric mucosa from WT and pCMV-Shh mice at the indicated times. Scale bars: 100 μm. Histologic scoring of gastric (C) PMN infiltration and (D) metaplasia for n = 8–10 mice per time point over 3 experiments. Kruskal-Wallis ANOVA with Dunn’s test of multiple comparisons was performed. *P < 0.05; horizontal lines represent the median and interquartile range. (E) Images of 4-month-infected gastric corpus stained with GSII lectin (green), clusterin (CLU, green), GIF (red), and H+-K+-ATPase (HK, white) in WT and pCMV-Shh mice. Scale bars: 50 μm. n = 5 mice per group for B and E.
Figure 3
Figure 3. SLFN4+ cells track to the stomach after H. felis infection.
(A) Schematic diagram of Slfn4-tdT (Slfn4-CreERT2 Rosa26-LSL-tdTomato) mice generated. (B) Protocol to lineage trace SLFN4-expressing cells from the bone marrow to peripheral organs. WT versus pCMV-Shh chimeric mice reconstituted with Slfn4-tdT bone marrow were treated with Tx 2 weeks prior to euthanization. Shown is the percentage of SLFN4+ cells in the (C) bone marrow, (D) spleen, and (E) corpus by flow cytometry, plotted as the median and interquartile range for n = 8–10 mice per group over 3 experiments. Kruskal-Wallis ANOVA with Dunn’s test of multiple comparisons was performed for CE; *P < 0.05. The corpus was analyzed for (F) Slfn4 mRNA by RT-qPCR and (G) tdT, SLFN4, and GAPDH protein by Western blot for n = 8–10 mice. One-way ANOVA followed by Tukey’s multiple comparisons test on log-transformed RT-qPCR values was performed for F; **P < 0.01. UT, untreated. (H) Representative images from n = 5 pCMV-Shh mouse corpora infected for 4 months showing SLFN4-tdT red+ cells with E-cadherin (green) and DAPI. Left: original magnification, ×200. White box region enlarged in the middle (tdT and DAPI) and right (DAPI only) panels (magnification, ×1,000). Asterisks indicate granulocytic nuclear morphology. (I) Giemsa stain of SLFN4-tdT+ cells sorted from n = 3 infected pCMV-Shh mouse stomachs (original magnification, ×600) showing granulocytic and monocytic cells enumerated per 100 cells. Black box indicates enlarged region (original magnification, ×1,000).
Figure 4
Figure 4. SLFN4+ cells from gastric corpus suppress T cell proliferation.
(A) SLFN4+ cells from bone marrow, spleen, and corpus were analyzed for Ly6G, Ly6C, and iNOS expression. Gated SLFN4+iNOS+ cells from the corpus were further analyzed for arginase I (ARG1). Median percentage (interquartile range) for each gated subpopulation shown in red for n = 4 mice per tissue. (B) Representative images from n = 4 mouse stomachs of SLFN4-tdT+ cells (red) colocalized with ARG1 (green) or iNOS (green). Scale bars: 20 μm. Asterisks indicate colocalization. (C) SLFN4+ cells were sorted from the indicated tissues of 3 pooled 4-month-infected infected pCMV-Shh mice and then cocultured with naive splenic T cells prestained with the CFSE dye. T cell proliferation was initiated with anti-CD3/CD28 microbeads cultured with or without SLFN4+ cells for 72 hours, and CFSE+ T cells were quantified by flow cytometry. The median percentage of proliferating T cells is shown in the representative histograms (nos. 1–6) plotted for n = 5 experiments in the scatter graph. Tregs (CD4+CD25+) from spleen were used as the positive control. Kruskal-Wallis ANOVA with Dunn’s test of multiple comparisons was performed. *P < 0.05.
Figure 5
Figure 5. Analysis of DAMP signaling components in H. felis–infected corpus.
Total RNA was extracted from H. felis–infected WT and pCMV-Shh corpus lysates and analyzed by RT-qPCR for (A) Tlr9, (B) Myd88, (C) Ifnb1, (D) Irf7, and (E) Ifna mRNA at the indicated time points, and then expressed as fold change relative to uninfected WT mice (UI). (F) Serum IFN-α levels determined by ELISA. Shown are the median and interquartile range for n = 8–10 mice per group over 3 experiments. One-way ANOVA followed by Tukey’s multiple comparisons test on log-transformed values was performed. *P < 0.05, **P < 0.01, P < 0.001. Immunofluorescence images for (G) IFN-β1 and (H) cleaved caspase-3 with H+-K+-ATPase (HK-ATPase) in the gastric corpus of 2-month H. felis–infected pCMV-Shh mice. Inset: Image of uninfected pCMV-Shh gastric corpus stained for cleaved caspase-3. Asterisks and arrows indicate nonapoptotic and apoptotic cells, respectively. G: left, original magnification, ×200; G, right, and H: magnification, ×400); (I) Images for IFN-α with E-cadherin in 4-month-infected pCMV-Shh mice. I, left: original magnification, ×200; I, right: magnification, ×600. White boxes indicate enlarged regions. Images in GI are representative of n = 3 mouse stomachs.
Figure 6
Figure 6. SHH synergizes with H. felis to stimulate Gli1 and Slfn4 in primary myeloid cells.
(A) Peritoneal myeloid cells from WT or Gli1+/– mice were treated with IFN-γ (800 U/ml), and Slfn4 mRNA was analyzed by RT-qPCR. (B) Slfn4 mRNA expression determined after treating peritoneal cells with IFN-α (800 U/ml) or IFN-β (200 ng/ml) for 24 hours. (C) Representative image of SLFN4-tdT+ cells visualized after culturing primary myeloid cells from Slfn4-tdT mice treated ex vivo with IFN-α but no Tx, Tx but no IFN-α, or Tx with IFN-α; or Slfn4-tdT+ Gli1+/– cells treated with Tx and IFN-α. Scale bars: 20 μm. Replicated with 3 mice per genotype. (D) Schematic of Slfn4 promoter, with GLI1 and IRF binding sites indicated. Primary peritoneal myeloid cells collected from WT or Gli1–/– mice were treated with recombinant mouse SHH ligand (rSHH), 100 CFU live H. felis, or both. (E) Slfn4 mRNA in WT and Gli1–/– cells; (F) Gli1 mRNA or (G) Ifna mRNA in WT primary myeloid cells. Shown for A and B and EG are the median and interquartile range for n = 3 experiments performed in triplicate per genotype. One-way ANOVA followed by Tukey’s multiple comparisons test on log-transformed values was performed. *P < 0.05, **P < 0.01.
Figure 7
Figure 7. SLFN12L and SLFN5 associated with Gr-MDSCs and intestinal metaplasia in human stomach.
(A) Representative images showing H&E and IHC for SLFN12L, SLFN5, and CD15 in stomach from n = 6 uninfected and n = 6 H. pylori–infected subjects with intestinal metaplasia. Scale bars: 100 μm. (B) Boxed region expanded in IHC for SLFN12L, CD15, CD33, HLA-DR, and SLFN5. Intestinal metaplastic glands are indicated (arrows). Scale bars: 50 μm. (C) Immunofluorescence images for SLFN12L (red) and CD15 (green). Arrowheads indicate colocalization. Scale bars: 50 μm.

Similar articles

Cited by

References

    1. Haenszel W, Correa P. Developments in the epidemiology of stomach cancer over the past decade. Cancer Res. 1975;35(11 pt 2):3452–3459. - PubMed
    1. Correa P. Gastric cancer: overview. Gastroenterol Clin North Am. 2013;42(2):211–217. doi: 10.1016/j.gtc.2013.01.002. - DOI - PMC - PubMed
    1. Fox JG, Wang TC. Inflammation, atrophy, and gastric cancer. J Clin Invest. 2007;117(1):60–69. doi: 10.1172/JCI30111. - DOI - PMC - PubMed
    1. Cancer Genome Atlas Research Network Comprehensive molecular characterization of gastric adenocarcinoma. Nature. 2014;513(7517):202–209. doi: 10.1038/nature13480. - DOI - PMC - PubMed
    1. El-Omar EM, et al. Interleukin-1 polymorphisms associated with increased risk of gastric cancer. Nature. 2000;404(6776):398–402. doi: 10.1038/35006081. - DOI - PubMed

MeSH terms