. 2016 Jul;20(7):400-14.
doi: 10.1089/omi.2016.0063.

Consensus Genome-Wide Expression Quantitative Trait Loci and Their Relationship with Human Complex Trait Disease

Affiliations

Consensus Genome-Wide Expression Quantitative Trait Loci and Their Relationship with Human Complex Trait Disease

Chen-Hsin Yu et al. OMICS. 2016 Jul.

Abstract

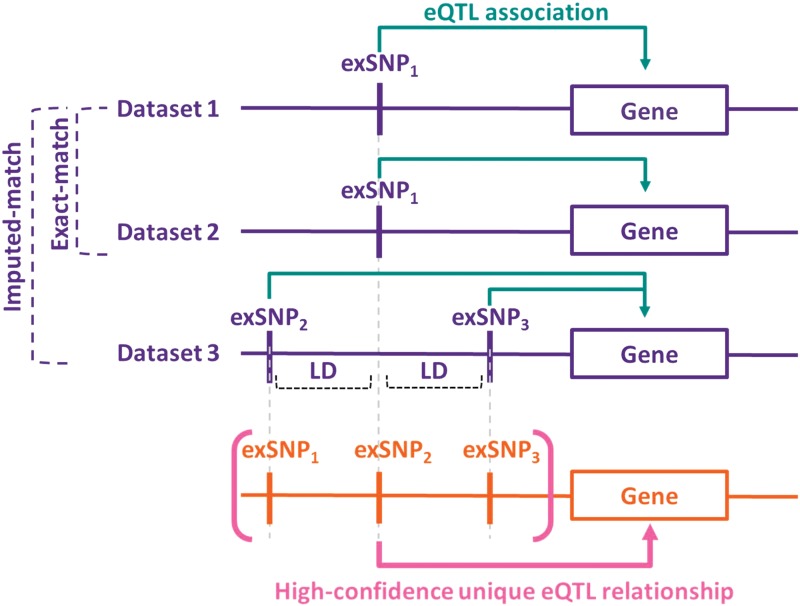
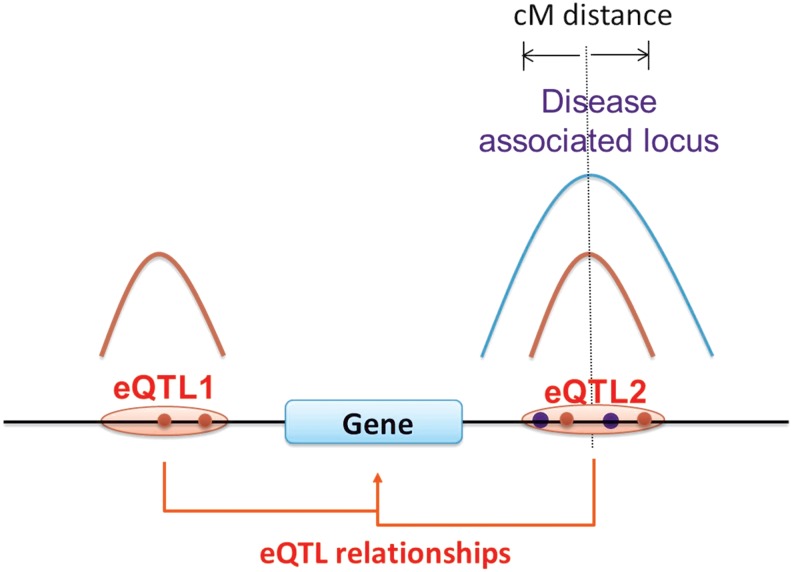
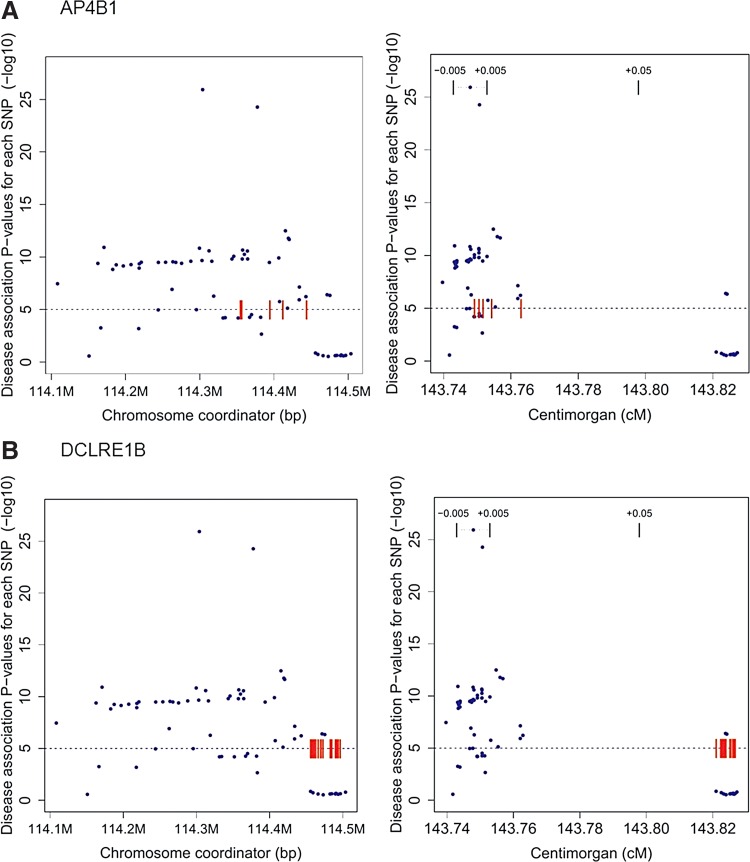
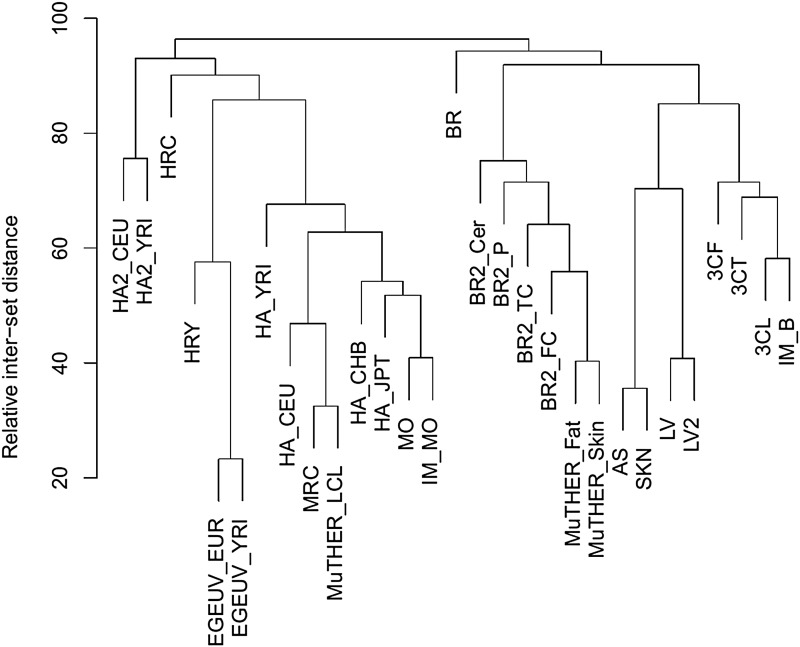
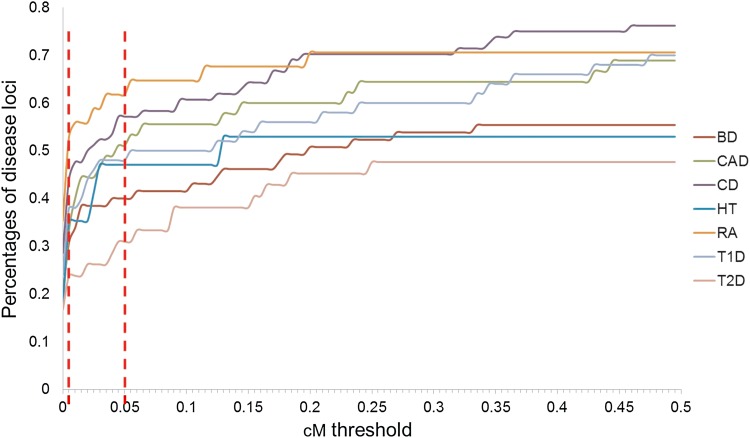
Most of the risk loci identified from genome-wide association (GWA) studies do not provide direct information on the biological basis of a disease or on the underlying mechanisms. Recent expression quantitative trait locus (eQTL) association studies have provided information on genetic factors associated with gene expression variation. These eQTLs might contribute to phenotype diversity and disease susceptibility, but interpretation is handicapped by low reproducibility of the expression results. To address this issue, we have generated a set of consensus eQTLs by integrating publicly available data for specific human populations and cell types. Overall, we find over 4000 genes that are involved in high-confidence eQTL relationships. To elucidate the role that eQTLs play in human common diseases, we matched the high-confidence eQTLs to a set of 335 disease risk loci identified from the Wellcome Trust Case Control Consortium GWA study and follow-up studies for 7 human complex trait diseases-bipolar disorder (BD), coronary artery disease (CAD), Crohn's disease (CD), hypertension (HT), rheumatoid arthritis (RA), type 1 diabetes (T1D), and type 2 diabetes (T2D). The results show that the data are consistent with ∼50% of these disease loci arising from an underlying expression change mechanism.


Figures

<b>FIG. 1.</b>
FIG. 1.
Identification of high-confidence unique eQTL relationships. A high-confidence eQTL relationship is defined as one found in two or more datasets. This figure illustrates the two ways, exact-match or imputed-match, used to determine consensus associations. Exact-match: In Dataset 1, the presence of an exSNP1 is associated with altered expression of the gene. Dataset 2 contains the exact same SNP-gene association, sufficient to classify the association as high confidence. Imputed-match: Dataset 3 has an association between two other SNPs, exSNP2 and exSNP3, and the expression level of the same gene. These SNPs are both in LD with exSNP1, so are considered to represent the same underlying relationship. eQTL, expression quantitative trait locus; LD, linkage disequilibrium; SNP, single-nucleotide polymorphism.
<b>FIG. 2.</b>
FIG. 2.
Model for identifying those disease-associated loci with a probable underlying expression mechanism. In this hypothetical case, a causal variant, at the position of the vertical dotted line, is related to disease susceptibility as a result of altering the expression level of the nearby gene. Because of LD, the presence of the causal variant will usually result in one or more nearby SNPs also being associated with disease risk, and the blue curve represents the expected p value distribution of these. Sparse sampling with a microarray and noise factors result in only one or a few of these associations being detected (blue dots). Since the causal variant affects expression, the same SNPs will be associated with expression level of the gene, with a colocated expected p value distribution, represented by the red curve, and again because of noise and other factors, only some markers will be identified (red dots). In this example, there is another eQTL in this region (eQTL1) where SNPs are associated with the expression level of the same gene, but unrelated to disease susceptibility, and so its eQTL p value distribution does not overlap with that for disease association.
<b>FIG. 3.</b>
FIG. 3.
Manhattan plots for a locus associated with type 1 diabetes in the WTCCC1 data. These plots show the relationship between disease association p value for all SNPs in the region (blue points) and the location of high-confidence expression-associated SNPs (red dashes). There are two separate high-confidence eQTL relationships in this region, each involving a different gene. The horizontal dotted line indicates the significance threshold for disease p values (1E-05). The left plots show the p value distribution of disease and expression SNPs as a function of chromosome coordinates and the right plots show the same data as a function of genetic map position, in cM. (A) Disease associations and high-confidence eQTL SNPs associated with the expression level of AP4B1 (adaptor-related protein complex 4, beta 1 subunit). In chromosome coordinates (left), the disease markers appear widely spread and there is no clear distinction between these and eQTL markers. On the cM scale (right), it is clear that the disease marker SNPs and eQTL SNPs occupy the same narrow range in the crossover coordinate. (B) High-confidence eQTL SNPs associated with DCLRE1B (DNA cross-link repair 1B) in the same locus. In chromosome coordinates (left), it is unclear whether these markers overlap with the disease markers or not. On the cM scale (right), there is clear separation between expression and disease markers, reflecting low linkage disequilibrium between the two sets of markers so that it is unlikely the same causal variant generates both signals. Together, these plots show that the data are consistent with a disease susceptibility causal variant affecting the expression of AP4B1 and inconsistent with an expression effect on DCLRE1B.
<b>FIG. 4.</b>
FIG. 4.
Hierarchical clustering of the fraction of common exGenes between pairs of eQTL datasets. Distance scale is based on the percentage of common exGenes between pairs of datasets.
<b>FIG. 5.</b>
FIG. 5.
Number of HC-exGenes with support from 1, 2, 3, … studies at various LD thresholds (R2) in the AllCell_AllPop integrated set.
<b>FIG. 6.</b>
FIG. 6.
Comparisons of fractions of common exGenes between pairs of eQTL datasets of the same cell type and pairs with different cell types for the MuTHER study. The blue bar shows the fractions of common exGenes between various LCL datasets and the MuTHER_LCL dataset. The red and green bars show the fractions of common exGenes between the other LCL datasets and the MuTHER_Fat and MuTHER_skin datasets, respectively. LCL, lymphoblastoid cell line.
<b>FIG. 7.</b>
FIG. 7.
Comparisons of fractions of common exGenes between pairs of eQTL datasets of the same cell type and pairs with different cell types for the 3C study. The blue bars show the fractions of common exGenes between the LCL datasets and the 3C_LCL dataset. The red and green bars show the fractions of common exGenes between the LCL datasets and the 3C_Fibroblast and 3C_T-cell datasets, respectively. In both sets of comparisons, there is evidence of limited tissue specificity.
<b>FIG. 8.</b>
FIG. 8.
Comparisons of the fraction of common exGenes between datasets in the same population versus datasets from different populations. The blue bars show the fractions of common exGenes between various Caucasian datasets in the HA_CEU dataset. The red bars are the fractions of common exGenes between the other Caucasian datasets and the HA_YRI dataset. The results indicate low population dependence of eQTLs.
<b>FIG. 9.</b>
FIG. 9.
Percentage of disease loci with possible expression mechanisms as a function of the cM distance between the closest disease and expression marker SNPs. The AllCell_AllPop eQTL set was used. Two vertical dotted lines indicate the cM thresholds, 0.005 and 0.05. The maximum threshold used in this study is 0.05 cM.

References

    1. Ardlie KG, Deluca DS, Segre AV, et al. (2015). The Genotype-Tissue Expression (GTEx) pilot analysis: Multitissue gene regulation in humans. Science 348, 648–660 - PMC - PubMed
    1. Barrett JC, Clayton DG, Concannon P, et al. (2009). Genome-wide association study and meta-analysis find that over 40 loci affect risk of type 1 diabetes. Nat Genet 41, 703–707 - PMC - PubMed
    1. Barrett JC, Hansoul S, Nicolae DL, et al. (2008). Genome-wide association defines more than 30 distinct susceptibility loci for Crohn's disease. Nat Genet 40, 955–562 - PMC - PubMed
    1. Bønnelykke K, Matheson MC, Pers TH, et al. (2013). Meta-analysis of genome-wide association studies identifies ten loci influencing allergic sensitization. Nat Genet 45, 902–906 - PMC - PubMed
    1. Cho YS, Chen C-H, Hu C, et al. (2012). Meta-analysis of genome-wide association studies identifies eight new loci for type 2 diabetes in East Asians. Nat Genet 44, 67–72 - PMC - PubMed

Publication types

MeSH terms

LinkOut - more resources