

"Omics" Prospective Monitoring of Bariatric Surgery: Roux-En-Y Gastric Bypass Outcomes Using Mixed-Meal Tolerance Test and Time-Resolved (1)H NMR-Based Metabolomics
- PMID: 27428253
- PMCID: PMC4960496
- DOI: 10.1089/omi.2016.0061
"Omics" Prospective Monitoring of Bariatric Surgery: Roux-En-Y Gastric Bypass Outcomes Using Mixed-Meal Tolerance Test and Time-Resolved (1)H NMR-Based Metabolomics
Abstract
Roux-en-Y gastric bypass (RYGB) surgery goes beyond weight loss to induce early beneficial hormonal changes that favor glycemic control. In this prospective study, ten obese subjects diagnosed with type 2 diabetes underwent bariatric surgery. Mixed-meal tolerance test was performed before and 12 months after RYGB, and the outcomes were investigated by a time-resolved hydrogen nuclear magnetic resonance ((1)H NMR)-based metabolomics. To the best of our knowledge, no previous omics-driven study has used time-resolved (1)H NMR-based metabolomics to investigate bariatric surgery outcomes. Our results presented here show a significant decrease in glucose levels after bariatric surgery (from 159.80 ± 61.43 to 100.00 ± 22.94 mg/dL), demonstrating type 2 diabetes remission (p < 0.05). The metabolic profile indicated lower levels of lactate, alanine, and branched chain amino acids for the operated subject at fasting state after the surgery. However, soon after food ingestion, the levels of these metabolites increased faster in operated than in nonoperated subjects. The lipoprotein profile achieved before and after RYGB at fasting was also significantly different, but converging 180 min after food ingestion. For example, the very low-density lipoprotein, low-density lipoprotein, N-acetyl-glycoproteins, and unsaturated lipid levels decreased after RYGB, while phosphatidylcholine and high-density lipoprotein increased. This study provides important insights on RYGB surgery and attendant type 2 diabetes outcomes using an "omics" systems science approach. Further research on metabolomic correlates of RYGB surgery in larger study samples is called for.
Figures
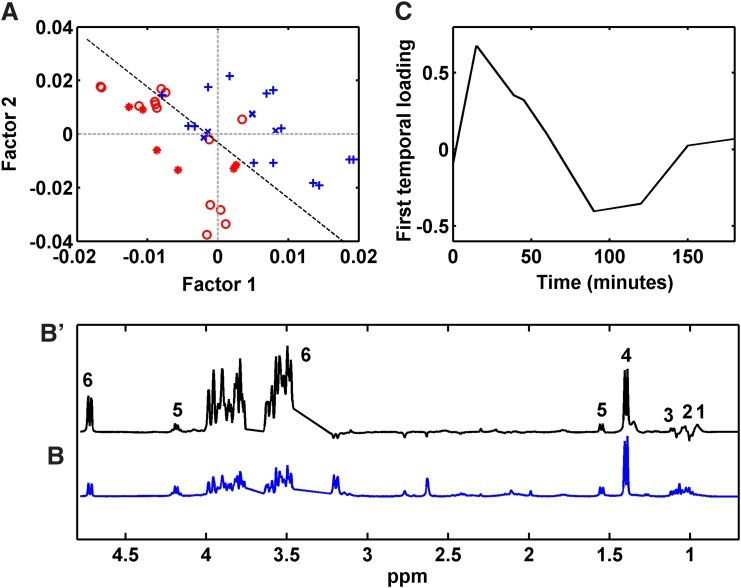
 ) after RYGB. Validation samples from patients (x) before and (
 ) after RYGB. NPLS-DA, N-way partial least squares discriminant analysis.
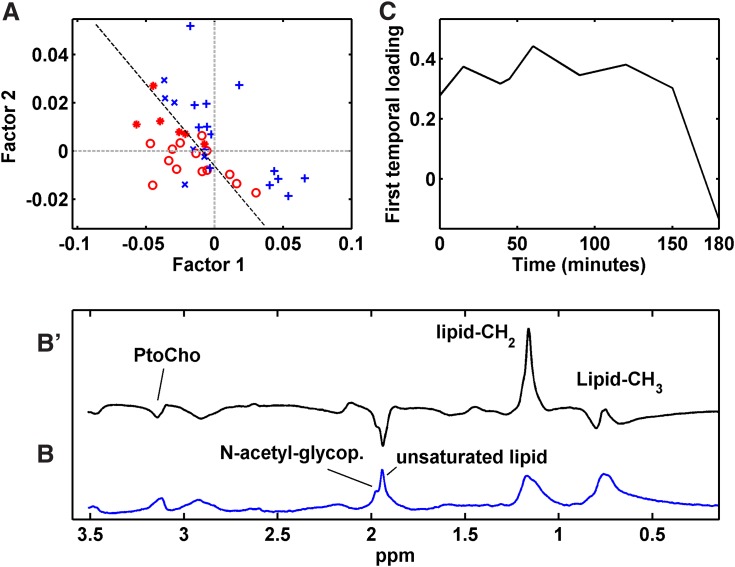 ) after RYGB. Validation samples from patients (x) before and () after RYGB. PtoCho, phosphatidylcholine.
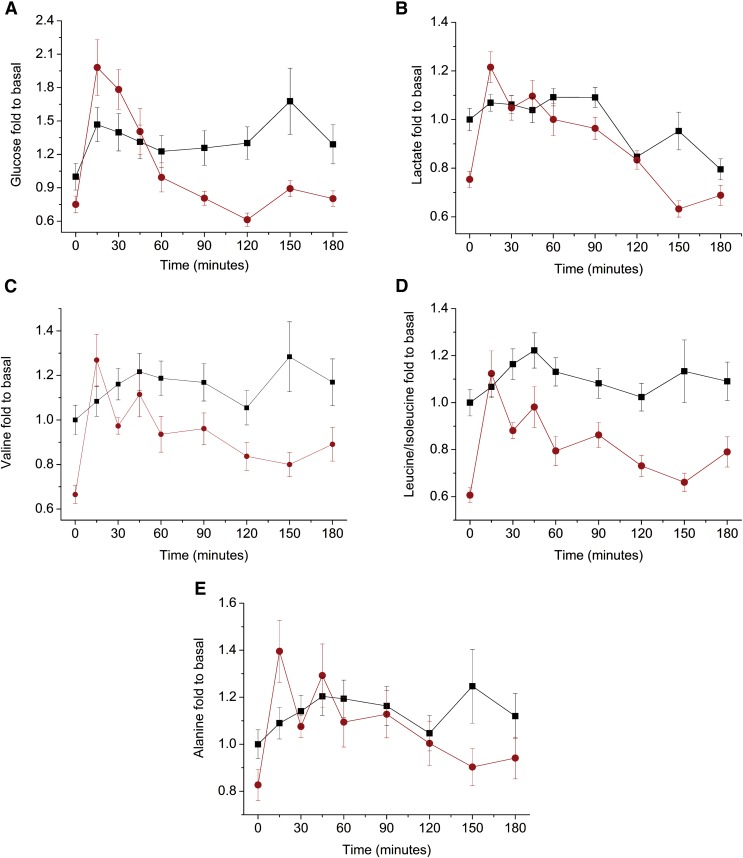
 ) after RYGB.
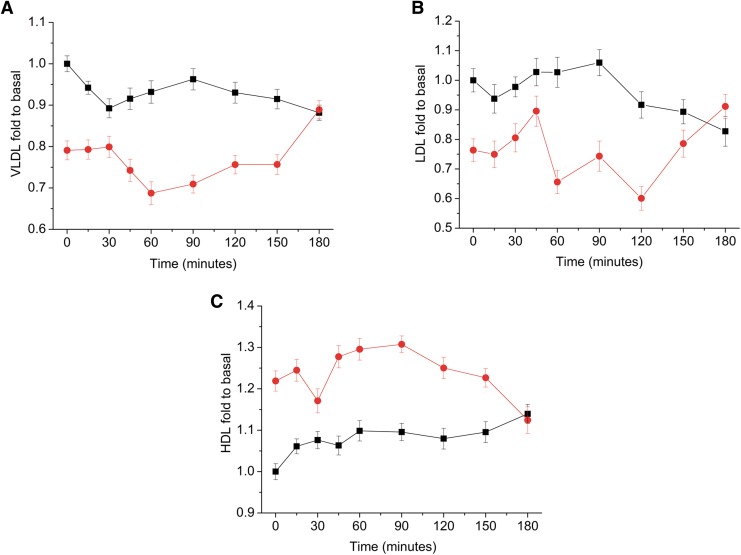 ) after RYGB. HDL, high-density lipoprotein; LDL, low-density lipoprotein; VLDL, very low-density lipoprotein.
References
-
- Andersson CA, and Bro R. (2000). The N-way Toolbox for MATLAB. Chemometr Intell Lab Syst 52, 1–4
-
- Barding GA, Salditos R, and Larive CK. (2012). Quantitative NMR for bioanalysis and metabolomics. Anal Bioanal Chem 404, 1165–1179 - PubMed
-
- Bell JD, Brown JC, Nicholson JK, and Sadler PJ. (1987). Assignment of resonances for ‘acutephase’ glycoproteins in high resolution proton NMR spectra of human blood plasma. FEBS Lett 215, 311–315 - PubMed
-
- Bro R. (1996). Multiway calibration: multilinear PLS. J Chemometrics 10, 47–61
-
- Bruce DM, and Mitchell AL. (2015). Surgery for obesity. Medicine 43, 101–103
Publication types
MeSH terms
LinkOut - more resources
Full Text Sources
Other Literature Sources
Medical
Research Materials
