. 2016 Jun:8:132-149.
doi: 10.1016/j.ebiom.2016.04.037. Epub 2016 May 1.

A Nexus Consisting of Beta-Catenin and Stat3 Attenuates BRAF Inhibitor Efficacy and Mediates Acquired Resistance to Vemurafenib

Affiliations

A Nexus Consisting of Beta-Catenin and Stat3 Attenuates BRAF Inhibitor Efficacy and Mediates Acquired Resistance to Vemurafenib

Tobias Sinnberg et al. EBioMedicine. 2016 Jun.

Abstract

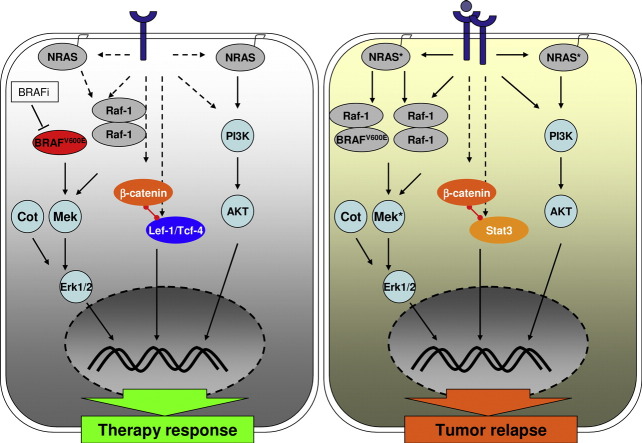
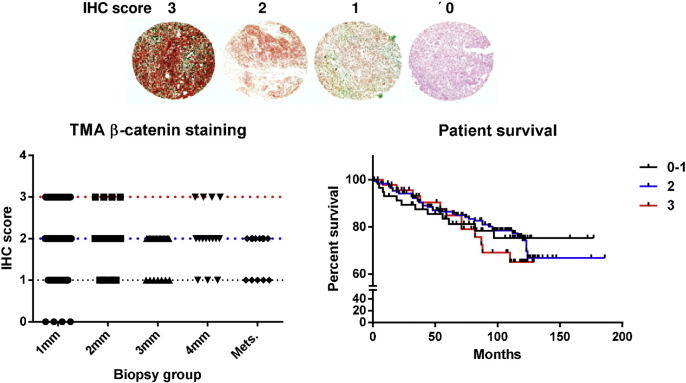
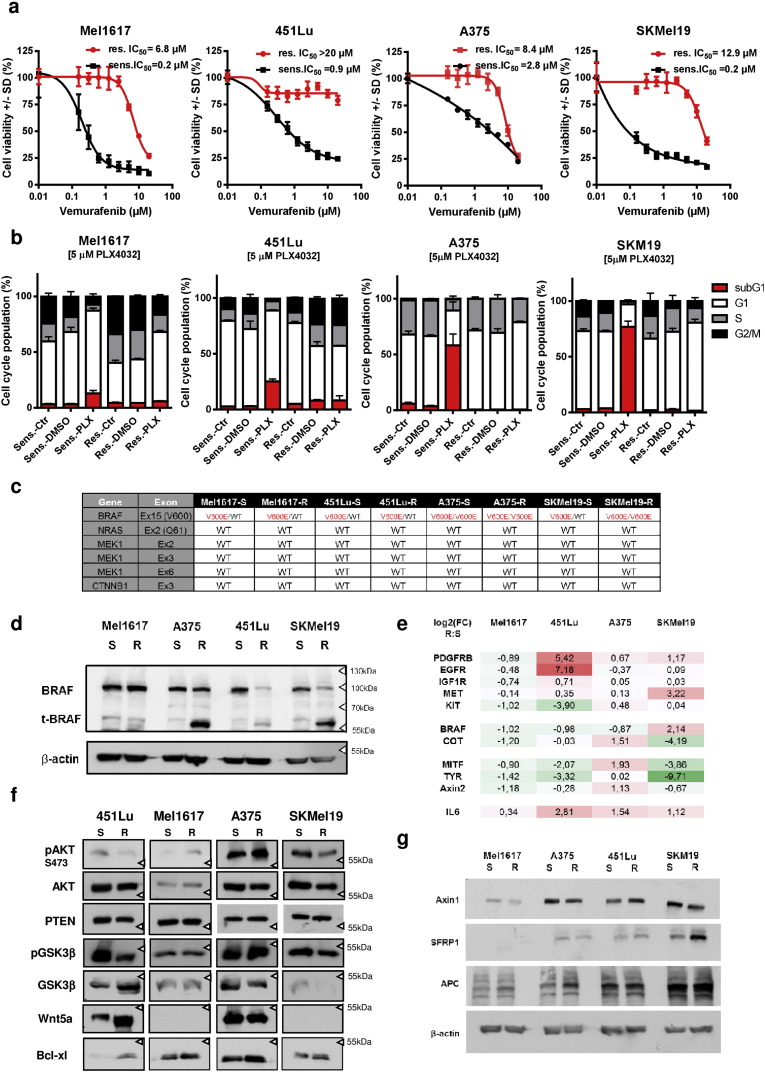
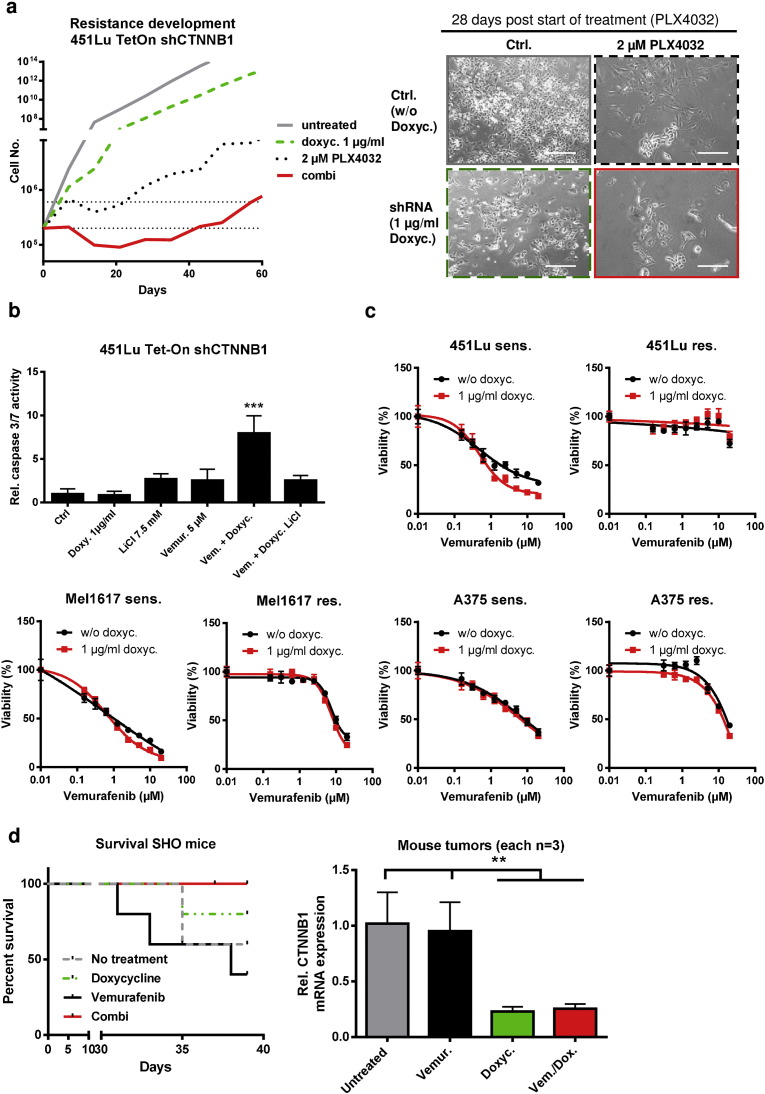
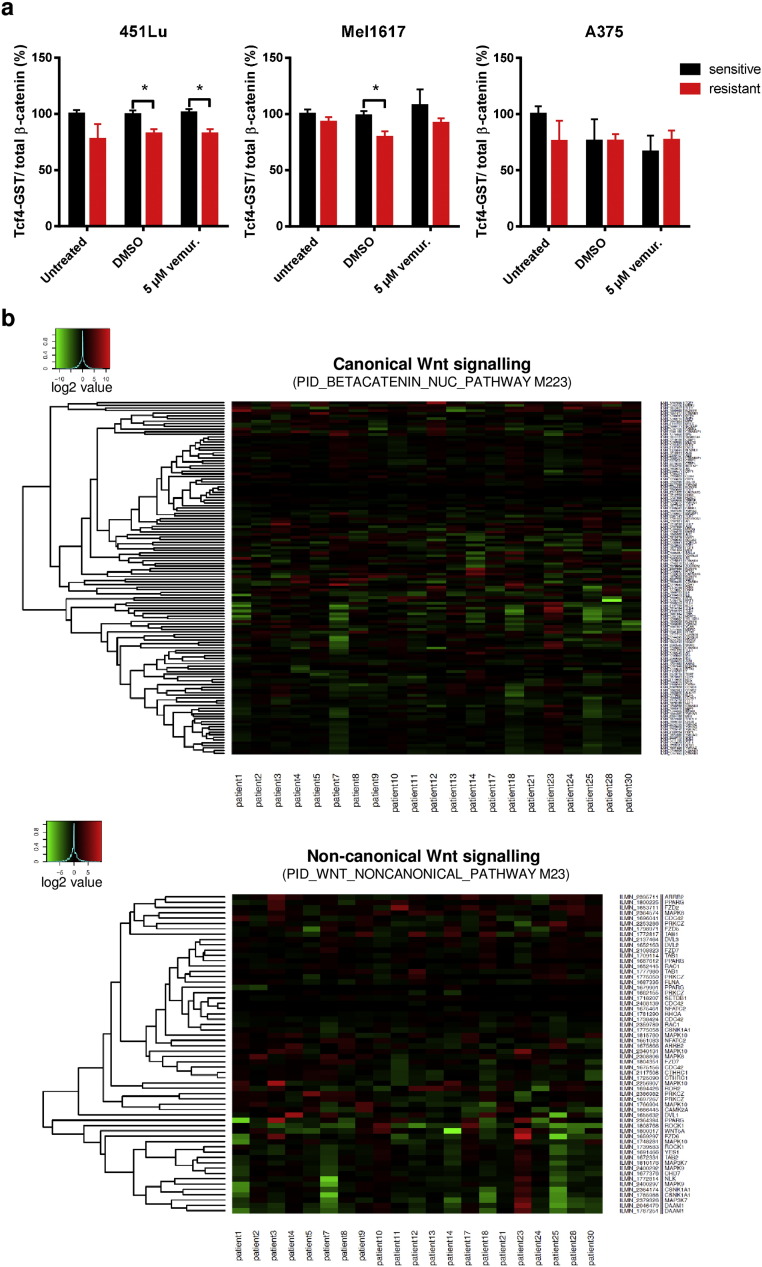
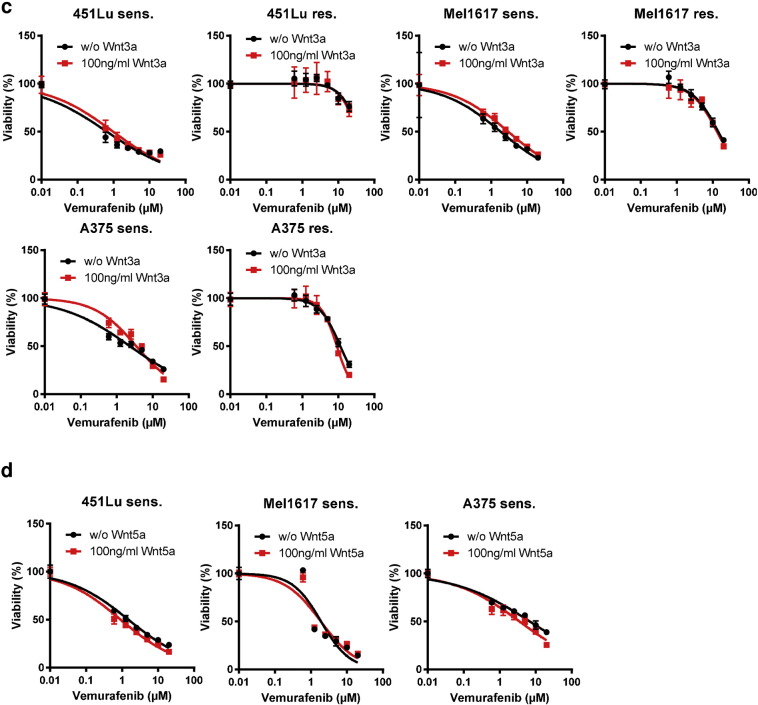
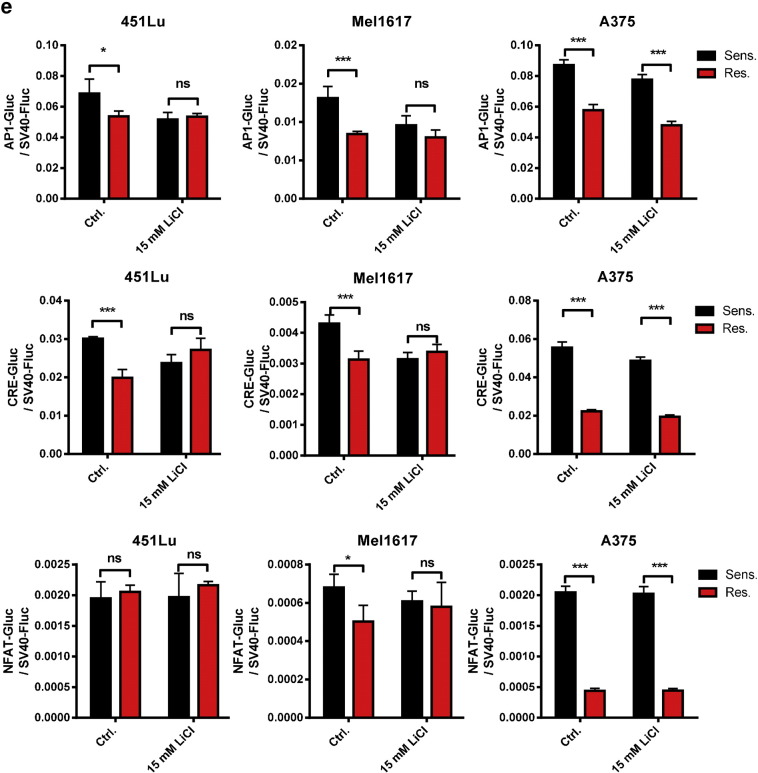
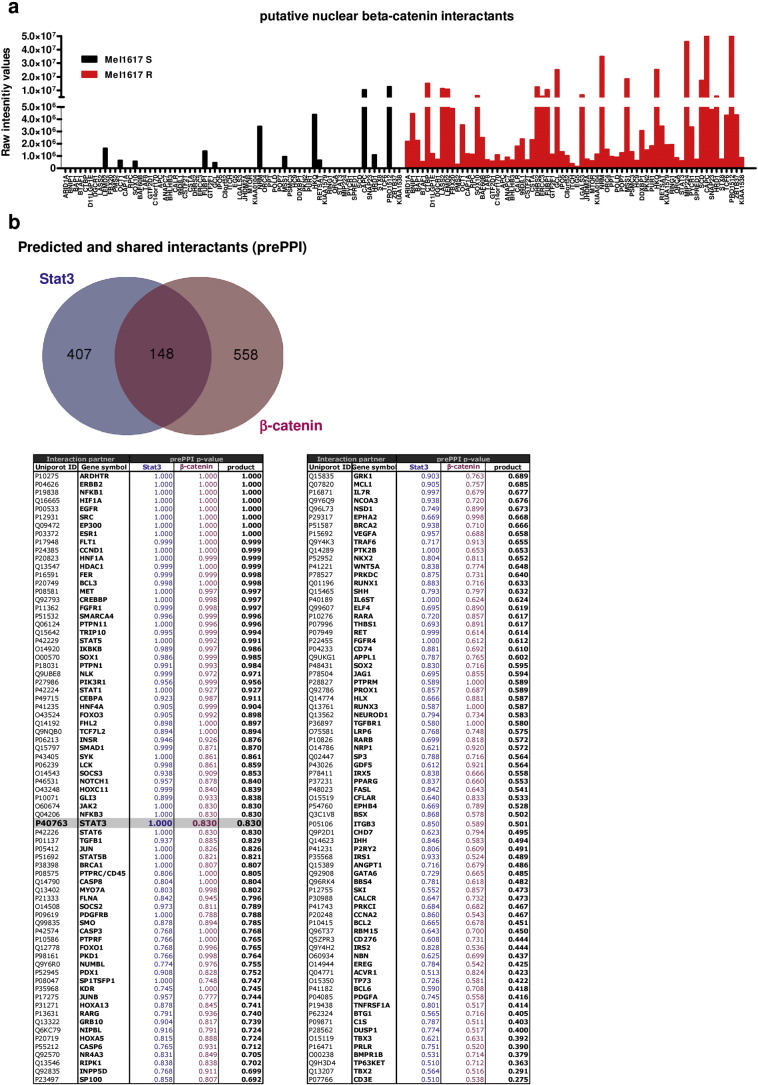
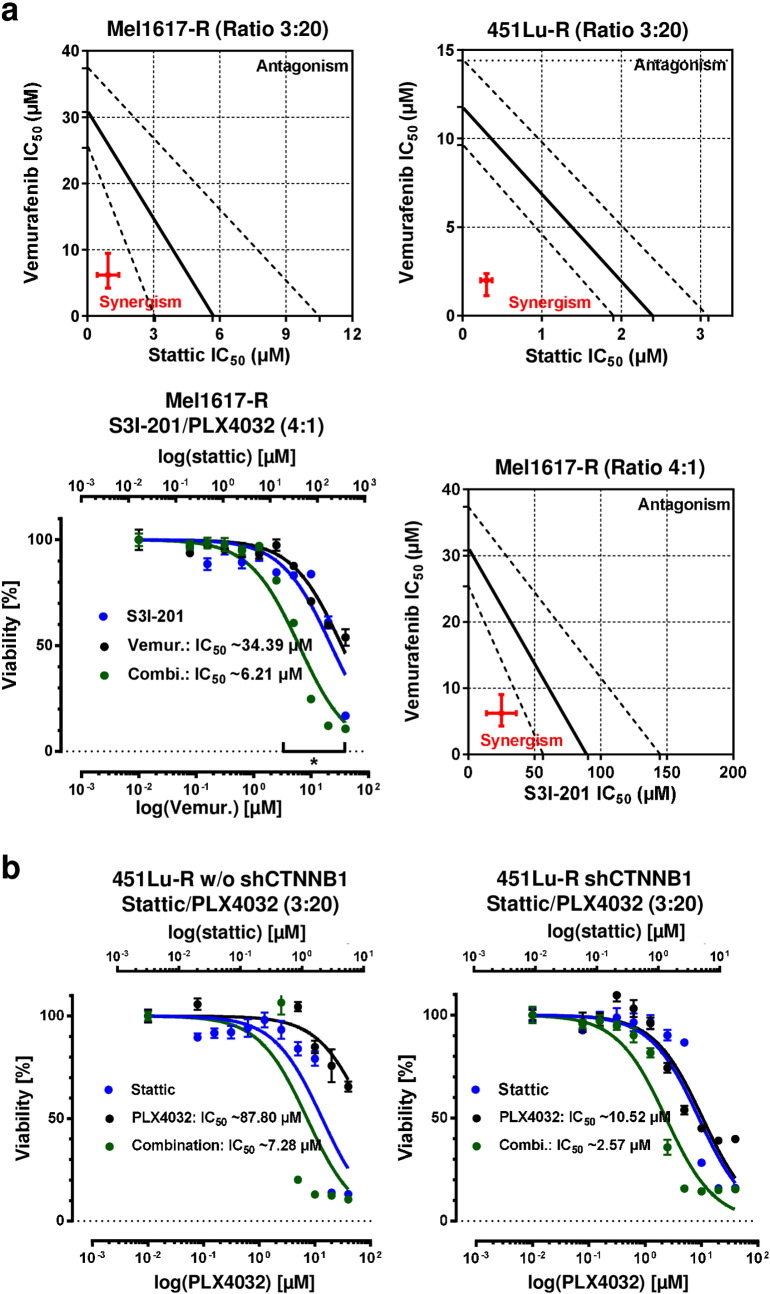
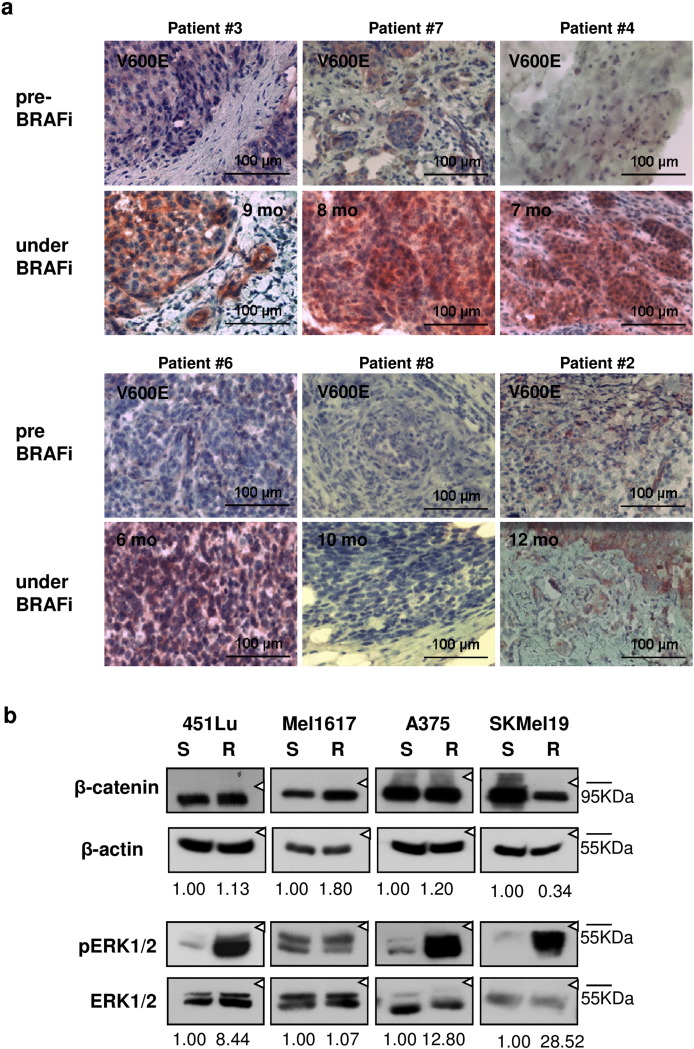
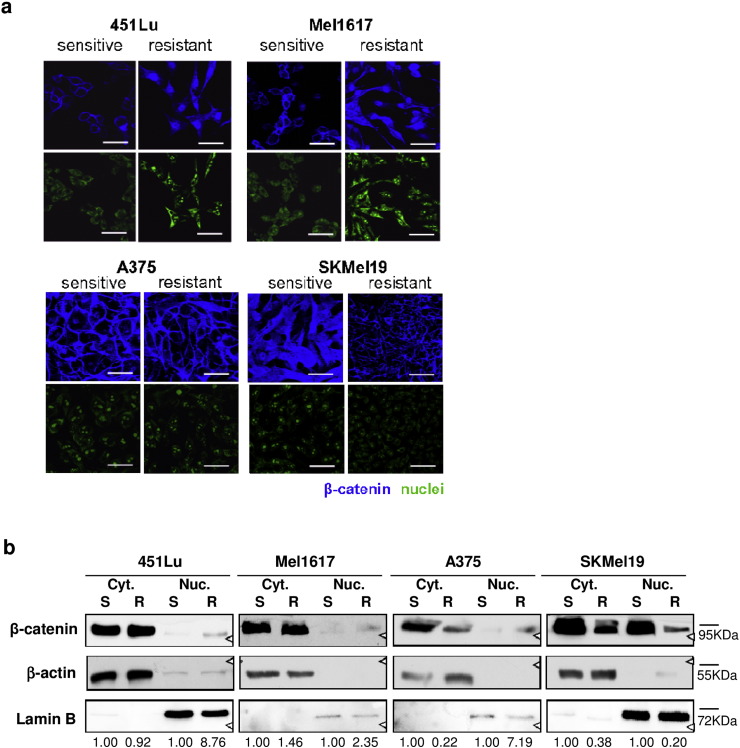
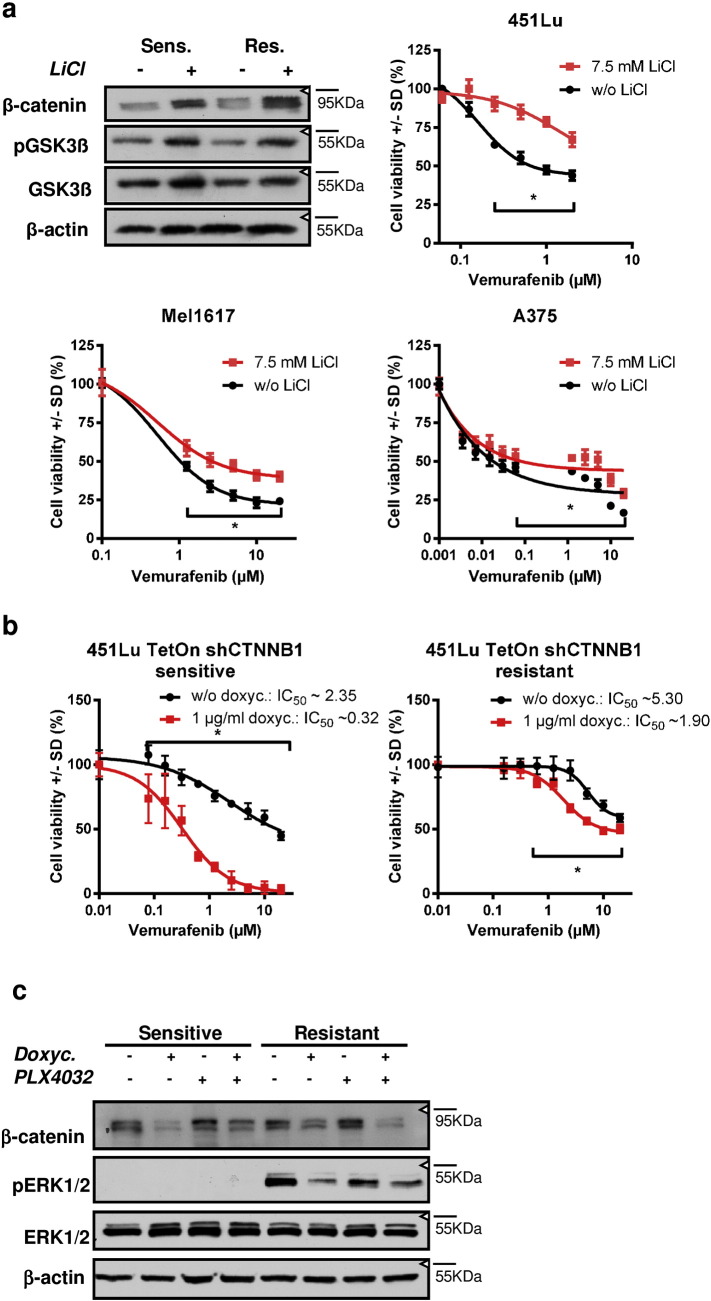
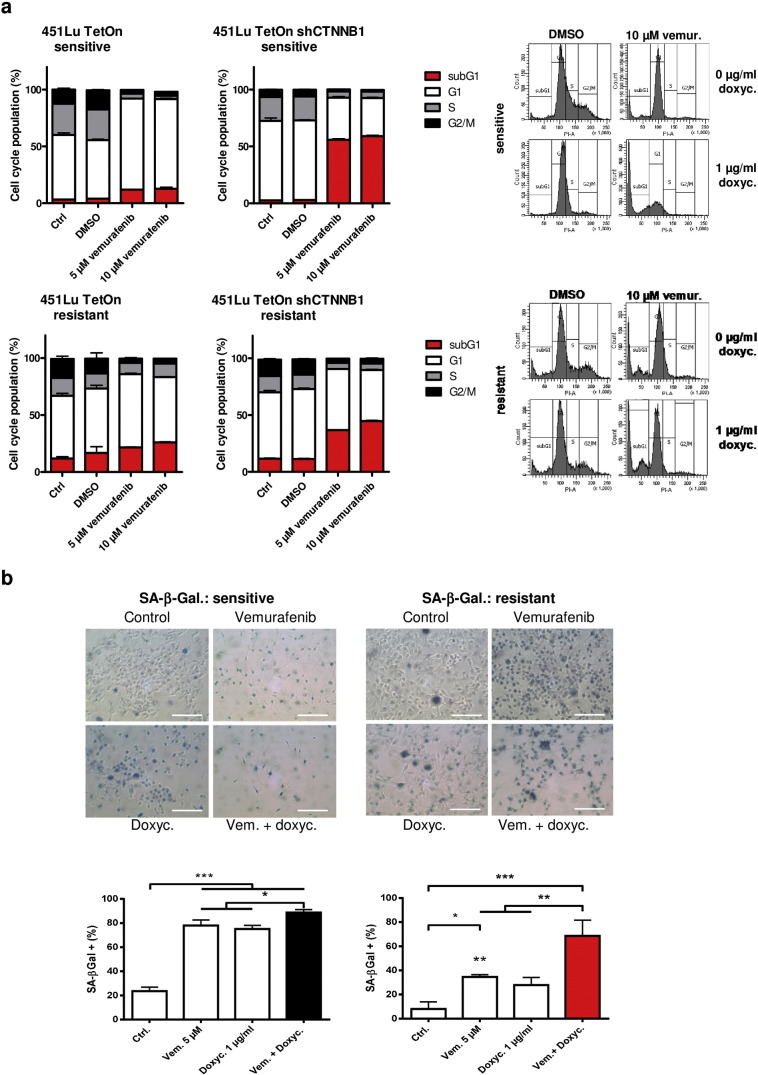
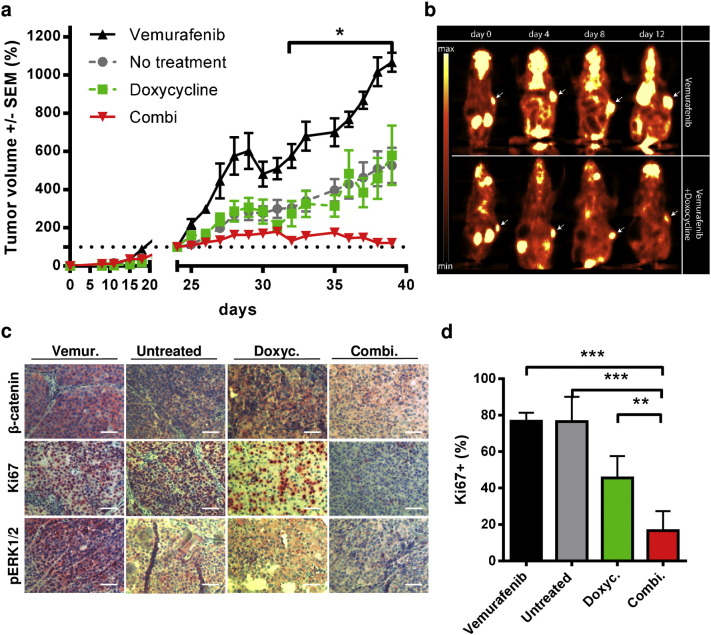
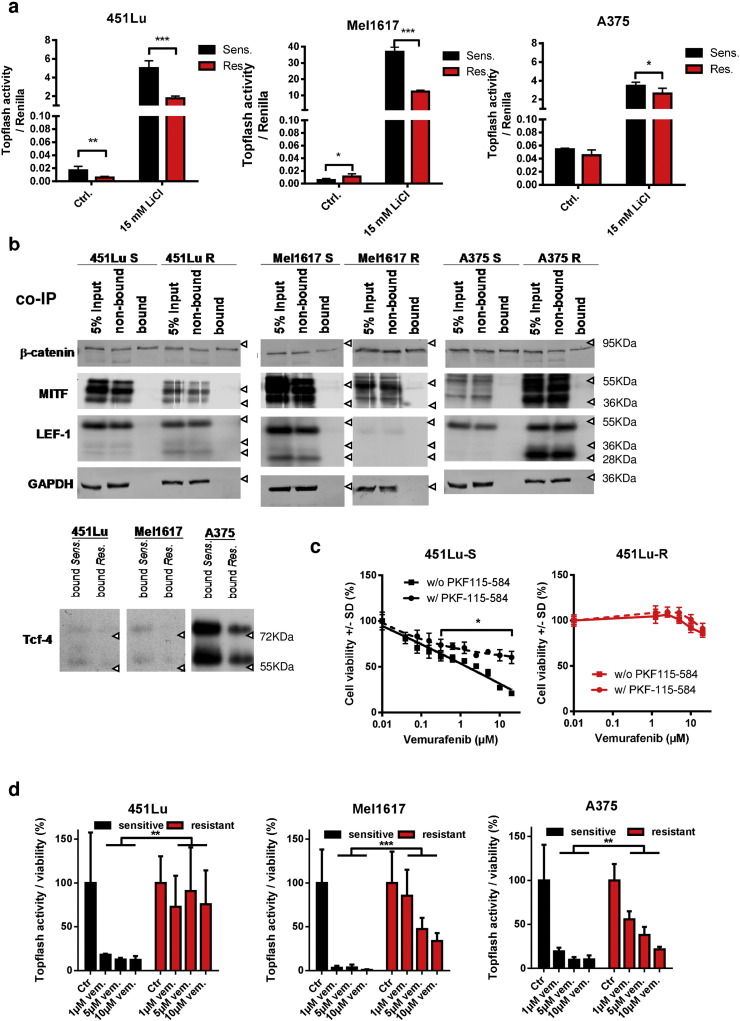
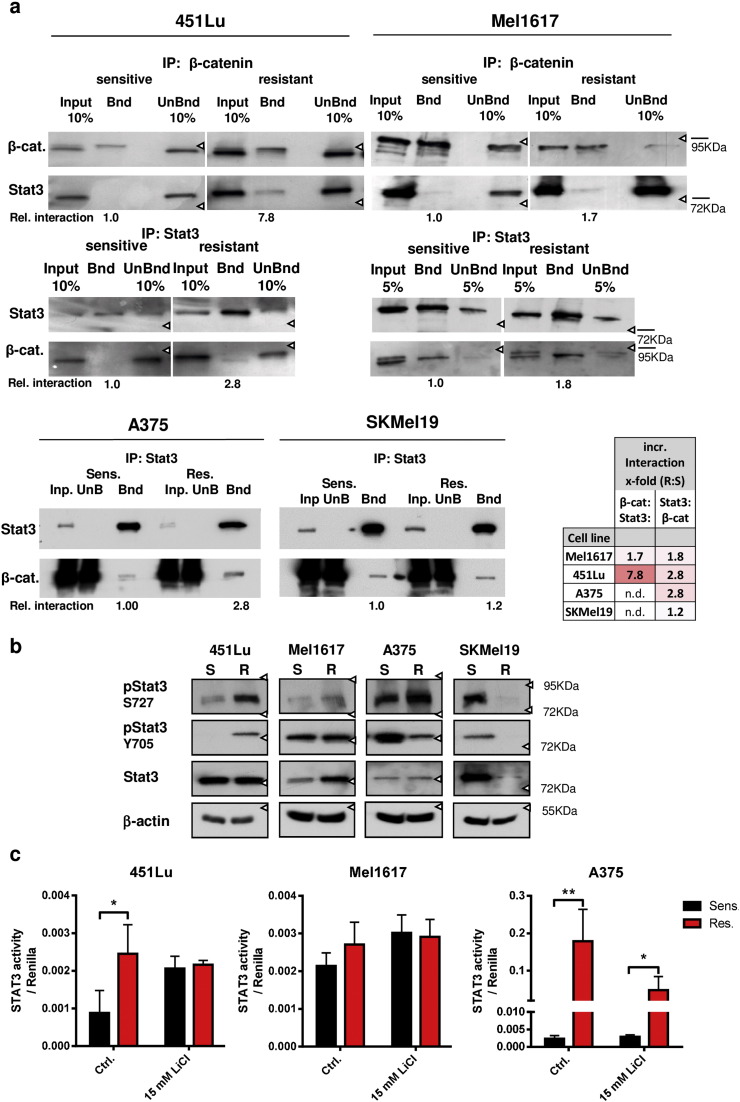
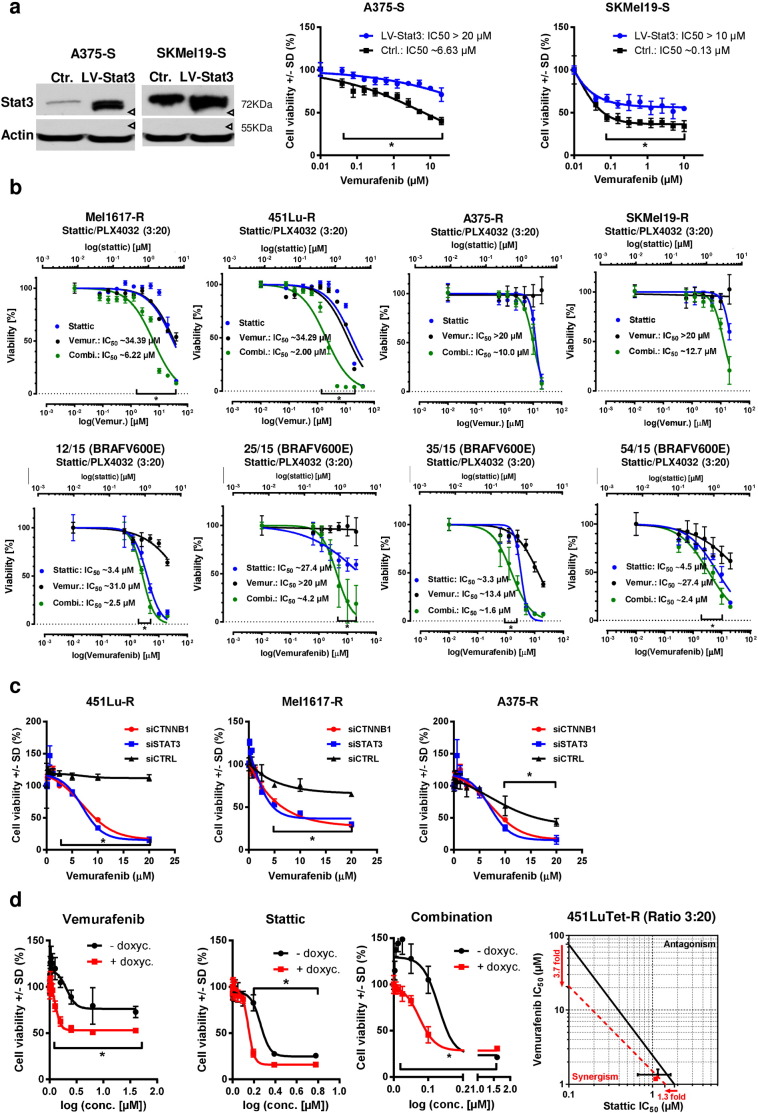
Acquired resistance to second generation BRAF inhibitors (BRAFis), like vemurafenib is limiting the benefits of long term targeted therapy for patients with malignant melanomas that harbor BRAF V600 mutations. Since many resistance mechanisms have been described, most of them causing a hyperactivation of the MAPK- or PI3K/AKT signaling pathways, one potential strategy to overcome BRAFi resistance in melanoma cells would be to target important common signaling nodes. Known factors that cause secondary resistance include the overexpression of receptor tyrosine kinases (RTKs), alternative splicing of BRAF or the occurrence of novel mutations in MEK1 or NRAS. In this study we show that β-catenin is stabilized and translocated to the nucleus in approximately half of the melanomas that were analyzed and which developed secondary resistance towards BRAFi. We further demonstrate that β-catenin is involved in the mediation of resistance towards vemurafenib in vitro and in vivo. Unexpectedly, β-catenin acts mainly independent of the TCF/LEF dependent canonical Wnt-signaling pathway in resistance development, which partly explains previous contradictory results about the role of β-catenin in melanoma progression and therapy resistance. We further demonstrate that β-catenin interacts with Stat3 after chronic vemurafenib treatment and both together cooperate in the acquisition and maintenance of resistance towards BRAFi.

  1. Melanoma cells with acquired resistance frequently express high amounts of β-catenin.

  2. In these cells a hyper-activation of Stat3 co-occurs leading to an interaction with β-catenin.

  3. Such BRAFi resistant melanoma cells are sensitive to knockdown of β-catenin and Stat3 or pharmacologic Stat3 inhibition.

Treatment with BRAF inhibitors is the basis of the standard therapy for melanoma patients with BRAFV600 mutated metastases. Although this therapy achieves impressive short-term benefit, many patients suffer from relapse after several months of treatment even if the therapy is combined with MEK inhibitors. The development of therapy resistant tumor cells is a multifactorial transformation and several cellular mechanisms are already described. Here, we found an interaction of two well-known tumor-associated proteins, namely β-catenin and Stat3 in resistant metastatic melanoma cells. Patient data support that these proteins are involved in the resistance to BRAF inhibitor therapy.

Keywords: BRAF; Melanoma; Resistance; Stat3; Vemurafenib; β-catenin.


Figures

Image 1
Graphical abstract
Fig. 1
Supplementary Fig. 1
Beta-catenin IHC of a tissue microarray containing 270 melanoma biopsies. The slide was stained using a β-catenin specific antibody (Cell Signaling #9562 1:100). Staining intensities (IHC score) were judged by two experimenters from 0 (= absent) to 3(= strong) and grouped according tumor thickness and metastases. Kaplan Meier analysis was done using primary tumor data.
Fig. 2
Supplementary Fig. 2
Increased resistance of melanoma cell lines after chronic treatment with 2 μM PLX4032 (vemurafenib). a) Cell viability assays (MUH) were performed after 72 h of treatment with increasing concentrations of vemurafenib. Black data points show the parental sensitive cells, red data points show the corresponding resistant cells. Assays were performed in sixtuplicates and data were normalized to the untreated control, mean values +/− SD are shown with the calculated IC50 values vemurafenib. b) Cell cycle analysis of the sensitive and resistant melanoma cell lines using propidium iodide staining. c) Mutation analysis of hotspot mutations in the four cell line pairs Mel167, 451Lu, A375 and SKMel19 for BRAF, NRAS, CTNNB1 and MEK1. d) Western blot to detect the expression levels of BRAF in the four cell lines together with truncated splice variants of BRAF. e) Transcript expression (real-time qPCR) of genes known to be involved in resistance mechanisms and target genes of Wnt-/β-catenin signaling (MITF and TYR) and Stat3 (IL6). f) Immunoblots corresponding to Fig. 1 with additional signaling proteins. g) Immunoblots showing the expression of regulators of β-catenin expression (APC, Sfrp1, Axin-1) in the four cell line pairs.
Fig. 3
Supplementary Fig. 3
Beta-catenin is critically involved in the development of resistance to BRAFi. a) 451Lu-TetOn-shCTNNB1 cells were used for chronic treatment with 2 μM vemurafenib (1 μM during the first week) either in the presence (green and red curves) or absence (grey and black curves) of doxycyline (1 μg/ml doxycycline) and cell numbers were weekly counted by automated cell counting and viability assessment (CASY). Knockdown of β-catenin increased the time by approx. 2.5 fold until cell numbers exceeded the cell numbers of the maximum cell number in the first week. Morphology of the treated cells is shown after four weeks of cultivation with the indicated four different treatments (scale bar is 200 μm). b) The significantly (p < 0.001) increased caspase3/7 activation (DEVD-AMC as caspase 3/7 substrate) after 48 h post knockdown of β-catenin with combined BRAF inhibition can be blocked by β-catenin stablilization using a 6 hour pre-incubation with 7.5 mM LiCl. c) Control experiment to show that doxycyline treatment (1 μg/ml) without shCTNNB1 induction has no impact at the susceptibility of the indicated sensitive and resistant melanoma cell lines to increasing concentrations of vemurafenib using the MUH cell viability assay. Cells were treated for 72 h with vemurafenib after a pre-treatment for 24 h with the antibiotic. d) Kaplan–Meier-survival curves (left panel) showing the survival data of the SHO mice from Fig. 2. Black curve: vemurafenib 25 mg/kg i.p. treated mice (n = 5), grey curve: untreated mice (n = 5), green curve: doxycycline 1 mg/ml p.o. (n = 5), red curve: doxycycline 1 mg/ml p.o. plus vemurafenib 25 mg/kg i.p. (n = 5). Bar diagram (right panel) shows the significant extent of CTNNB1 down-regulation after in vivo shRNA induction with 1 μg/ml doxycycline in the drinking water of SHO mice compared to untreated or vemurafenib (mono-therapy) treated mice (p < 0.01; each n = 3). mRNA expression was measured using SYBR-green qPCR.
Fig. 4
Supplementary Fig. 4
Wnt signaling is not majorly involved in resistance mechanisms to BRAFi. a) Bead-based GST-pull-down assay of “free” β-catenin using GST-tagged TCF4. Samples were prepared in triplicates after cultivation under the indicated conditions for 24 h. Signals were normalized to the total amount of β-catenin measured by a bead-based sandwich immunoassay and compared to the untreated controls. b) Heatmap of mRNA expression analysis using the Illumina beadchip-based microarray dataset GSE50509 dealing with 21 pairs of samples from melanoma patients treated with BRAFi33. Fold changes in gene expression of BRAFi treated and matched pre-treatment tumors were calculated for each patient using log2 transformed and RMA normalized signal intensities. Exemplarily the gene sets M223 (canonical Wnt signaling) and M31 (non-canonical Wnt signaling) from the Gene set enrichment analysis (GSEA) tool from the Broad Institute is shown which shows nuclear β-catenin signaling and target gene transcription. c) Cell viability assay of cells pre-treated with Wnt3a (100 ng/ml) before treatment with vemurafenib for 72 h reveals no effect of Wnt3a stimulation. After the pre-treatment, cells were re-stimulated with fresh Wnt3a when the BRAFi treatment was started. Black data represent unstimulated cells, red data show Wnt3a treated cells. d) Sensitive 451Lu-S, Mel1617-S and A375-S cells were pre-treated with Wnt5a (100ng/ml) and re-stimulated after 24 h. Vemurafenib treatment was applied for 72 h before measurement of the cell viability (MUH). No differences in susceptibility to BRAFi were found after treatment with Wnt3a or Wnt5a. e) Three different Gluc-reporter systems (AP1-Gluc, CRE-Gluc, NFAT-Gluc) were used to assay the non-canonical Wnt signaling activity in the sensitive and resistant versions of 451Lu, Mel1617 and A375 melanoma cells. After transfection with the reporter plasmids cells were treated for 24 h with 15 mM LiCl for stabilizing β-catenin. Secreted gaussia luciferase activity was measured and normalized to cytoplasmic firefly luciferase activity from a co-transfected SV40-fluc control plasmid. Assays were performed in sixtuplicates. Mean values and standard deviations of sixtuplicates are presented. Multiple t-tests with Holm–Šídák correction were used to compare data of sensitive and resistant samples and p < 0.05 was considered as significant (asterisk).
Fig. 5
Supplementary Fig. 5
Novel Interaction partners of β-catenin in BRAFi resistant melanoma cells. a) Mel1617-S and -R cells were used for preparing nuclear enriched lysates in RIPA buffer before performing an immunoprecipitation with 500 μg of lysate and β-catenin specific antibody. LC-MS/MS analysis was performed using the co-precipitated and trypsin digested proteins. In Mel1617-R cells highly enriched and nuclear localized candidates for interaction with β-catenin were selected using DAVID and the raw intensity values plotted to compare the interaction in sensitive (black) versus resistant (red) Mel1617 melanoma cells. b) An in silico interactome analysis of β-catenin and Stat3 interaction partners was carried out using prePPI58. 148 putative shared interaction partners of β-catenin and Stat3 (Venn diagram) were found with a (prePPI-) p-value > 0.5 and sorted according their p-value products. A direct interaction of β-catenin with Stat3 was calculated with the probability p = 0.83.
Fig. 6
Supplementary Fig. 6
Isobolograms and dose response curves of BRAFi resistant melanoma cell lines with combined Stat3 and BRAF inhibition. a) Isobologram analysis for Mel1617-R and 451Lu-R cells using the data of Fig. 7b. Calculated IC50 values including their 95% confidence interval (red symbols) were used for synergism analysis and isobologram plotting. Dose response curves of Mel1617-R cells treated with the Stat3 inhibitor S3I-201 (blue curve), vemurafenib (black curves) and the combination (green curves) are shown in the diagram at the lower left. Cells were treated with the inhibitors in ascending concentrations using the indicated STAT3i to BRAFi ratio (4:1) of the combined drugs. 72 h after treatment cell viablitiy was assessed in quintuplicates. The top x-axes represent the concentrations of S3I-201 and the bottom x-axes represent the concentrations of vemurafenib. Mean +/− SD values are shown. Multiple t-tests with Holm–Šídák correction were used to compare data points of the curves and p < 0.05 was considered as significant (asterisk). F-test revealed a significant different IC50 of the fitted curves. b) Diagrams show dose response curves of 451Lu Tet-R cells doubly treated with Stattic (upper x-axes and blue data points) and vemurafenib (lower x-axes and black data points). Left diagram shows response on viability (MUH) after three days of treatment without knockdown of β-catenin and right diagram shows the response after additional induction of shCTNNB1. The diagrams correspond to the data presented in Fig. 8d.
Fig. 1
Fig. 1
Beta-catenin expression levels increase in BRAFi resistant melanomas cells compared to the sensitive parentals. a) Immunohistochemical staining for β-catenin of clinical specimens before and after the acquisition of resistance to BRAFi. Beta-catenin expression levels are shown in red (Fast Red substrate) with hematoxylin counter staining (scale bar is 100 μm). b) Immunoblots of whole cell lysates from sensitive and resistant pairs of the melanoma cell lines 451Lu, Mel1617, A375 and SKMel19 showing the expression levels of β-catenin and (phospho) Erk1/2. Semiquantitative analysis was performed by building the ratios of (β-catenin:β-actin) and (p-ERk1/2:Erk1/2) and normalization to the sensitive cells.
Fig. 2
Fig. 2
Nuclear localized beta-catenin in BRAFi resistant melanomas cells compared to the sensitive parentals. a) Immunofluorescence staining for β-catenin (blue) and nuclear YOPRO-1 staining (green) with confocal microscopy for expression and localization analysis of β-catenin (white scale bars represent 50 μm). b) Immunoblot of cytosolic and nuclear extracts showing the increased nuclear localization of β-catenin in the resistant cells of the cell lines 451Lu, Mel1617 and A375. Semiquantitation was performed densitometrically by using the ratios of [β-catenin:β-actin] for cytosolic and [β-catenin:LaminB] for nuclear fractions of the sensitive and resistant cell line pairs. All ratios were normalized to the sensitive parental cell line to compare the sensitive to the corresponding resistant cell line.
Fig. 3
Fig. 3
Beta-catenin is directly involved in the efficacy of the response to BRAFi and suppresses growth inhibition a) Cell viability assay (MUH) of melanoma cell lines pre-treated with 7.5 mM LiCl for 24 h for stabilization of β-catenin. Immunoblots show the stabilization of β-catenin after treatment of 451Lu cells with LiCl. After the pre-treatment, cells were treated with increasing concentrations of vemurafenib for 72 h before the assessment of cell viability. Black symbols represent sensitive control cells and red symbols represent LiCl pre-treated cells. Signals were normalized to the control cells without vemurafenib treatment. Mean +/  SD values of six replicates are shown. Multiple t-tests with Holm–Šídák correction were used to compare data points of the two curves and p < 0.05 was considered as significant (asterisk). b) Cell viability assays (MUH) after Tet-inducible knockdown of β-catenin in 451LuTet-S (left diagram) or 451LuTet-R cells (right diagram). Knockdown was induced by pre-treatment with 1 μg/ml doxycycline for 24 h (red symbols) and compared to cells without doxycycline treatment (black symbols). Multiple t-tests with Holm–Šídák correction were used to compare data points of the two curves and p < 0.05 was considered as significant (asterisk). F-test revealed a significant different IC50 of the fitted curves. c) Immunoblot analysis for β-catenin and (phospho-) Erk1/2 shows protein level changes after induction of shCTNNB1 in combination with vemurafenib treatment 24 h after treatment in comparison to vehicle control treated cells.
Fig. 4
Fig. 4
Knockdown of β-catenin enhances the BRAFi mediated induction of apoptosis and senescence. a) Cell cycle analysis of Tet-inducible 451LuTet-S (upper panel) and 451LuTet-R (lower panel) cells after treatment with 5 or 10 μM vemurafenib for 72 h. Doxycycline pre-treatment for 24 h (right bar diagrams) was used to induce β-catenin specific shRNA. Representative FACS histograms of the cell cycle analysis comparing vehicle (DMSO) treated cells with vemurafenib (10 μM) are shown. Cell cycle distributions represent the result of three biologic replicates (mean +/− SD). b) SA-associated β-galactosidase staining after 72 h of vemurafenib treatment of the above mentioned Tet-inducible cells (scale bars represent 200 μm). Clear blue cells were counted and normalized to the total number of cells using four different microscopic pictures (top row) per treatment. Mean numbers +/− SD are shown from three independent biological replicates (bottom row). ANOVA analyis was performed using Tukey's multiple comparisons test (asterisks).
Fig. 5
Fig. 5
Knockdown of β-catenin synergizes with vemurafenib for the inhibition of tumor growth of BRAFi resistant melanomas. a) Xenograft experiment using Tet-inducible 451Lu-R cells for s.c. injection (1 × 106 cells) into SHO mice. After formation of 100 mm3 tumor nodules upon daily i.p. injections with vemurafenib (25 mg/kg) the mice were randomized into four treatment groups: i) vemurafenib treatment (black), ii) untreated (grey), iii) shRNA induction by doxycycline (1 mg/ml) in the drinking water ad libitum and (green) iv) combination (red) (n = 5 per group). The tumor growth was daily monitored by caliper measurements and normalized to the size at day 0 of treatment. Multiple t tests were used to determine the data points of the combination group with p < 0.05 (asterisk). b) Positron emission tomography using F18-FDG was performed on days 4, 8 and 12 post-start of therapy. c) Immunistochemistry of removed tumors from SHO mice (from 2F). Tumors of every group were stained for β-catenin expression, phospho-Erk1/2 and Ki67 using Fast Red as substrate. Representative microscopic pictures are shown of every group (scale bars indicate 100 μm). d) Ki67 positive cells were counted and normalized to total cell numbers as indicator for cell proliferation. Three different tumors per group were used for data analysis. Mean percentages +/− SD are shown. ANOVA analysis was performed using Tukey's multiple comparisons test (asterisks).
Fig. 6
Fig. 6
Accumulated β-catenin in BRAFi resistant melanoma cell lines acts independent of the canonical Wnt signaling pathway and the TCF/LEF factors. a) TOPflash luciferase reporter assays were done to measure the transcriptional activity of TCF/LEF complexes. Sensitive (black bars) and resistant (red bars) melanoma cell lines were transfected with the reporter construct plus CMV-renilla luciferase as a normalization control and treated for 24 h with the indicated concentrations of vemurafenib. For the induction of the full signaling activity a pre-treatment with 15 mM LiCl was performed. Firefly luciferase activity was normalized to renilla activity. Mean values and standard deviations of six samples are presented. Multiple t-tests with Holm–Šídák correction were used to compare data of sensitive and resistant samples and p < 0.05 was considered as significant (asterisk). b) Co-immunoprecipitation experiments for the detection of interactions of β-catenin with TCF4, LEF1 and Mitf. Soluble lysates were prepared from the indicated sensitive and resistant melanoma cells and incubated with an immobilized β-catenin specific nanobody. Input, non-bound and bound fractions were separated on a SDS-PAGE followed by immunoblot analysis for the transcription factors TCF4, LEF1 and MITF. c) Cell viability assay (MUH) for testing the effects of released β-catenin from the complexes with TCF/LEF by 50 nM PKF115–584 (circles with dashed curve). The inhibitor was pre-incubated for 6 h before the treatment with increasing concentrations of vemurafenib for 72 h. The assay was measured in quintuplicates. Mean values +/− SD are shown. Multiple t-tests with Holm–Šídák correction were used to compare data points of the two curves and p < 0.05 was considered as significant (asterisk). d) TOPFlash assay was used to investigate the influence of vemurafenib on β-catenin /TCF/LEF dependent transcription. Reporter transfected cells were treated for 24 h with the indicated concentrations of vemurafenib before assaying the luciferase activity. Firefly values were normalized to renilla signals and to the corresponding untreated controls. Mean values and standard deviations of sixtuplicates are presented. Multiple t-tests with Holm–Šídák correction were used to compare data of sensitive and resistant samples and p < 0.05 was considered as significant (asterisk).
Fig. 7
Fig. 7
Interaction of β-catenin with Stat3 occurs preferentially in BRAFi resistant melanoma cells. a) Co-immunoprecipitation experiments were done to confirm an interaction of β-catenin with Stat3. Lysates were prepared after crosslinking of the proteins with 0.4% buffered formaldehyde using the sensitive and resistant versions of 451Lu and Mel1617 cells. Precipitation was performed with a β-catenin or a Stat3 specific antibody and detected by immunoblot. Semi-quantification by densitometric analysis was done by calculating the ratios (bound fraction:input fraction) followed by normalization to the sensitive cells (see numbers below the blots and table). b) Immunoblot analysis for Stat3 expression and phosphorylation (Ser727 and Tyr705) in the sensitive and resistant 451Lu, Mel1617 and A375 cell lines. The same lysates as in Fig. 1B were used. Beta-actin protein levels served as loading controls. c) Firefly reporter assay for Stat3 specific transciption was used to detect the nuclear Stat3 signaling activity in the sensitive and resistant melanoma cells of 451Lu, Mel1617 and A375. LiCl (15 mM for 24 h) treatment was used to induce β-catenin accumulation. Firefly signals were normalized to CMV-renilla control signals. Mean values +/− SD of sixtuplicates are shown. Multiple t-tests with Holm–Šídák correction were used to compare data of sensitive and resistant samples and p < 0.05 was considered as significant (asterisk).
Fig. 8
Fig. 8
Stat3 and β-catenin levels cooperatively mediate resistance to BRAFi in melanoma cells. a) Stat3 was overexpressed in sensitive A375 and SKMel19 cells using a lentivirus (LV-STAT3). After selection the stable overexpression was tested by western blot and the cells were used for cell viability testings (MUH) after 72 h of treatment with vemurafenib. Signals were normalized to the control cells without vemurafenib treatment. Mean +/− SD values of six replicates are shown. Multiple t-tests with Holm–Šídák correction were used to compare data points of the two curves and p < 0.05 was considered as significant (asterisk). F-test revealed a significant different IC50 of the fitted curves. b) Cell viability (MUH assay) 72 h after combinatorial inhibition of Stat3 by Stattic and BRAFV600E by vemurafenib in resistant Mel1617-R, 451Lu-R, A375-R and SKMel19-R cells (top row). Stattic and vemurafenib were mixed in a fixed ratio (3:20) with the maximum concentrations 3 μM for Stattic and 20 μM for vemurafenib. Cells were treated with the inhibitors in ascending concentrations of the combined drugs. 72 h after treatment cell viablitiy was assessed in quintuplicates. The top x-axes represent the concentrations of Stattic and the bottom x-axes represent the concentrations of vemurafenib. Mean +/− SD values are shown. Multiple t-tests with Holm–Šídák correction were used to compare data points of the curves and p < 0.05 was considered as significant (asterisk). F-test revealed a significant different IC50 of the fitted curves. Four short-term melanoma cultures from clinically BRAFi resistant tumors were used for viability testing at 72 h after beginning with either mono or combinatorial treatment using Stattic and vemurafenib (bottom row). c) Cell viability after knockdown of β-catenin. siRNA (50 nM) was used to specifically downregulate either β-catenin or Stat3 in the resistant 451Lu-R, Mel1617-R and A375-R cells. 24 h post transfection cells were treated with increasing concentrations of vemurafenib for 72 h before the measurement of cell viability via MUH assay. Each assay was performed in quintuplicates. Multiple t-tests with Holm–Šídák correction were used to compare data points of the curves and p < 0.05 was considered as significant (asterisk). d) The 451Lu-TetOn-shCTNNB1 resistant cells were used for double (left and middle diagram) and triple targeting (right diagram) of β-catenin (using doxycycline), Stat3 (using Stattic) and BRAFV600E (using vemurafenib). For the knockdown of β-catenin cells were pretreated with 1 μg/ml doxycycline before the addition of the inhibitors. After 72 h of treatment cell viability was assessed. Multiple t-tests with Holm–Šídák correction were used to compare data points of the curves and p < 0.05 was considered as significant (asterisk). Knockdown of β-catenin reduced the IC50 of vemurafenib 3.7fold and the IC50 of Stattic 1.3fold. Combination of the knockdown with both inhibitors resulted in an additive effect as shown in the isobologram. Intersections with the axes denote the IC50 values of the corresponding inhibitors. The measured effective IC50 of the combinations are depicted by the dots. Data points of the assay with knockdown are shown in red, black data points represent the cells without knockdown of β-catenin.

Similar articles

Cited by

References

    1. Abel E.V., Basile K.J., Kugel C.H., Witkiewicz A.K., Le K., Amaravadi R.K., Karakousis G.C., Xu X., Xu W., Schuchter L.M., Lee J.B., Ertel A., Fortina P., Aplin A.E. Melanoma adapts to RAF/MEK inhibitors through FOXD3-mediated upregulation of ERBB3. J. Clin. Invest. 2013;123:2155–2168. - PMC - PubMed
    1. Albert B., Silvia V. 2012. The nuclear factor κB inhibitor (E)-2-fluoro-4′-methoxystilbene inhibits firefly luciferase. - PMC - PubMed
    1. Anastas J.N., Kulikauskas R.M., Tamir T., Rizos H., Long G.V., von Euw E.M., Yang P.-T., Chen H.-W., Haydu L., Toroni R.A., Lucero O.M., Chien A.J., Moon R.T. WNT5A enhances resistance of melanoma cells to targeted BRAF inhibitors. J. Clin. Invest. 2014;124:2877–2890. - PMC - PubMed
    1. Benham-Pyle B.W., Pruitt B.L., Nelson W.J. Mechanical strain induces E-cadherin-dependent Yap1 and -catenin activation to drive cell cycle entry. Science. 2015;348(80-.):1024–1027. - PMC - PubMed
    1. Biechele T.L., Kulikauskas R.M., Toroni R.A., Lucero O.M., Swift R.D., James R.G., Robin N.C., Dawson D.W., Moon R.T., Chien A.J. Wnt/β-catenin signaling and AXIN1 regulate apoptosis triggered by inhibition of the mutant kinase BRAFV600E in human melanoma. Sci. Signal. 2012;5:ra3. - PMC - PubMed

MeSH terms