. 2016 Sep;19(9):1225-33.
doi: 10.1038/nn.4348. Epub 2016 Jul 18.

Infantile amnesia reflects a developmental critical period for hippocampal learning

Affiliations

Infantile amnesia reflects a developmental critical period for hippocampal learning

Alessio Travaglia et al. Nat Neurosci. 2016 Sep.

Erratum in

Abstract

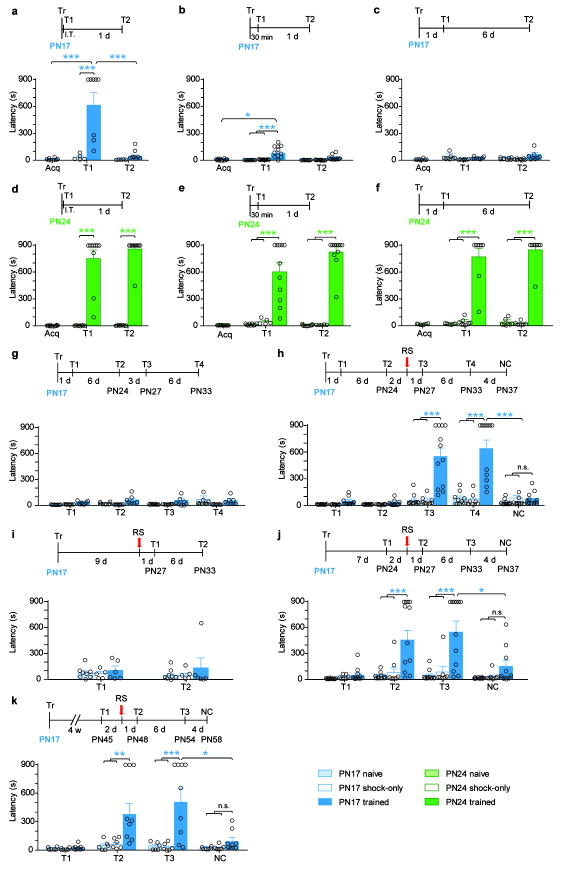
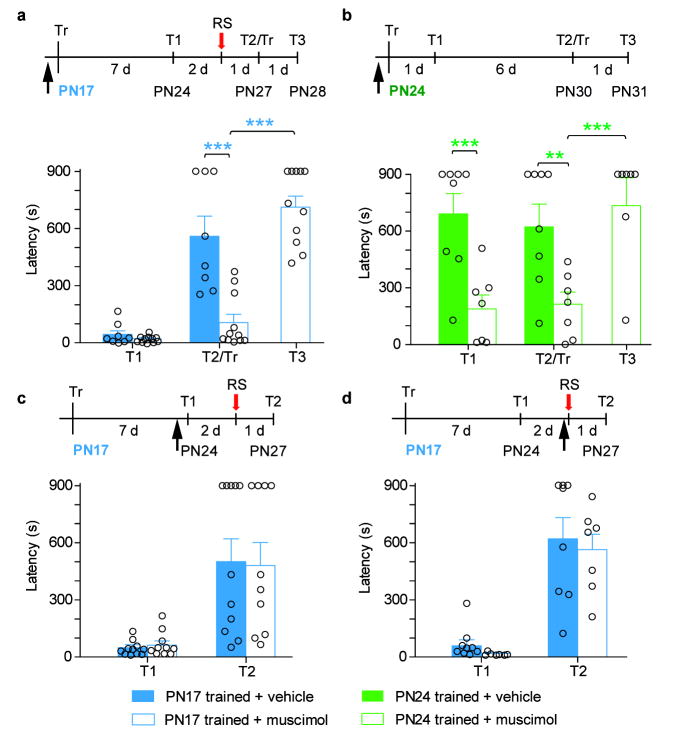
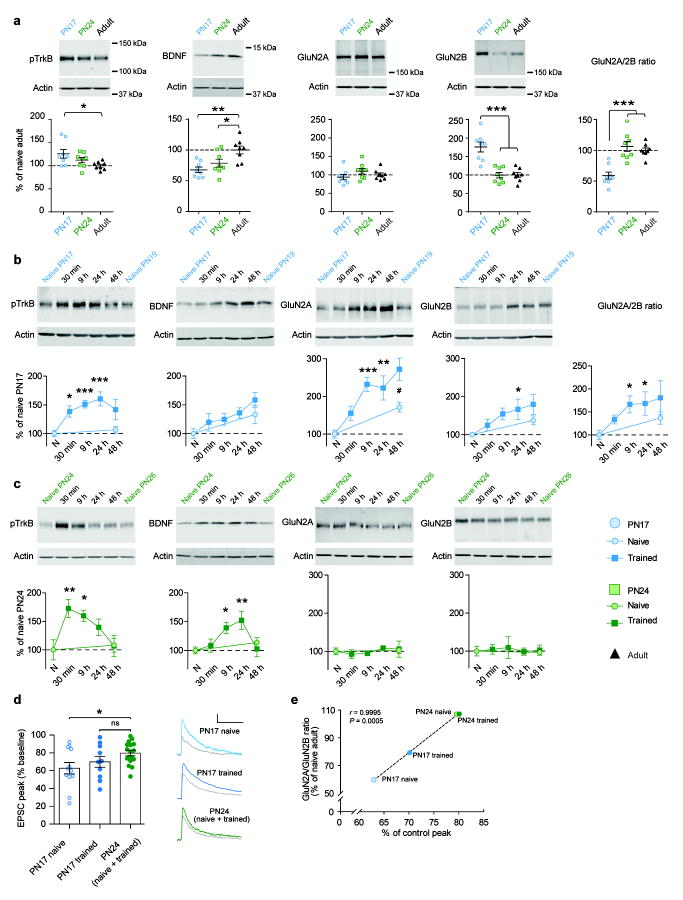
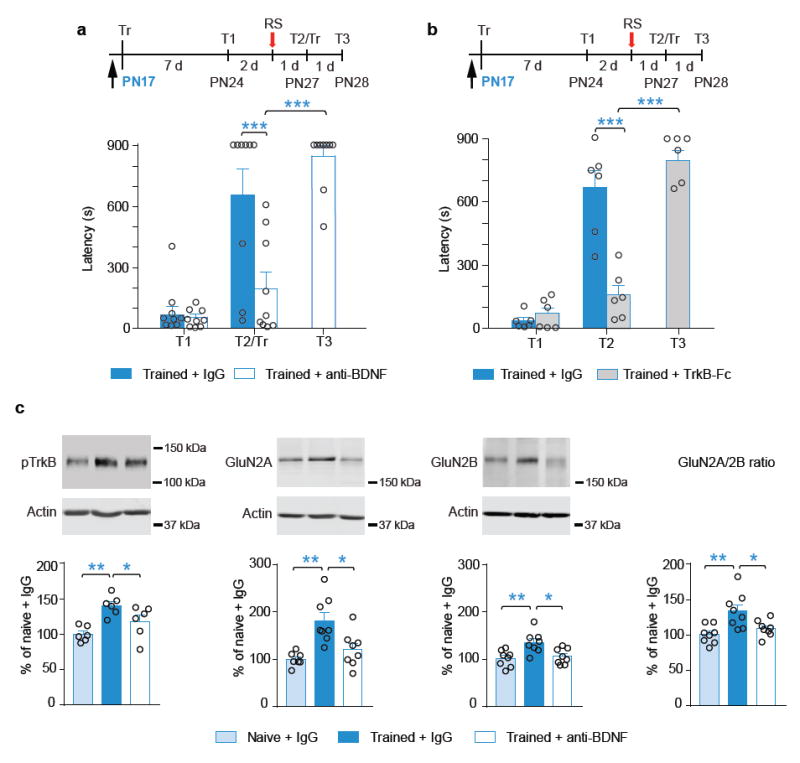
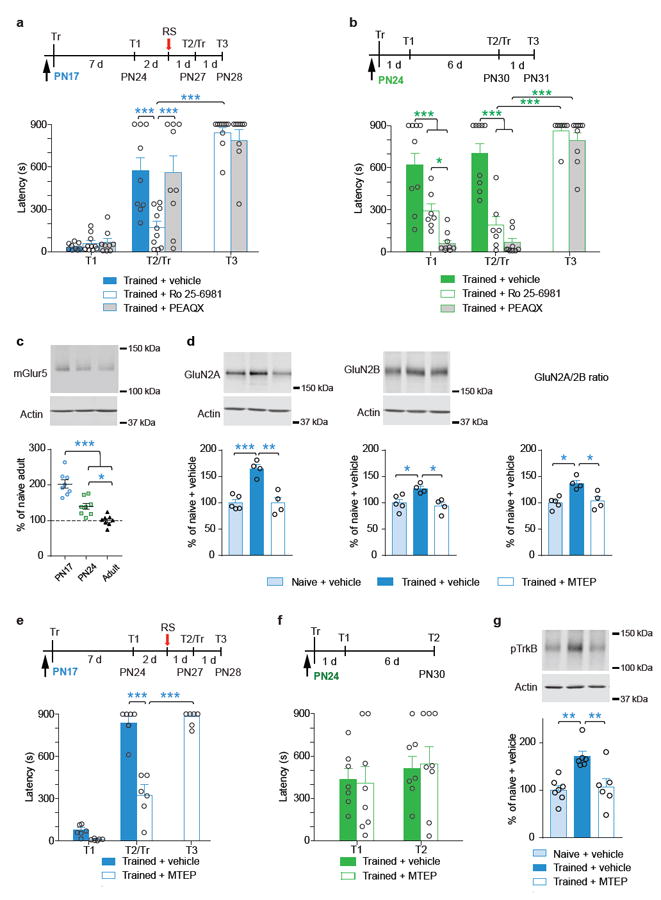
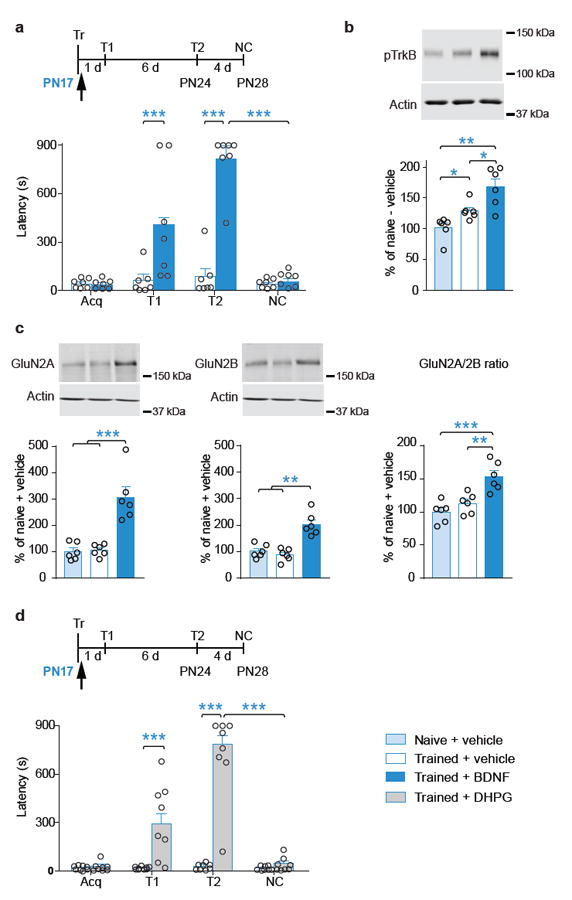
Episodic memories formed during the first postnatal period are rapidly forgotten, a phenomenon known as 'infantile amnesia'. In spite of this memory loss, early experiences influence adult behavior, raising the question of which mechanisms underlie infantile memories and amnesia. Here we show that in rats an experience learned during the infantile amnesia period is stored as a latent memory trace for a long time; indeed, a later reminder reinstates a robust, context-specific and long-lasting memory. The formation and storage of this latent memory requires the hippocampus, follows a sharp temporal boundary and occurs through mechanisms typical of developmental critical periods, including the expression switch of the NMDA receptor subunits from 2B to 2A, which is dependent on brain-derived neurotrophic factor (BDNF) and metabotropic glutamate receptor 5 (mGluR5). Activating BDNF or mGluR5 after training rescues the infantile amnesia. Thus, early episodic memories are not lost but remain stored long term. These data suggest that the hippocampus undergoes a developmental critical period to become functionally competent.


Conflict of interest statement

The authors declare no competing financial interests.

Figures

Figure 1
Figure 1. Latent infantile memories are rapidly forgotten but reinstate later in life with reminders
Experimental schedule is shown above each panel. Acquisition (Acq.) and memory retention are expressed as mean latency ± s.e.m (in seconds, s). (a-c) Mean latency ± s.e.m. of naïve, shock-only and rats trained at PN17 and tested (T): (a) immediately (immediate test, I.T.) [n= 5, 8; Two–way ANOVA followed by Bonferroni post hoc, Condition F(1,22)=11.53, P=0.0026, Testing F(1,22)=10.71, P=0.0035, Interaction F(1,22)=9.209, P=0.0061; 3 independent experiments]; (b) 30min [n= 9, 11, 11; Two–way ANOVA followed by Bonferroni post hoc, Condition F(2,56)=14.60, P<0.001, Testing F(1,56)=5.48, P=0.023, Interaction F(2,56)=2.73, P=0.074; 3 independent experiments]; (a-c) 1d; and (c) 7d after training [n=8, 8, 8; Two–way ANOVA followed by Bonferroni post hoc, Condition F(2,42)=2.437, P=0.0997, Testing F(1,42)=0.4311, P=0.515, Interaction F(2,42)= 0.9929, P=0.379; 3 independent experiments]. (d-f) Mean latency ± s.e.m. of naïve, shock-only and rats trained at PN24 and tested (T): (d) immediately[n=7, 10; Two–way ANOVA followed by Bonferroni post hoc, Condition F(1,30)=153.6, P<0.0001, Testing F(1,30)=0.7410, P=0.3962, Interaction F(1,30)=0.6629, P=0.4220; 3 independent experiments]; (e) 30min [n= 9, 5, 11; Two–way ANOVA followed by Bonferroni post hoc, Condition F(2,44)=55.51, P<0.001, Testing F(1,44)=0.97, P=0.33, Interaction F(2,44)=1.72, P=0.19; 3 independent experiments]; (d-f) 1d; and (f) 7d after training [n= 8, 8, 8; Two–way ANOVA followed by Bonferroni post hoc, Condition F(2,42)=183.8, P<0.0001, Testing F(1,42)=0.48, P=0.489, Interaction F(2,44)=0.5949, P=0.5562, 3 independent experiments]. (g) Mean latency ± s.e.m. of naïve, shock-only and rats trained at PN17 and tested (T) 1d, 7d, 10d and 16d after training (n=10, 9, 8; Two–way ANOVA followed by Bonferroni post hoc, Condition F(2,96)=5.542, P=0.0053, Testing F(3,96)=0.9441, P=0.4226, Interaction F(6,96)=1.056, P=0.3945; 3 independent experiments]. (h) Mean latency ± s.e.m. of naïve, shock-only and rats trained at PN17 and tested (T) 1d and 7d after training, and after a reminder shock (RS) given 2d thereafter in a different context [n=11, 10, 12; Two–way ANOVA followed by Bonferroni post hoc, Condition F(2,138)=43.48, P<0.0001, Testing F(4,138)=21.81, P<0.0001, Interaction F(8,138)=12.27, P<0.0001, 3 independent experiments]. (i) Mean latency ± s.e.m. of naïve, shock-only and rats trained at PN17 and given a RS 9d after training and tested (T) 1d (T1) and again 6d later (T2) [n= 8, 5, 6; Two–way ANOVA followed by Bonferroni post hoc, Condition F(2,32)=0.8669, P=0.4299, Testing F(1,32)=0.0259, P=0.8731, Interaction F(1,32)=0.1791, P=0.8368; 3 independent experiments]. (j-k) Mean latency ± s.e.m. of naïve, shock-only and rats trained at PN17 and tested (T): (j) 7d [n=12, 8, 12; Two–way ANOVA followed by Bonferroni post hoc, Condition F(2,116)=24.0, P<0.0001, Testing, F(3,116)=6.733, P=0.0003, Interaction F(6,116)=4.137, P=0.0008; 3 independent experiments] or (k) 4 weeks after training (T1) [n= 6, 6, 9; Two–way ANOVA followed by Bonferroni post hoc, Condition F(2,71)=13.18, P<0.0001, Testing F(3,71)=3.98, P<0.011, Interaction F(6,71)=3.54, P=0.004; 3 independent experiments]. A RS was given 2d later and the rats were tested 1d (T2) and again 6d later (T3). Four days after T3 the rats were tested in a novel context (NC). *P < 0.05, **P < 0.01, and ***P < 0.001. Latency scores are reported in Supplementary Table 1.
Figure 2
Figure 2. The latent infantile memory trace is hippocampus-dependent
Experimental schedule is shown above each panel. Memory retention are expressed as mean latency ± s.e.m (in seconds, s). (a-b) Mean latency ± s.e.m. of rats injected (↑) in the dorsal hippocampus with vehicle or muscimol 30min before training (Tr) at (a) PN17 [n= 8, 10; Two–way ANOVA followed by Bonferroni post hoc, Treatment F(1,48)=17.74, P=0.0001, Testing F(2,48)=32.02, P<0.0001, Interaction F(2,48)=17.43, P<0.0001; 3 independent experiments] or (b) PN24 [n= 8, 7; Two–way ANOVA followed by Bonferroni post hoc, Treatment F(1,39)=22.57, P<0.0001, Testing F(2,39)=16.65, P<0.0001, Interaction F(2,39)=5.108, P=0.0107; 3 independent experiments] and tested (T) at the indicated times. At T2, upon entering the shock compartment rats were trained again (Tr) and tested 1d later. (c-d) Mean latency ± s.e.m. of rats trained at PN17 and injected (↑) in the dorsal hippocampus with vehicle or muscimol 30min before (c) test 1 (T1) which was given 7d after training [n= 11, 10; Two–way ANOVA followed by Bonferroni post hoc, Treatment F(1,57)= 0.0013, P=0.9719, Testing F(2,57)= 27.68, P< 0.0001, Interaction F(2,57)= 0.03027, P=0.9702; 3 independent experiments] or (d) a reminder shock (RS) given 2d after T1 [n=8, 7; Two–way ANOVA followed by Bonferroni post hoc, Treatment F(1,39)= 0.4162, P<0.5226, Testing F(2,39)=60.59, P<0.0001, Interaction F(2,39)=0.1302, P=0.8783; 3 independent experiments]. Rats were tested again 1d after RS (T2).*P < 0.05, **P < 0.01, and ***P < 0.001. Latency scores are reported in Supplementary Table 2.
Figure 3
Figure 3. Training at PN17 increases pTrkB and switches the ratio of GluN2B/GluN2A levels in the dorsal hippocampus
(a) Examples and densitometric western blot analyses of dHC total extracts from naïve rats euthanized at PN17, PN24 or PN80 (adult) (n=8, 8, 8). Data are expressed as mean percentage ± s.e.m. of adult naïve rats [One–way ANOVA followed by Newman-Keuls Multiple Comparison Test, pTrkB F(2,21)=3.342, P=0.0549; BDNF F(2,21)=7.125, P=0.0043; GluN2A F(2,21)=1.524, P=0.2410; GluN2B F(2,21)=12.41, P=0.0003; GluN2A/GluN2B ratio F(2,21)= 17.68, p< 0.0001; 3 independent experiments]. *P < 0.05, **P < 0.01, and ***P <; 0.001. (b-c) Examples and densitometric western blot analyses of dHC total extracts from rats trained in IA at (b) PN17 or (c) PN24, and euthanized 30min, 9h, 24h, 48h after training (n=6-10/group). To take into account developmental differences, two groups of naïve were used [(b) PN17 and PN19 or (c) PN24 and PN26]. Data are expressed as mean percentage ± s.e.m. of (b) PN17 naïve rats [n=8, 6, 10, 7, 6, 6, One–way ANOVA followed by Dunnett’s Multiple Comparison Test, pTrkB F(3,27)=10.29, P=0.0001; BDNF F(3,27)= 1.998, P=0.1381; GluN2A F(3,27)=8.580, P=0.0004; GluN2B F(3,27)= 2.923, P=0.0527; GluN2A/2B F(3,27)=3.243, P=0.0389; 3 independent experiments] or (c) PN24 naïve rats [n=8, 6, 6, 7, 7, 8; One–way ANOVA followed by Dunnett’s Multiple Comparison Test, pTrkB F(3,23)=4.489, P=0.0128; BDNF F(3,23)= 5.256, P=0.0066; GluN2A F(3,23)=0.7538, P=0.5314; GluN2B F(3,23)=0.08686, P=0.9665; 3 independent experiments]. * Indicates significance compared to (b) PN17 naïve or (c) PN24 naïve rats *P < 0.05, **P < 0.01, and ***P < 0.001. # indicates significance levels comparing PN19 naive to 48h trained groups (GluN2A, Unpaired two-tailed Student’s t-test, t=3.113 df=10, #P = 0.0110). (d) Ifenprodil (3 μM) depressed the amplitude of NMDA EPSCs recorded at Vm =+40 mV in PN17 naïve rats (n= 6 rats, 12 cells) when compared to P24 animals (n=10,17; p<0.05), but not in PN17 trained animals (n=6,10) [One-way ANOVA followed by Bonferroni’s Multiple Comparison’s Test, F(2,36) = 3.298, P = 0.0484]. Representative sample traces from before (color) and 20 min after ifenprodil (grey) are shown on the right. Error bars, SEM. Scale bars, X-axis = 200 ms, Y-axis = 10 pA (top), 40 pA (middle), and 25 pA (bottom). (e) Correlation of western blot (GluN2A/GluN2B ratio, % of Naive Adult) and electrophysiology data (% of Control Peak). r the Pearson correlation. The numeric values are reported in Supplementary Table 3. Full-length blots/gels are presented in Supplementary Figure 9.
Figure 4
Figure 4. BDNF is required for the formation of the latent infantile memory and for the GluN2B-2A switch
Experimental schedule is shown above each panel.. (a-b) Mean latency ± s.e.m. (expressed in seconds, s) of rats injected (↑) in the dorsal hippocampus with (a) IgG or anti-BDNF [n= 9, 9, Two–way ANOVA followed by Bonferroni post hoc, Treatment F(1,32)= 9.021, P=0.0051, Testing F(1,32)= 21.72, p<0.0001, Interaction F(1,32)= 8.234, P=0.0072; 3 independent experiments] or (b) IgG or TrkB-Fc [n= 6, 6; Two–way ANOVA followed by Bonferroni post hoc, Treatment F(1,20)= 25.48, p<0.0001, Testing F(1,20)=59.34, P<0.0001, Interaction F(1,20)=33.81, p<0.0001; 2 independent experiments] 30min before training (Tr) at PN17. Rats were tested 7d after training (T1) and two days later received a reminder shock (RS), and were tested again 1d later (T2). At T2, upon entering the shock compartment rats were trained again (Tr) and tested 1d later (T3). (c) Representative examples and densitometric western blot analyses of dorsal hippocampal extracts obtained from naive and trained rats given hippocampal injections of IgG or anti-BDNF 30min before training (Tr) at PN17 and euthanized 24h after training. Data are expressed as mean percentage ± s.e.m. of naive rats injected with IgG and euthanized at the matched time point (i.e. PN18) [n= 8,8,8; One–way ANOVA followed by Newman-Keuls Multiple Comparison Test, pTrkB F(2,15)=8.858, P=0.0029; GluN2A F(2,21)= 6.864, P=0.0051; GluN2B F(2,21)=6.731, P=0.0055; GluN2A/2B F(2,21)=7.632, P=0.0032, 3 independent experiments]. *p < 0.05, **p < 0.01). The numeric values are reported in Supplementary Table 4 and 5. Full-length blots/gels are presented in Supplementary Figure 10.
Figure 5
Figure 5. GluN2B and mGluR5-dependent switch of GluN2B-2A is required to form the latent infantile memory
Experimental schedule is shown above each panel. (a-b) Mean latency ± s.e.m. (expressed in seconds, s) of rat injected (↑) in the dorsal hippocampus with vehicle, Ro 25-6981 or PEAQX 30min before training at (a) PN17 [n=9, 10, 9, Two–way ANOVA followed by Bonferroni post hoc, Treatment F(2,75)= 6.639, P=0.0022, Testing F(2,75)=58.35, P<0.0001, Interaction F(4,75)= 6.496, P=0.0022; 3 independent experiments] or (b) PN24 [n=9, 7, 9, Two–way ANOVA followed by Bonferroni post hoc, Treatment F(2,66)=43.55, P<0.0001, Testing F(2,66)= 32.29, P<0.0001, Interaction F(4,66)=12.81, P<0.0001; 3 independent experiments]. T1, first test. RS, reminder shock. T2, second test. At T2, upon entering the shock compartment rats were trained again (Tr) and tested 1d later (T3). (c-d) Representative examples and densitometric western blot analyses of dorsal hippocampal total extracts obtained from (c) naïve rats euthanized at PN17, PN24 or PN80 (adult) (n=8/group, One–way ANOVA followed by Newman-Keuls Multiple Comparison Test F(2,21)= 33.89, p< 0.0001; 3 independent experiments); (d) naive and trained rats injected into the dorsal hippocampus with either vehicle or MTEP 30min before training (Tr) at PN17 and euthanized 24h after training [n= 5, 4, 4, One–way ANOVA followed by Newman-Keuls Multiple Comparison Test, GluN2A F(2,12)= 18.64, P=0.0004; GluN2B F(2,12)= 6.314, P=0.0169; GluN2A/2B F(2,12)= 4.481, P=0.0408; 2 independent experiments]. Data are expressed as mean percentage ± s.e.m. of (c) adult naïve rats or (d) naive rats injected with vehicle and euthanized at the matched time point (i.e. PN18). *p < 0.05, **p < 0.01 and ***p<0.001). (e-f) Mean latency ± s.e.m. (in seconds, s) of rat injected (↑) in the dorsal hippocampus with either vehicle or MTEP 30min before training at (e) PN17 [n= 6, 6, Two–way ANOVA followed by Bonferroni post hoc, Treatment F(1,30)=41.18, P<0.0001, Testing F(2,30)=134.9, P<0.0001, Interaction F(2,30)=25.02 p<0.0001; 2 independent experiment] or (f) PN24 [n= 7, 8, Two–way ANOVA followed by Bonferroni post hoc, Treatment F(1,39)= 0.003504, P<0.9531, Testing F(2,39)= 19.68, P< 0.0001, Interaction F(2,39)= 0.05990, P=0.9419; 3 independent experiments]. T1, first test. RS, reminder shock. T2, second test. At T2, upon entering the shock compartment rats were trained again (Tr) and tested 1d later (T3). (g) Representative examples and densitometric western blot analyses of dorsal hippocampal total extracts obtained from naive and trained rats given hippocampal injections of vehicle or MTEP 30min before training (Tr) at PN17 and euthanized 24h later [n= 7, 6, 6, One–way ANOVA followed by Newman-Keuls Multiple Comparison Test, pTrkB F(2,18)= 9.162, P=0.0022; 3 independent experiments]. Data are expressed as mean percentage ± s.e.m. of naive rats injected with vehicle and euthanized at the matched time point (i.e. PN18). *p < 0.05 and ***p < 0.001. Latency scores are reported in Supplementary Table 6 and 7. Full-length blots/gels are presented in Supplementary Figure 10.
Figure 6
Figure 6. BDNF closes the infantile amnesia period
Experimental schedule is shown above each panel. Acquisition (Acq) and memory retention are expressed as mean latency ± SEM (in seconds, s). (a) Mean latency ± s.e.m. (expressed in seconds, s) of rats that received hippocampal injections (↑) of vehicle or BDNF immediately after IA training at PN17. Memory retention was tested 1d (T1) and 7d (T2) after training and, 4d after T2, in a new context (NC) [n=7, 7, Two–way ANOVA followed by Bonferroni post hoc, Treatment F(1,36)=18.49, P<0.0001, Testing F(2,36)=22.57, P<0.0001, Interaction F(2,36)=14.36, P<0.0001; 3 independent experiments]. (b-c) Representative examples and densitometric western blot analyses of dorsal hippocampal total extracts obtained from naive or trained rats given hippocampal injections of either vehicle or BDNF immediately after IA training (Tr) at PN17 and euthanized 2 hours later [n= 6, 6, 6; One–way ANOVA followed by Newman-Keuls Multiple Comparison Test, pTrkB F(2,17)=10.35, P=0.0015; GluN2A F(2,17)= 14.66, P=0.0003; GluN2B F(2,17)=19.17, P<0.0001; GluN2A/2B F(2,17)= 11.82 P=0.0008; 3 independent experiments]. Data are expressed as mean percentage ± s.e.m. of naive rats injected with vehicle and euthanized at the matched time point. (d) Mean latency ± s.e.m. (expressed in seconds, s) of rats that received a bilateral hippocampal injection (↑) of either vehicle or DHPG immediately after IA training at PN17. Memory retention was tested at 1d (T1) and 7 d (T2) after training and, 4d after T2, in a new context (NC) [n= 8, 8, Two–way ANOVA followed by Bonferroni post hoc, Treatment F(1,42)=157.2, P<0.0001, Testing F(1,42)=61.70, P<0.0001, Interaction F(2,42)=57.4, P<0.0001]. ***P < 0.001. Latency score in Supplementary Table 8 and 9. Full-length blots/gels are presented in Supplementary Figure 10.

Comment in

  • The hippocampus grows up.
    Rudenko A, Tsai LH. Rudenko A, et al. Nat Neurosci. 2016 Aug 26;19(9):1190-1. doi: 10.1038/nn.4368. Nat Neurosci. 2016. PMID: 27571198 No abstract available.

Similar articles

Cited by

References

    1. Campbell BA, Spear NE. Ontogeny of memory. Psychol Rev. 1972;79:215–236. - PubMed
    1. Hayne H. Infant memory development: Implications for childhood amnesia. Dev Rev. 2004;24:33–73.
    1. Rovee-Collier C. The development of infant memory. Curr Dir Psychol Sci. 1999;8:80–85.
    1. Heim C, Nemeroff CB. The role of childhood trauma in the neurobiology of mood and anxiety disorders: preclinical and clinical studies. Biol Psychiatry. 2001;49:1023–1039. - PubMed
    1. Dumas TC, Rudy JW. Development of the hippocampal memory system: Creating networks and modifiable synapses. In: Blumberg MS, Freeman JH, Robinson SR, editors. Oxford Handbook of Developmental Behavioral Neuroscience Oxford library of neuroscience. New York, NY, US: Oxford University Press; 2010.

Publication types

Substances