. 2016 Sep;19(9):1256-67.
doi: 10.1038/nn.4345. Epub 2016 Jul 18.

ALS disrupts spinal motor neuron maturation and aging pathways within gene co-expression networks

Affiliations

ALS disrupts spinal motor neuron maturation and aging pathways within gene co-expression networks

Ritchie Ho et al. Nat Neurosci. 2016 Sep.

Abstract

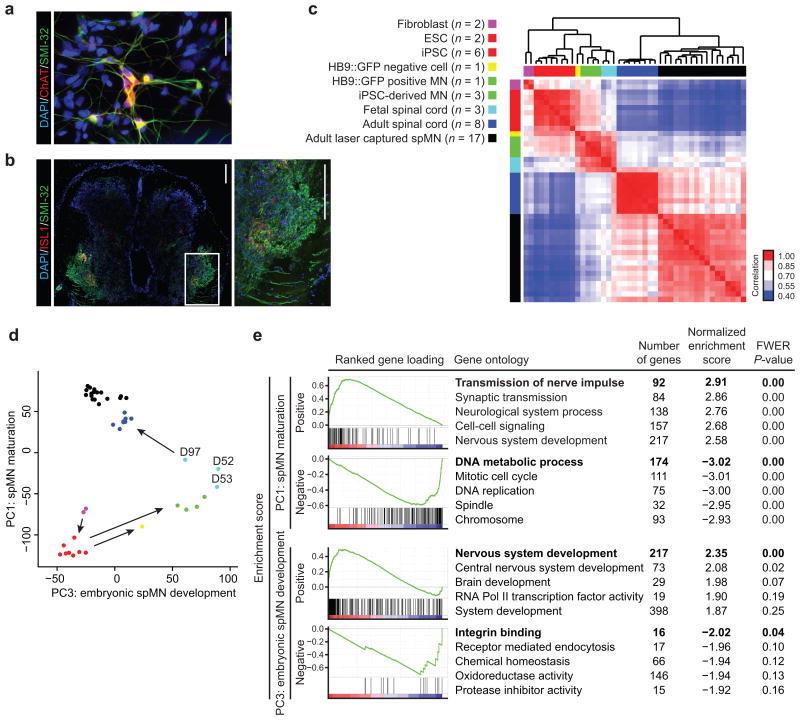
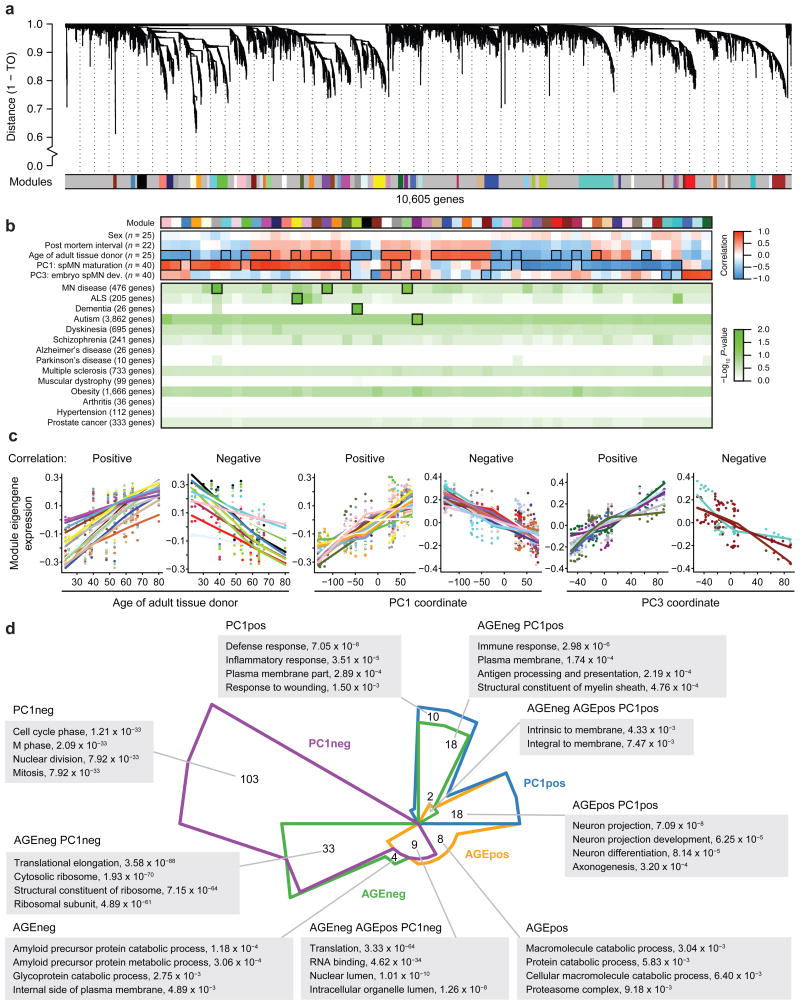
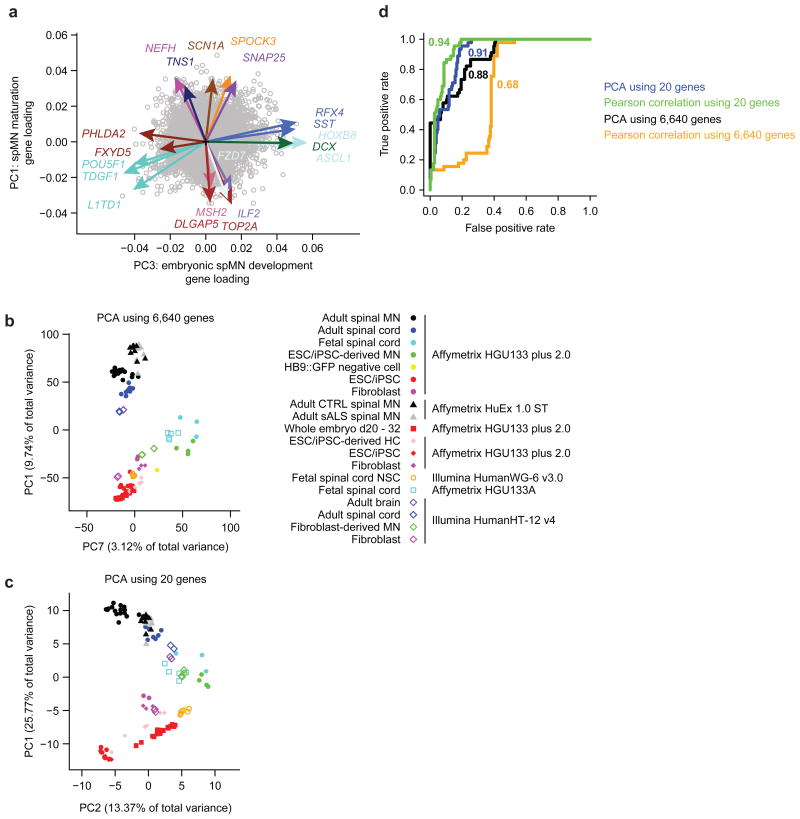
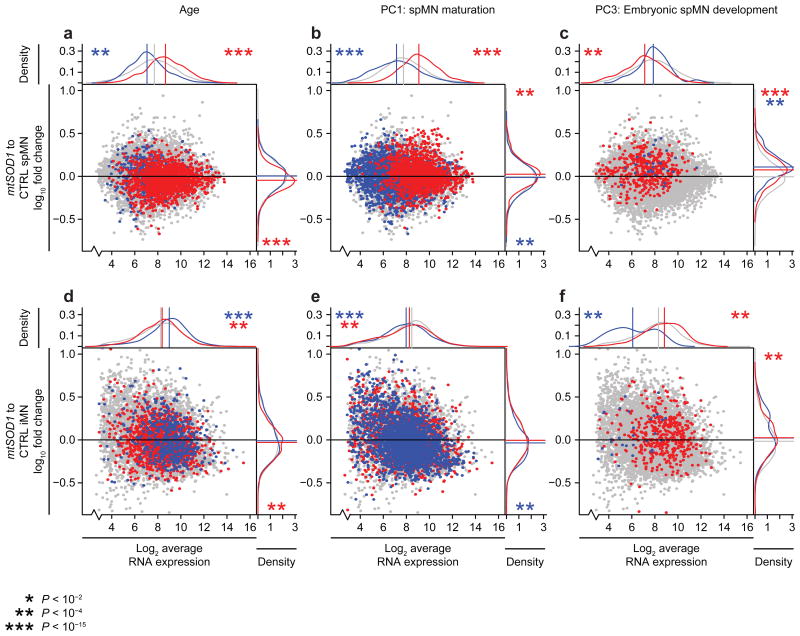
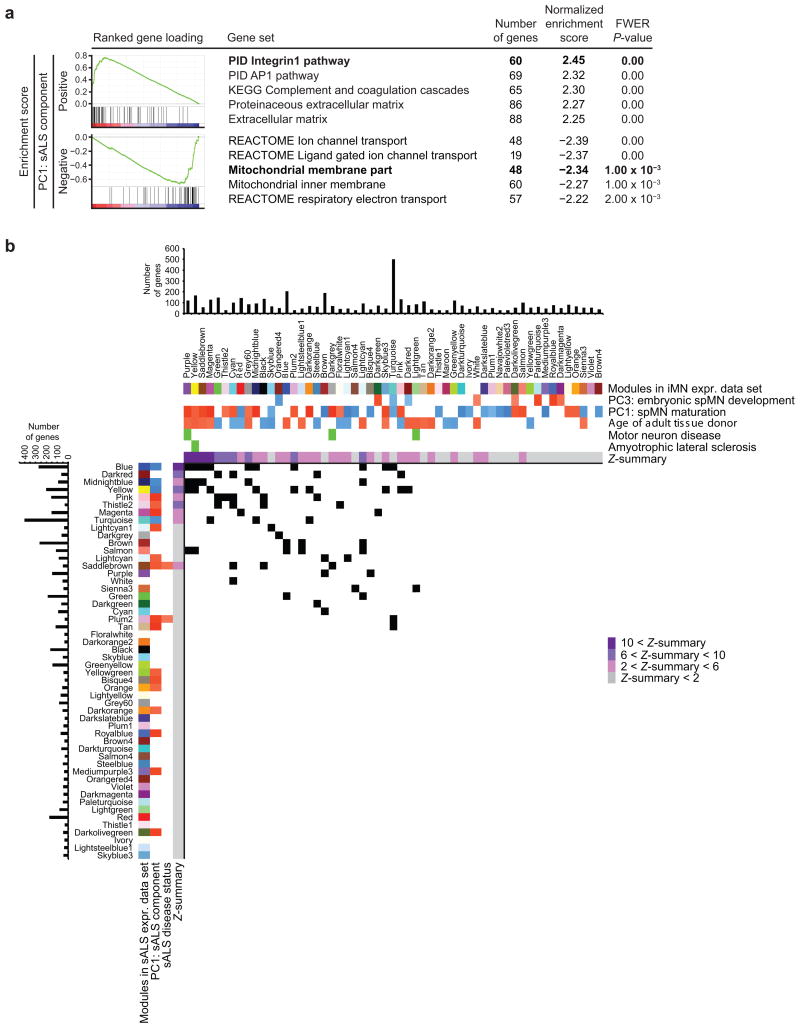
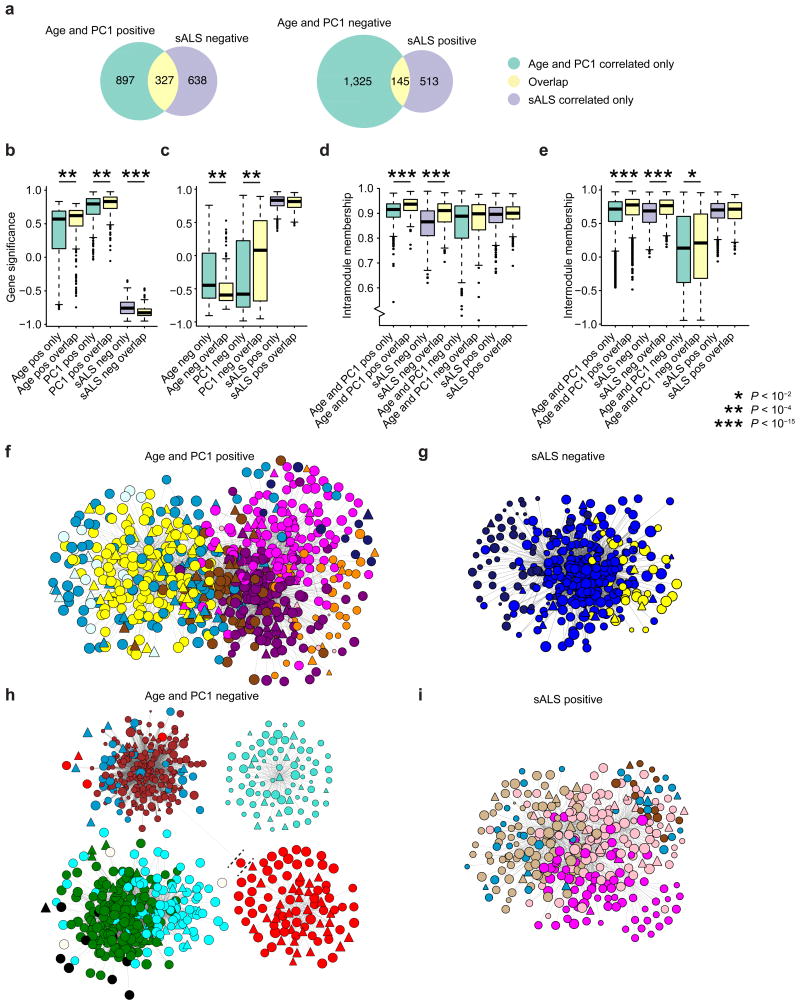
Modeling amyotrophic lateral sclerosis (ALS) with human induced pluripotent stem cells (iPSCs) aims to reenact embryogenesis, maturation and aging of spinal motor neurons (spMNs) in vitro. As the maturity of spMNs grown in vitro compared to spMNs in vivo remains largely unaddressed, it is unclear to what extent this in vitro system captures critical aspects of spMN development and molecular signatures associated with ALS. Here, we compared transcriptomes among iPSC-derived spMNs, fetal spinal tissues and adult spinal tissues. This approach produced a maturation scale revealing that iPSC-derived spMNs were more similar to fetal spinal tissue than to adult spMNs. Additionally, we resolved gene networks and pathways associated with spMN maturation and aging. These networks enriched for pathogenic familial ALS genetic variants and were disrupted in sporadic ALS spMNs. Altogether, our findings suggest that developing strategies to further mature and age iPSC-derived spMNs will provide more effective iPSC models of ALS pathology.


Figures

Figure 1
Figure 1
iPSC-derived MNs resemble fetal rather than adult MNs. (a) Immunostaining of iMNs used in expression profiling. ChAT (red) and SMI-32 (green) positive cells indicate the presence of MNs differentiated from iPSCs. Nuclear DAPI stains are shown in blue. n = 3 independent experiments and differentiation efficiency is quantified by ChAT- and SMI-32-double positive motor neurons. Scale bar = 4.75 μm. (b) Immunofluorescence staining of a 63-day-old fetal spinal cord. Inset depicts ISL1 (red) and SMI-32 (green) positive cells in the motor horn with ventrally projecting processes, indicating the presence of MNs at this developmental stage. Nuclear DAPI stains are shown in blue. Scale bars = 200 μm. (c) Unsupervised hierarchical clustering of 10,605 mRNA transcripts in n = 43 samples. Heatmap indicates Pearson's correlation between pairwise sample comparisons and dendrogram indicates average linkage distance between samples. The color legend for tissue types is indicated to the left and refers to d as well. (d) Principal component analysis of 10,605 mRNA transcripts in n = 43 samples. Sample coordinates along Principal components (PC) 1 and 3 are shown. The percentages of total variance are 14.61% and 7.01% for PC1 and PC3, respectively. Sample colors refer to c. Arrows depict the progression of fibroblasts (magenta) reprogrammed to iPSCs (red), the subsequent differentiation of iPSCs into either HB9::GFP negative cells (yellow) or HB9::GFP positive MNs (green), which project towards fetal spinal cords (cyan). Arrows also depict the progression of fetal spinal cords towards adult spinal tissues (blue and black). The days post conception of fetal spinal cord donors are indicated next to the cyan data points. (e) Gene set enrichment analysis of ranked gene loadings from PC1 and PC3 for gene ontology (GO) terms. “Positive” and “Negative” categories indicate GO terms enriched among genes whose loadings contribute most to the respective positive or negative direction of each principal component. Enriched GO terms for each category are listed along with family-wise error rate (FWER) corrected P-values. Enrichment plots are shown for bolded GO terms. For additional information, see Supplementary Fig. 1 (for all PCs and linear model statistics), Supplementary Tables 1a (for sample meta data), 2a (for linear expression values), and 2b (for full list of significantly enriched gene sets and P-values).
Figure 2
Figure 2
Network analysis resolves co-expression modules. (a) WGCNA clustered 10,605 genes across pluripotent cells, iMNs, fetal spinal tissues, and adult spinal tissues based on similar network topology (n = 40 samples). Height metric on dendrogram indicates topological overlap (TO) distance between genes. A dynamic tree-cutting algorithm grouped tightly networked genes, illustrated as low hanging branches, into 55 modules represented by arbitrary colors directly below the branches. Genes falling onto the predominant light grey color are not classified into any module. (b) Upper and middle panel: Heatmap indicates Pearson's correlation of module eigengenes with 5 sample traits. n = number of samples for which there is data for the indicated sample trait, and thus used in the correlation. Outlined panels indicate correlations with a Bonferroni-corrected P-value < 0.01, and these modules were kept for subsequent GO analysis. Lower panel: Gene variants associated with diseases in the ClinVar database were tested against each of the 55 modules for enrichment. n = number of genes with variants associated with the indicated disease, represented on the human microarray platform, and thus used in the enrichment analysis. Green heatmap indicates the Benjamini-Hochberg corrected negative log10 P-value from each hypergeometric test. Corrected P-values < 0.05 are called significant and outlined in black. This data is also shown in Fig. 5b. (c) For each module eigengene that significantly correlates (Positive) or anti-correlates (Negative) with age, PC1, or PC3 (Bonferroni-corrected P-value < 0.01), the module eigengene expression values are graphed in a scatter plot against either sample age or PC coordinate. Locally weighted scatterplot smoothing lines are graphed for each module. (d) Chow-Ruskey diagram illustrating the number of overlapping and distinct GO terms (Bonferroni-corrected P-value < 0.05) enriched in modules identified as significantly correlated or anti-correlated to age (AGEpos or AGEneg, respectively) or spMN maturation (PC1pos or PC1neg, respectively). Representative pathways are listed in grey boxes extending from diagram, along with the lowest Bonferroni-corrected P-values across all modules. For additional information, see Supplementary Fig. 2 (for additional WGCNA and Chow-Ruskey diagrams), Supplementary Tables 2a (for linear expression values), 2c (for module assignments and properties), 2d, 2e (for gene set enrichments and P-values), and 2j (for module-trait correlations, P-values, and Clinvar enrichment P-values).
Figure 3
Figure 3
Principal component and network analyses reveal key spMN maturation and embryonic development markers. (a) Gene loadings for 20 genes selected to best represent spMN maturation and embryonic spMN development. Colored arrows and gene labels depict gene loadings and module assignments for the 20 genes along PC1 and PC3. Open grey circles represent gene loadings for 10,585 genes not selected for the panel. PCA was performed on n = 43 samples depicted in Fig. 1d. (b) Principal component analysis performed on 6,640 quantile normalized gene expression values across 120 samples. Samples are plotted by their coordinates along PC1 and PC7. Sample legend is shown on the right. Colors of data points indicate similar sample types, and shapes of data points indicate the study from which the data were obtained. Microarray platforms are also indicated. (c) As in b, except PCA was performed using 20 genes depicted in a. Samples are plotted by their coordinates along PC1 and PC2. Sample legend is the same as for b. (d) Receiver-operator characteristic analysis performed on four methods classifying n = 77 samples in the validation data set as pluripotent stem cells, fetal-like cells, or adult spinal cord cells. Classifications were based on sample correlation to the median expression values of target cell types in the training data set using 6,640 genes (red) or 20 genes (green) or based on sample coordinates along the spMN maturation or embryonic development principal components using 6,640 genes (black) or 20 genes (blue). The area under the curve is shown next to each like-colored curve, and summarizes the overall performance of each classification method. For additional information, see Supplementary Fig. 3 (validation data), Supplementary Tables 1a (for sample meta data), 2c (for module assignments and properties), 2fi (for gene scoring properties), 3a (for qPCR primer sequences), and 3b (for normalized linear expression values used in validation analyses).
Figure 4
Figure 4
Gene expression networks are distinctively affected by familial ALS in spMNs and iMNs. Scatter and density plots depicting expression levels and mtSOD1-induced fold changes of age-, spMN maturation-, or embryonic spMN development-associated module genes as they were defined by WGCNA performed on the expression data set lacking ALS spMNs (Supplementary Fig. 2a). This was done to prevent modules from being defined by mtSOD1-induced gene expression changes in spMNs. Grey data points indicate no membership in module categories, red data points indicate membership in correlated modules, and blue data points indicate membership in anti-correlated modules. Grey data points are plotted behind red and blue data points in all panels. Red data points are plotted in front of blue data points in a and b. Blue data points are plotted in front of red data points in cf. 8,830 overlapping genes represented in both spMN and iMN data sets are shown in each plot. X-axis indicates the log2 average RNA expression values among all mtSOD1 and control (CTRL) samples. Y-axis indicates the log10 fold change in average RNA expression when comparing mtSOD1 to control samples, and the scale has cut off some outlier data points in order to visualize distribution shifts. The density plots account for all data points in the expression set, and the straight lines mark the median value of each distribution. Asterisks indicate the Kolmogorov-Smirnov two-sided P-value for like-colored categories tested against the grey distribution, and its location indicates the direction of the shifted distributions. (ac) mtSOD1 (n = 3) versus control (n = 3) spMNs [9]. (df) mtSOD1 (n = 2) versus control (n= 3) iMNs [20]. For additional information, see Supplementary Tables 2c (for module assignments and properties), 4a (for linear expression values and module assignments), and 4b (for Kolmogorov-Smirnov test statistics and P-values).
Figure 5
Figure 5
spMN maturation and age modules are dysregulated in sporadic ALS. (a) Gene set enrichment analysis of 15,614 ranked gene loadings from PC1 for pathways and GO terms. “Positive” and “Negative” categories indicate gene sets enriched among genes whose loadings contribute most to the respective positive or negative direction of the sALS component (PC1 in a PCA performed on n = 22 samples). Enriched gene sets for each category are listed along with family-wise error rate (FWER) corrected P-values. Enrichment plots are shown for bolded gene sets. (b) For each of the 52 sALS modules, a hypergeometric test was performed to detect enrichment for genes from each of the 55 iMN modules. Upper panel: iMN modules are displayed along with the sample traits with which they are significantly associated, as identified and also shown in Fig. 2b. Enrichment for ClinVar pathogenic variants in motor neuron disease or ALS is also shown. The Z-summary value for each iMN module measures the extent of module preservation in the sALS data set. For the likelihood of module preservation, Z-summary > 10 indicates strong evidence; 10 > Z-summary > 2 indicates moderate to weak evidence, and 2 > Z-summary indicates no evidence. Bar graphs above indicate the number of genes assigned to each iMN module that were also represented by probe sets on the Affymetrix Human Exon 1.0 ST Array. Left panel: sALS modules are displayed along with the sample traits with which they are significantly correlated or anti-correlated, as identified in Supplementary Fig. 4d. The Z-summary value for each sALS module measures the extent of module preservation in the iMN data set. Bar graphs to the left indicate the number of genes assigned to each sALS module that were also represented by probe sets on the Affymetrix GeneChip Human Genome U133 Plus 2.0 Array. A matrix of P-values from hypergeometric tests performed for each iMN and sALS module overlap were corrected by the Benjamini-Hochberg method, and subsequent P-values < 0.05 are marked as a black square panels and illustrated in the matrix diagram. For additional information, see Supplementary Figs. 4 (for all PCs and linear model statistics, WGCNA), 5 (for module preservation statistics and intramodule membership of genetic variants), 6 (for Chow-Ruskey diagrams), Supplementary Tables 2c (for iMN module assignments and properties), 5a (for linear expression values of sALS data set), 5c (for sALS module assignments and properties), 5d (for module preservation statistics), 5b, 5e, 5f (for full lists of significantly enriched gene sets and P-values), and 5g (for hypergeometric test P-values).
Figure 6
Figure 6
Genes associated with spMN maturation, aging, and sALS tend to be hub genes. (a) Overlap analysis of genes that are represented in WGCNA modules independently built in either the iMN expression data set or in the sALS expression data set. Modules built from the iMN data set are classified as Age positive or negative based on whether their module eigengene significantly correlates or anti-correlates, respectively, with the age of tissue donor from the iMN data set. Modules built from the iMN data set are classified as PC1 positive or negative based on whether their module eigengene significantly correlates or anti-correlates, respectively, with PC1 in the PCA performed on the iMN data set. To be included into the Age and PC1 positive group, genes must be classified as either Age positive, PC1 positive, or both. Additionally, their modules must have significant overlap, based on Fig. 5b, with at least one sALS module that correlates with the sALS component. These criteria are likewise for the Age and PC1 negative group which overlaps with sALS positive modules. Modules built from the sALS data set are similarly classified based on their relationship to the PCA performed on the sALS data set. Venn diagrams indicate the number of genes assigned to each class. (b) Boxplots of gene significance for the overlapping and non-overlapping genes from the comparison depicted in a, left. Asterisks indicate P-values determined by the Wilcoxon rank-sum test. For the “Age pos only” and “Age pos overlap” genes, the y-axis indicates gene significance values against age in the iMN expression data set. For the “PC1 pos only” and “PC1 pos overlap” genes, the y-axis indicates gene significance values against PC1 in the iMN expression data set. For the “sALS neg only” and “sALS neg overlap” genes, the y-axis indicates gene significance values against PC1 in the sALS expression data set. In each boxplot, the center line is the median, the lower and upper limits of the box are respectively the first and third quartile, and the lower and upper whiskers extend to either the respective minimum or maximum values of the distribution, or up to 1.5 times the interquartile range. Outliers are plotted as open circles. (c) Similar presentation as in b, except applied to genes in a, right. For the “Age neg only” and “Age neg overlap” genes, the y-axis indicates gene significance values against age in the iMN expression data set. For the “PC1 neg only” and “PC1 neg overlap” genes, the y-axis indicates gene significance values against PC1 in the iMN expression data set. For the “sALS pos only” and “sALS pos overlap” genes, the y-axis indicates gene significance values against PC1 in the sALS expression data set. (d) Boxplots of intramodule membership for the genes in a. (e) Boxplots of intermodule membership for the genes in a. (f) Cytoscape network maps for iMN gene modules significantly correlated to age and spMN maturation (PC1) in the iMN expression data set. The top 1% of gene-to-gene connections is shown (627 nodes and 3,197 edges). Node colors indicate module assignments. Circular nodes represent genes correlated with age and spMN maturation in the iMN expression data set, and also anti-correlated with the sALS component in the sALS expression data set. Triangular nodes represent genes detected in the iMN modules that correlate with age and spMN maturation, but are not detected in sALS modules that anti-correlate with the sALS component. The relative sizes of all nodes reflect their gene significance towards age in the iMN expression data set. The 99th percentile of edge weights were filtered for display and plotted using the prefuse force layout method. (g) As in f, except for sALS gene modules significantly anti-correlated to the sALS component in the sALS expression data set (323 nodes and 2,886 edges). Larger nodes in this instance have gene significance values closer to -1 and are therefore more anti-correlated to the sALS component. (h) As in f, except for iMN gene modules significantly anti-correlated to age and spMN maturation (PC1) in the iMN expression data set (669 nodes and 6,175 edges). Larger nodes have gene significance values closer to -1 and are therefore more anti-correlated to age. Since there are three distinct, contiguous network clusters with no edges connecting them, they were rotated and repositioned relative to each other so that node shapes are more visible. Therefore, node-to-node spatial relationships within, but not across, contiguous network clusters are accurate. Edges that intersect with dashed lines were shortened and repositioned in order to scale the diagram for visibility. No other modifications to the layout were made. (i) As in g, except for sALS gene modules significantly correlated to the sALS component in the sALS expression data set (312 nodes and 878 edges). Larger nodes have greater gene significance towards the sALS component. For additional information, see Supplementary Tables 2c (for iMN module assignments and properties), 2d (for full lists of significantly enriched GO terms and P-values), 2e (for comparison of gene set enrichments), 5c (for sALS module assignments and properties), 5e (for full lists of significantly enriched GO terms and P-values), 5f (for comparison of gene set enrichments), and 6 (for Wilcoxon rank-sum test statistics).

References

    1. Hardiman O, van den Berg LH, Kiernan MC. Clinical diagnosis and management of amyotrophic lateral sclerosis. Nat Rev Neurol. 2011;7(11):639–49. - PubMed
    1. Dimos JT, et al. Induced pluripotent stem cells generated from patients with ALS can be differentiated into motor neurons. Science. 2008;321(5893):1218–21. - PubMed
    1. Sterneckert JL, Reinhardt P, Scholer HR. Investigating human disease using stem cell models. Nat Rev Genet. 2014;15(9):625–39. - PubMed
    1. Jessell TM. Neuronal specification in the spinal cord: inductive signals and transcriptional codes. Nat Rev Genet. 2000;1(1):20–9. - PubMed
    1. Wichterle H, et al. Directed differentiation of embryonic stem cells into motor neurons. Cell. 2002;110(3):385–97. - PubMed

Publication types

MeSH terms