. 2016 Jul 16:9:144.
doi: 10.1186/s13068-016-0548-4. eCollection 2016.

Lessons learned from the microbial ecology resulting from different inoculation strategies for biogas production from waste products of the bioethanol/sugar industry

Affiliations

Lessons learned from the microbial ecology resulting from different inoculation strategies for biogas production from waste products of the bioethanol/sugar industry

Athaydes Francisco Leite et al. Biotechnol Biofuels. .

Abstract

Background: During strategic planning of a biogas plant, the local availability of resources for start-up and operation should be taken into consideration for a cost-efficient process. Because most bioethanol/sugar industries in Brazil are located in remote areas, the use of fresh cattle manure from local farms could be a solution for the inoculation of the biogas process. This study investigated the diversity and dynamics of bacterial and archaeal communities and the performance of biogas reactors inoculated with manure and a mixed inoculum from different biogas reactors as for a controlled start-up until steady state.

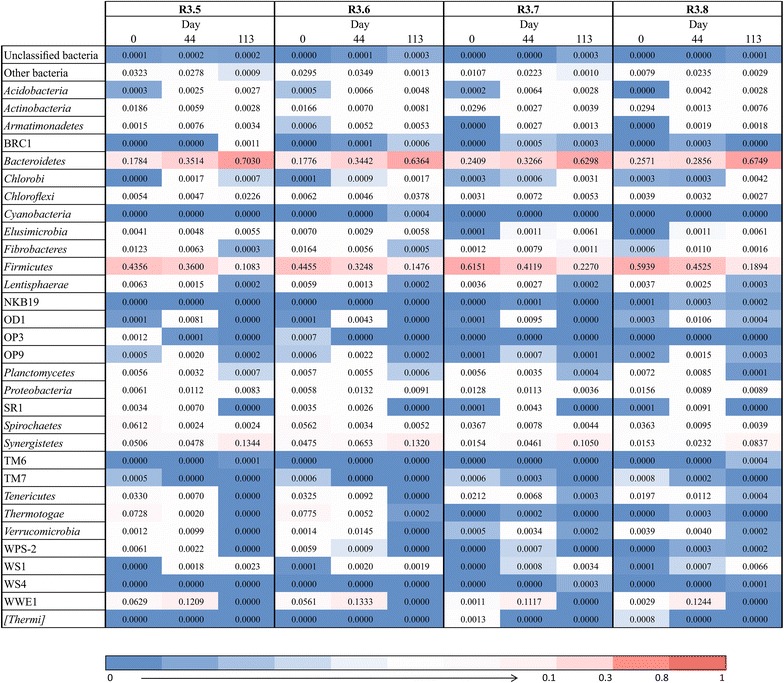
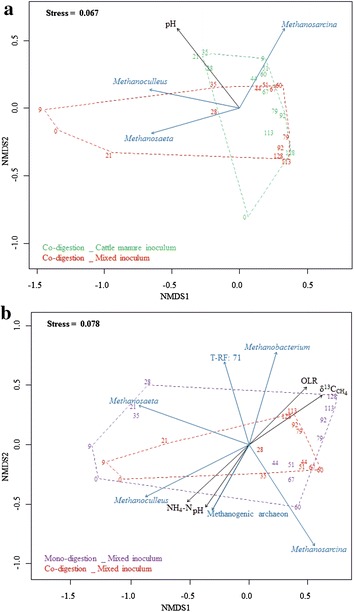
Results: Laboratory-scale biogas reactors were fed semi-continuously with sugarcane filter cake alone (mono-digestion) or together with bagasse (co-digestion). At the initial start-up, the reactors inoculated with the mixed inoculum displayed a less diverse taxonomic composition, but with higher presence of significant abundances compared to reactors inoculated with manure. However, in the final steady state, the communities of the differently inoculated reactors were very similarly characterized by predominance of the methanogenic genera Methanosarcina and Methanobacterium, the bacterial families Bacteroidaceae, Prevotellaceae and Porphyromonadaceae (phylum Bacteroidetes) and Synergistaceae (phylum Synergistetes). In the mono-digestion reactors, the methanogenic communities varied greater than in the co-digestion reactors independently of the inoculation strategy.

Conclusion: The microbial communities involved in the biogas production from waste products of the Brazilian bioethanol/sugar industry were relatively similar and stable at the reactor's steady phase independently of the inoculum source (manure or mixed inoculum). Therefore, the locally available manure can be used as inoculum for start-up of the biogas process, since it also contains the microbial resources needed. The strong fluctuation of methanogenic communities in mono-digestion reactors indicates higher risk of process instability than in co-digestion reactors.

Keywords: 454 Pyrosequencing; Bioethanol/sugar waste; Biogas process; Cattle manure; Inoculation; Methanogens.


Figures

Fig. 1
Fig. 1
Major process parameters during the anaerobic digestion of filter cake and its co-digestion with bagasse in different inoculation strategies (MIX and FCM). The data showed in this figure was adapted from our previous study [4]. The process parameters data corresponds to the same sampling time of the digestate and the biogas for the molecular and isotopic analyses, respectively
Fig. 2
Fig. 2
Phylogenetic composition and succession of the bacterial communities. Heatmap displaying the relative abundance of the bacterial communities at the phylum level along the experiment using different inoculation strategies (MIX and FCM) for the co-digestion of filter cake and bagasse. The relative abundances were based on the 454-pyrosequencing of 16S ribosomal RNA gene amplicons
Fig. 3
Fig. 3
Venn diagram of the core OTUs (a) and phyla (b) of the bacterial communities. Three distinct sampling times during experiments with different inoculation strategies (MIX and FCM) for the co-digestion of filter cake and bagasse were assessed. The 18 core OTUs in the greyscale Venn diagram were from the 125, 224 and 110 core OTUs identified in the four reactors at day 0, 44 and 113, respectively. In the same way, the 11 core phyla presented also in a greyscale Venn diagram were from the 17, 23 and 16 core phyla found in all reactors at day 0, 44 and 113, respectively. The Venn diagrams were prepared according to Oliveros [52]
Fig. 4
Fig. 4
The NMDS plot analyses of the bacterial communities (phylum level). The results were based on the pyrosequencing data of the 16S ribosomal RNA genes. The data points are numbered according to specific sampling days. The blue arrows indicate the highly significant (p < 0.05) bacterial phyla, whereas the black arrows represent the highly significant (p < 0.05) reactor parameters as correlation vectors of the bacterial community succession. The arrow length shows the correlation with the ordination axis, while the arrow direction corresponds to the community structures
Fig. 5
Fig. 5
Heatmap composing the T-RFLP profiles of the methanogenic community dynamics. The relative abundances are shown according to the sampling days of the experiments with different inoculation strategies (MIX and FCM) and digestion setups with filter cake and bagasse. Color intensity increases with relative abundance. Two digestate samples for each reactor were analyzed on every sampling day. Due to the high similarity of these samples, an average was calculated to show a more representative T-RFLP profile of each reactor
Fig. 6
Fig. 6
NMDS plot analyses of the methanogenic T-RFLP profiles and its correlation with reactor parameters. The hulls show the effect of the inoculation strategy (MIX vs. FCM) using the co-digestion setup (a), and the effect of the substrate (mono vs. co-digestion) applying MIX inoculum (b). The data points are numbered according to specific sampling days. The blue arrows indicate the highly significant (p < 0.001) methanogens, whereas the black arrows represent the highly significant (p < 0.001) reactor parameters as correlation vectors of the methanogenic community dynamics. The arrow length shows the correlation with the ordination axis, while the arrow direction corresponds to the community structures
Fig. 7
Fig. 7
Biogas isotope composition dynamics. The isotope signatures were plotted according to δ13C (a) and δ2H (c) of methane and δ13C of carbon dioxide (b) along the experiment with different inoculation strategies and digestion setups. The error bars with the standard errors are shown with the confidence interval of 95 % for the δ13C values and 65 % for the δ2H values
Fig. 8
Fig. 8
Determination of the potential predominant methanogenic pathway. The estimate dynamics shifts were based on the αC calculation (a) and on the correlation of δ2H and δ13C of methane. The hulls indicate the effect of the different inoculation strategies (b) and digestion setups (c) on the methanogenic pathways. The sampling days are plotted together with the representative shape point

References

    1. Leite AF, Janke L, Harms H, Zang JW, Fonseca-Zang WA, Stinner W, Nikolausz M. Assessment of the variations in characteristics and methane potential of major waste products from the Brazilian bioethanol industry along an operating season. Energy Fuels. 2015;29(7):4022–4029. doi: 10.1021/ef502807s. - DOI
    1. Janke L, Leite A, Nikolausz M, Schmidt T, Liebetrau J, Nelles M, Stinner W. Biogas production from sugarcane waste: assessment on kinetic challenges for process designing. Int J Mol Sci. 2015;16:20685–20703. doi: 10.3390/ijms160920685. - DOI - PMC - PubMed
    1. Janke L, Leite A, Wedwitschka H, Schmidt T, Nikolausz M, Stinner W. Biomethane Production Integrated to the Brazilian Sugarcane Industry: The Case Study of São Paulo State. In: Proceedings of the 22nd European biomass conference and exhibition. 2014. p. 1295–9.
    1. Janke L, Leite AF, Nikolausz M, Radetski CM, Nelles M, Stinner W. Comparison of start-up strategies and process performance during semi-continuous anaerobic digestion of sugarcane filter cake co-digested with bagasse. Waste Manag. 2016;48:199–208. doi: 10.1016/j.wasman.2015.11.007. - DOI - PubMed
    1. Demirel B. Major pathway of methane formation from energy crops in agricultural biogas digesters. Crit Rev Environ Sci Technol. 2014;44:199–222. doi: 10.1080/10643389.2012.710452. - DOI

LinkOut - more resources