. 2016 Jul 15:4:18.
doi: 10.1186/s40462-016-0083-8. eCollection 2016.

Collective behavior as a driver of critical transitions in migratory populations

Affiliations

Collective behavior as a driver of critical transitions in migratory populations

Andrew Berdahl et al. Mov Ecol. .

Abstract

Background: Mass migrations are among the most striking examples of animal movement in the natural world. Such migrations are major drivers of ecosystem processes and strongly influence the survival and fecundity of individuals. For migratory animals, a formidable challenge is to find their way over long distances and through complex, dynamic environments. However, recent theoretical and empirical work suggests that by traveling in groups, individuals are able to overcome these challenges and increase their ability to navigate. Here we use models to explore the implications of collective navigation on migratory, and population, dynamics, for both breeding migrations (to-and-fro migrations between distinct, fixed, end-points) and feeding migrations (loop migrations that track favorable conditions).

Results: We show that while collective navigation does improve a population's ability to migrate accurately, it can lead to Allee effects, causing the sudden collapse of populations if numbers fall below a critical threshold. In some scenarios, hysteresis prevents the migration from recovering even after the cause of the collapse has been removed. In collectively navigating populations that are locally adapted to specific breeding sites, a slight increase in mortality can cause a collapse of genetic population structure, rather than population size, making it more difficult to detect and prevent.

Conclusions: Despite the large interest in collective behavior and its ubiquity in many migratory species, there is a notable lack of studies considering the implications of social navigation on the ecological dynamics of migratory species. Here we highlight the potential for a previously overlooked Allee effect in socially migrating species that may be important for conservation and management of such species.

Keywords: Anadromous fish; Collective navigation; Dispersal; Local adaptation; Migration; Migratory birds; Migratory marine fish; Migratory ungulates; Population collapse.


Figures
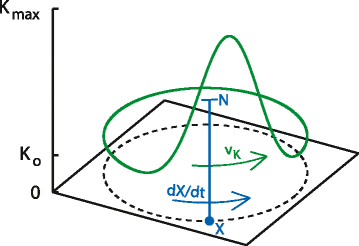
Fig. 1
Fig. 1
Feeding migration model schematic (Model 3). Space is restricted to a 1 dimonsional loop (black dashed line). The green curve shows the time-varying carrying capacity at all points in this space (Eq. 10). A patch of favorable conditions translates steadily through space with speed v K. The location and height of the blue bar indicate the location (X) and size (N) of the migratory population, respectively. The population tracks the patch with a speed, dXdt, that is dependent on the local strength of the resource gradient and the size of the population (Eq. 13). The z-axis applies to both carrying capacity (green curve) and population size (height of blue bar) and is thus in units of number of animals. See Additional files 2, 3, and 4 (Animation 1–3) for animations of the simulation
Fig. 2
Fig. 2
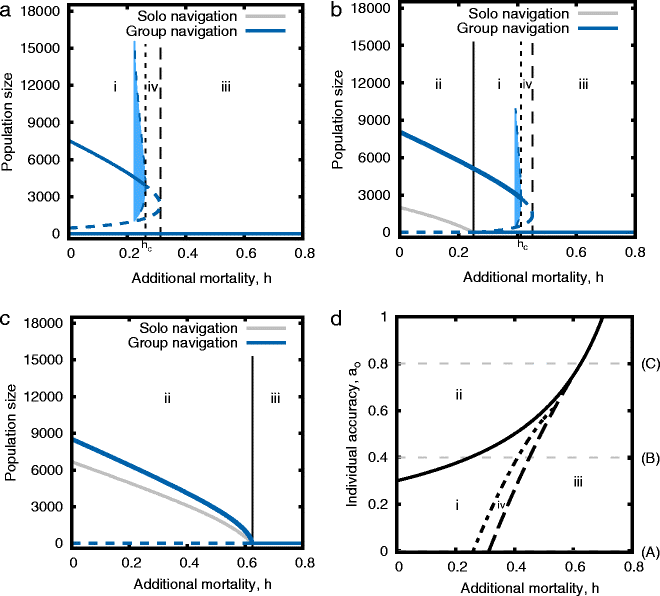
Collapse of breeding migration (Model 1). Panels ac show stationary solutions for N¯ from Eqs. (1) & (4) as a function of mortality, for individual accuracies of a o=0.0, 0.4 and 0.8 respectively. Results including collective navigation (a(U) as in Eq. (3)) are blue while those with independent navigation (a(U)=a o) are grey. The shaded blue regions depict an unstable limit cycle, inside of which the dynamics are locally attracted to the stable equilibrium within, while globally (and in response to extreme perturbations) the system collapses to the stable equilibrium where the population is extinct. Vertical lines correspond to the boundaries (bifurcation points) in panel d. Note in panel a the grey curve is not visible because it is equal to zero for all h. Panel d traces the branching point (solid line – Eq. (17)), Hopf point (dotted line) and limit point (dashed line) through h- a o space. Faint horizontal lines correspond to the cross-sections depicted in panels ac. The qualitatively distinct states of the system in the different parameter regions are: i) Group navigation is bistable [high N h|N h extinct], solo navigation is not possible; ii) Both group and solo navigation are possible, group navigating population densities are higher; iii & iv) Neither group nor solo migration can persist
Fig. 3
Fig. 3
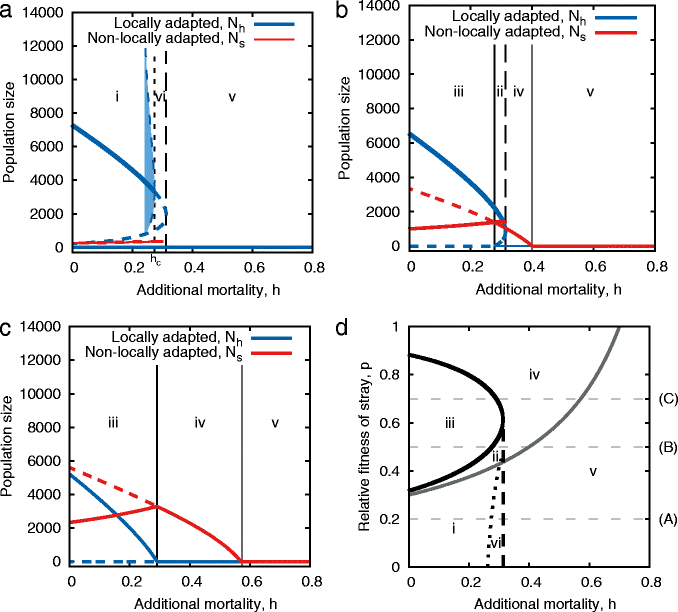
Collapse of population size and structure in multi-site breeding migration (Model 2). Panels ac show equilibrium population size from Eqs. (7)–(9) as a function of mortality, for relative fitness of non-locally adapted individuals of p=0.2, 0.5 and 0.7 respectively. Locally adapted populations (N h) are blue while those for non-locally adapted populations (N s) are red. See Fig. 2 legend for details. Panel d traces the branching points (solid lines), Hopf points (dotted lines) and limit points (dashed lines) through h-p space. The black and grey solid lines correspond to branching points for N h and N s respectively. The qualitatively distinct equilibrium states are: i) Bistable [high N h, low N s| both extinct]; ii) Bistable [high N h, low N s|N h extinct, N s present]; iii) Bistable [Both N h and N s present |N h extinct, N s present (Not stable to invasion by the N h type, however once out of the system it could take evolutionary time to recover them, so it may be stable on short time-scales.)]; iv) N h extinct, N s present; v & vi) Both extinct
Fig. 4
Fig. 4
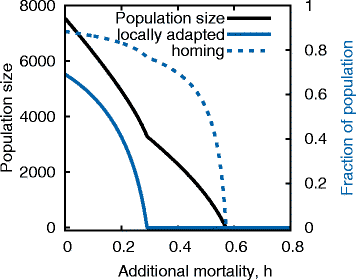
Collapse of local adaptation (Model 2). Equilibrium size of total population, N h+N s, (black curve), fraction of the population which is locally adapted, NhNh+Ns, (solid blue curve) and the fraction of the population which is returning to their natal site (dashed blue curve) as a function of additional mortality. Parameters are as in Fig. 3 c. For modest levels of local adaptation (here p=0.7) the population size declines nearly linearly as a function of additional mortality. However, the locally adapted fraction of the population crashes dramatically, and non-linearly, at a level of h for which the homing rate is still high and the population size seems robust
Fig. 5
Fig. 5
Collapse of feeding migration (Model 3). Numeric solutions for N¯ given the dynamics described in Eqs. (12) & (13). For low levels of additional mortality (x-axis) the system is bistable, exhibiting either a large population migrating at speed v K (blue curve) or a small, stationary population which relies on the background resource level, K o, with an occasional pulse when the favorable patch passes by (red curve). A limit point defines the critical level of h above which the migratory population cannot exist

References

    1. Wolf A, Doughty CE, Malhi Y. Lateral diffusion of nutrients by mammalian herbivores in terrestrial ecosystems. PLoS ONE. 2013;8(8):71352. doi: 10.1371/journal.pone.0071352. - DOI - PMC - PubMed
    1. Doughty CE, Wolf A, Malhi Y. The legacy of the pleistocene megafauna extinctions on nutrient availability in amazonia. Nat Geosci. 2013;6(9):761–4. doi: 10.1038/ngeo1895. - DOI
    1. Bauer S, Hoye B. Migratory animals couple biodiversity and ecosystem functioning worldwide. Science. 2014;344(6179):1242552. doi: 10.1126/science.1242552. - DOI - PubMed
    1. Estes RD. Gnu’s World: Serengeti Wildebeest Ecology and Life History. Oakland: University of California Press; 2014.
    1. Gould JL, Gould CG. Nature’s Compass: the Mystery of Animal Navigation. Princeton: Princeton University Press; 2012.

LinkOut - more resources