. 2016 Jun:6:10-25.
doi: 10.1016/j.nepig.2016.04.001. Epub 2016 May 3.

Cross-species Analyses Unravel the Complexity of H3K27me3 and H4K20me3 in the Context of Neural Stem Progenitor Cells

Affiliations

Cross-species Analyses Unravel the Complexity of H3K27me3 and H4K20me3 in the Context of Neural Stem Progenitor Cells

Christopher T Rhodes et al. Neuroepigenetics. 2016 Jun.

Abstract

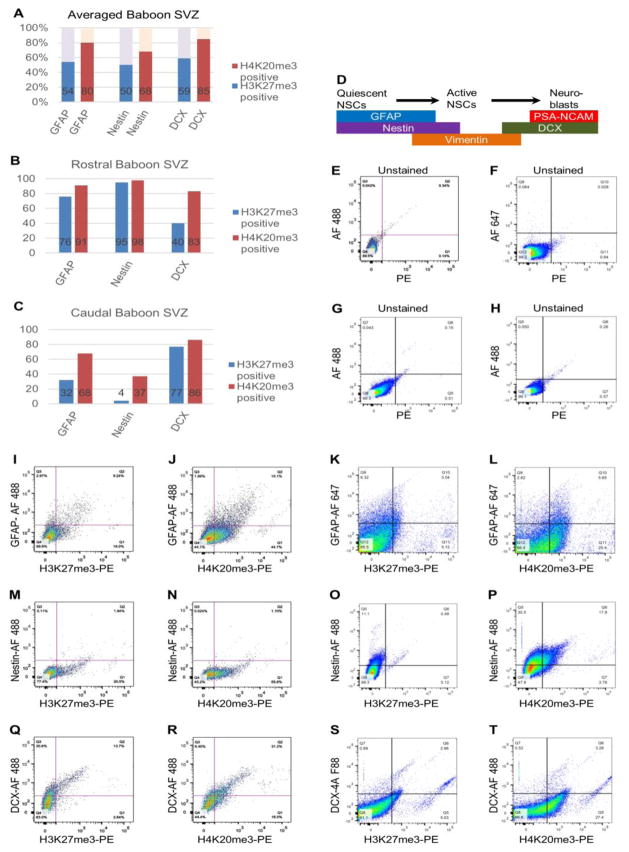
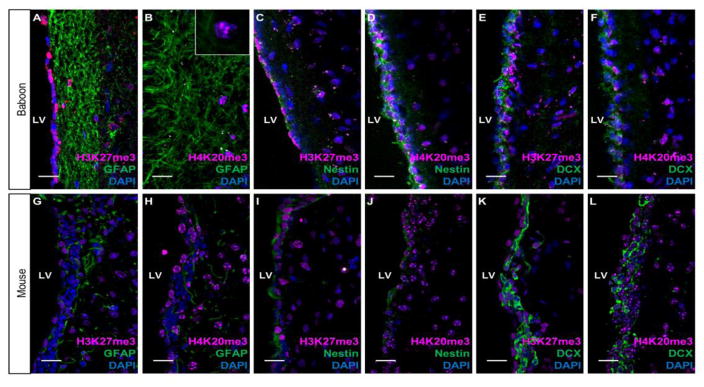
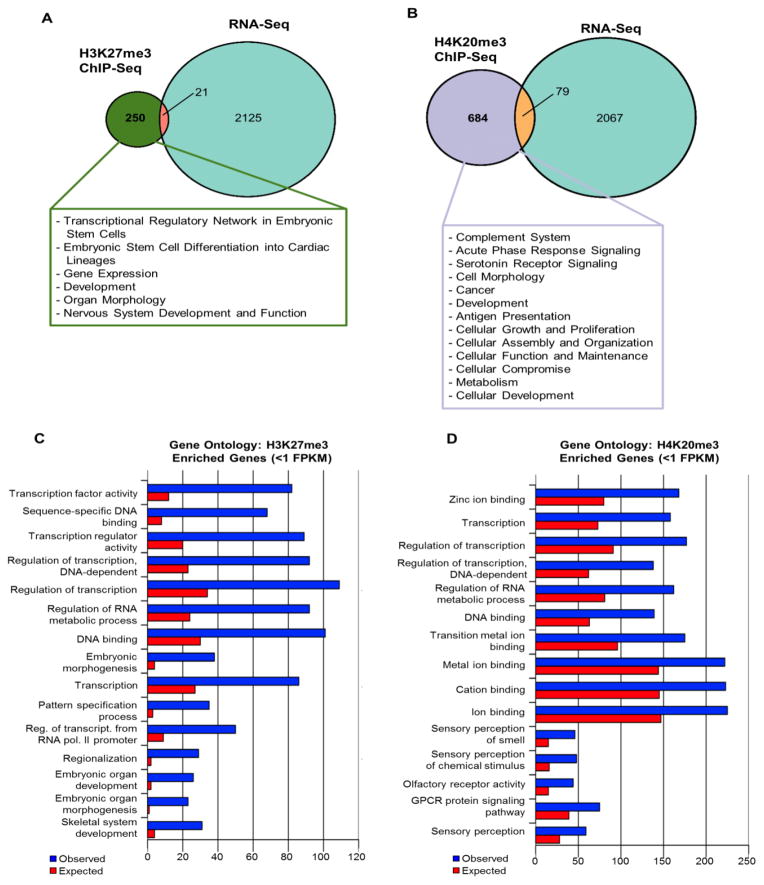
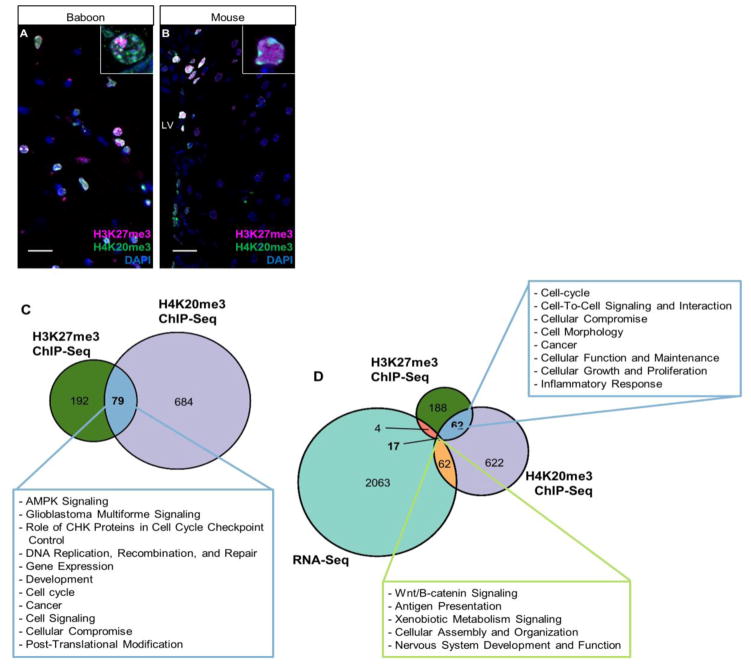
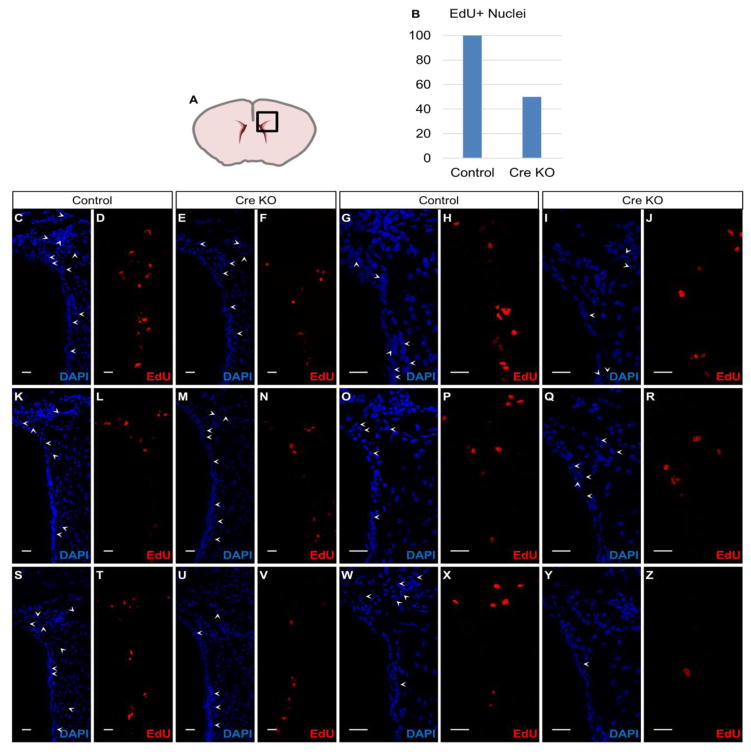
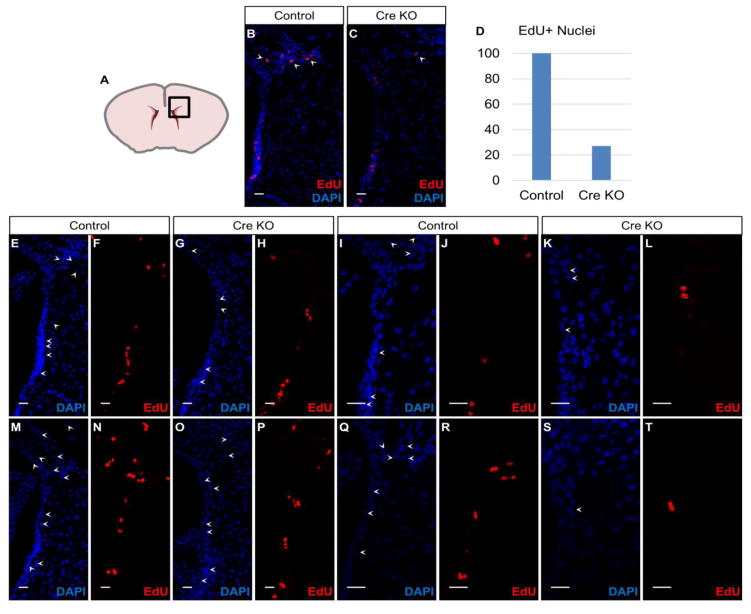
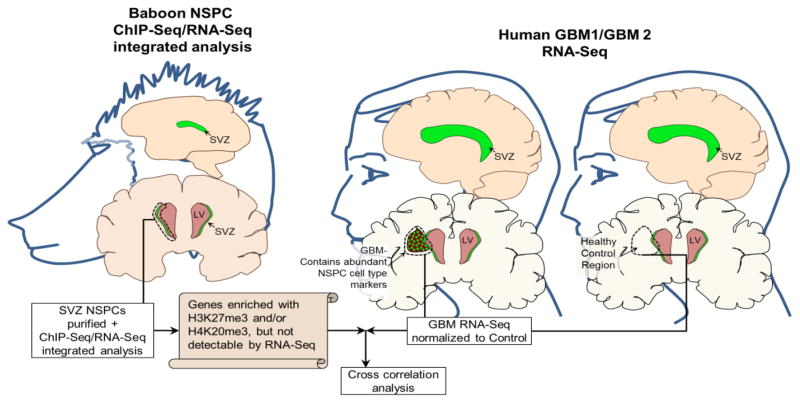
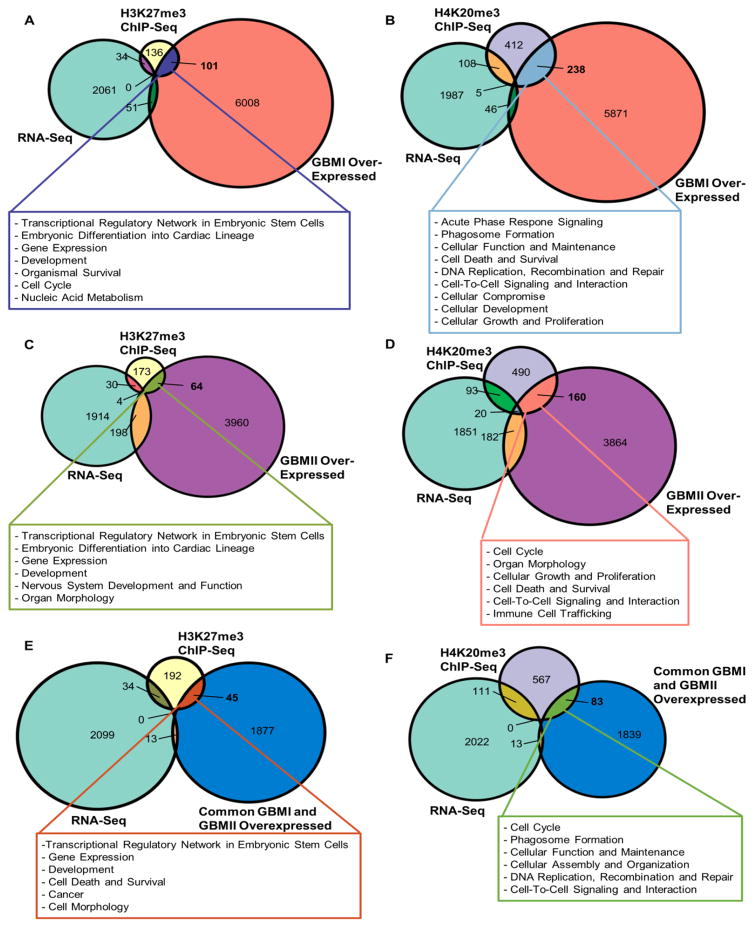
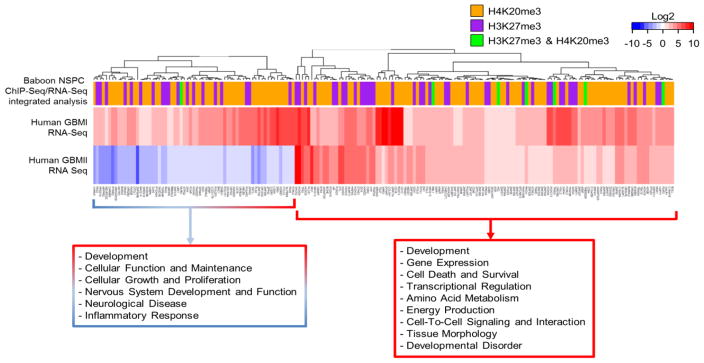
Neural stem progenitor cells (NSPCs) in the human subventricular zone (SVZ) potentially contribute to life-long neurogenesis, yet subtypes of glioblastoma multiforme (GBM) contain NSPC signatures that highlight the importance of cell fate regulation. Among numerous regulatory mechanisms, the post-translational methylations onto histone tails are crucial regulator of cell fate. The work presented here focuses on the role of two repressive chromatin marks tri-methylations on histone H3 lysine 27 (H3K27me3) and histone H4 lysine 20 (H4K20me3) in the adult NSPC within the SVZ. To best model healthy human NSPCs as they exist in vivo for epigenetic profiling of H3K27me3 and H4K20me3, we utilized NSPCs isolated from the adult SVZ of baboon brain (Papio anubis) with brain structure and genomic level similar to human. The putative role of H3K27me3 in normal NSPCs predominantly falls into the regulation of gene expression, cell cycle, and differentiation, whereas H4K20me3 is involved in DNA replication/repair, metabolism, and cell cycle. Using conditional knock-out mouse models to diminish Ezh2 and Suv4-20h responsible for H3K27me3 and H4K20me3, respectively, we found that both repressive marks have irrefutable function for cell cycle regulation in the NSPC population. While both EZH2/H3K27me3 and Suv4-20h/H4K20me3 have implication in cancers, our comparative genomics approach between healthy NSPCs and human GBM specimens revealed that substantial sets of genes enriched with H3K27me3 and H4K20me3 in the NSPCs are altered in the human GBM. In sum, our integrated analyses across species highlight important roles of H3K27me3 and H4K20me3 in normal and disease conditions in the context of NSPC.

Keywords: Chromatin Immunoprecipitation (ChIP); Cre recombinant protein; Enhancer of zeste (Human- Gene: EZH2, Protein: EZH2) (Mouse- Gene: Ezh2, Protein: Histone-lysine N-methyltransferase EZH2); Epigenetic Repression; Glioblastoma Multiforme (GBM); Neural Stem Progenitor Cells (NSPCs); Stereotaxic injection; Suppressor of variegation homolog 1 (Human- Gene: KMT5B or SUV420H1, Protein: lysine methyltransferase 5B, synonym Suv4-20h1) (Mouse- Gene: Suv4-20h1, synonym Kmt5b, Protein: Histone-lysine N-methyltransferase KMT5B, synonym Suv4-20h1); Suppressor of variegation homolog 2 (Human- Gene: KMT5C or SUV420H2, Protein: lysine methyltransferase 5C, synonym Suv4-20h2) (Mouse- Gene: Suv4-20h2, synonym Kmt5c, Protein: Histone-lysine N-methyltransferase KMT5C, synonym Suv4-20h2); tri-methylation at histone 3 lysine 27 (H3K27me3) and histone 4 lysine 20 (H4K20me3)..


Figures

Fig. 1
Fig. 1. Quantification of H3K27me3 or H4K20me3 co-localization with cell type markers in baboon SVZ by flow cytometry
(A) Summary of co-localization between H3K27me3 or H4K20me3 and SVZ subpopulations by flow cytometry. Bar chart shows the mean percentages of H3K27me3 or H4K20me3 enriched neural stem and progenitor populations purified from baboon rostral and caudal SVZ regions. GFAP labels quiescent NSCs, Nestin is a pan-NSC marker, while DCX marks early and migrating neuroblasts. Percent of H3K27me3 or H4K20me3 indicate mean proportion across rostral and caudal baboon SVZ regions. (B) Bar chart shows the relative percentages of H3K27me3 or H4K20me3 enriched neural stem and progenitor populations purified from baboon rostral SVZ. (C) Bar chart shows the relative percentages of H3K27me3 or H4K20me3 enriched neural stem and progenitor populations purified from baboon caudal SVZ. (D) Scheme dictates cell type specific markers expressed in NSPCs in the SVZ. (E) Scatterplot of whole unstained cells isolated from rostral baboon SVZ using Alexa Fluor 488 and PE channels (Unstained control for Figure 1I, 1J, 1M, 1N, 1Q, 1R). (F) Scatterplot of whole unstained cells isolated from caudal baboon SVZ using Alexa Fluor 647 and PE channels (Unstained control for Figure 1K, 1L). (G) Scatterplot of whole unstained cells isolated from caudal baboon SVZ using Alexa Fluor 488 and PE channels (Unstained control for Figure 1O and Figure 1P). (H) Scatterplot of whole unstained cells isolated from caudal baboon SVZ using Alexa Fluor 488 and PE channels (Unstained control for Figure 1S and Figure 1T). (I) Dual labeling by GFAP and H3K27me3 for undifferentiated cells of the rostral baboon SVZ. (J) Dual labeling by GFAP and H4K20me3 for undifferentiated cells of the rostral baboon SVZ. (K) Cells labeled with GFAP and H3K27me3 isolated from caudal baboon SVZ. (L) Cells labeled with GFAP and H4K20me3 isolated from caudal baboon SVZ. (M) Cells labeled with Nestin and H3K27me3 isolated from rostral baboon SVZ. (N) Cells labeled with Nestin and H4K20me3 isolated from rostral baboon SVZ. (O) Cells labeled with Nestin and H3K27me3 isolated from caudal baboon SVZ. (P) Cells labeled with Nestin and H4K20me3 isolated from caudal baboon SVZ. (Q) Cells labeled with DCX and H3K27me3 isolated from rostral baboon SVZ. (R) Cells labeled with DCX and H4K20me3 isolated from rostral baboon SVZ. (S) Cells labeled with DCX and H3K27me3 isolated from caudal baboon SVZ. (T) Cells labeled with DCX and H4K20me3 isolated from caudal baboon SVZ.
Fig. 2
Fig. 2
H3K27me3 and H4K20me3 distributions across SVZ subpopulations. Co-immunostaining of H3K27me3 or H4K20me3 with cell-type specific markers GFAP, Nestin, and DCX. Left panel presents coronal section of baboon brain and right panel presents coronal section of mouse brain. 40× magnification; Scale bar = 20 um. Inset shows 100× of H4K20me3 staining pattern.
Fig. 3
Fig. 3. H3K27me3 and H4K20me3 genome-wide enrichment patterns in baboon SVZ
(A) Proportional Venn diagram representations of genes enriched with H3K27me3 compared to RNA-Seq detectable genes as determined using expression threshold of FPKM > 1.0. Text box indicates IPA predicted functions correlated to genes enriched with H3K27me3 but lacking transcripts (≤1 FPKM). Green portion indicates H3K27me3 enriched genes with no detectable transcripts (≤1 FPKM) (n=250), orange portion indicates H3K27me3 genes with detectable RNA levels (>1 FPKM) (n=21) and light blue portion represents RNA-Seq genes with >1 FPKM but lacking H3K27me3 modifications (n=2125). (B) Proportional Venn diagram representations of genes enriched with H4K20me3 compared to RNA-Seq detectable genes as determined using expression threshold of FPKM > 1.0. Text box indicates IPA predicted functions correlated to genes enriched with H4K20me3 but lacking transcripts (≤1 FPKM). Purple portion indicates H4K20me3 enriched genes with no detectable transcripts (≤1 FPKM) (n=684); orange portion indicates H4K20me3 genes with detectable RNA levels (n=79); light blue depicts RNA-Seq genes with >1 FPKM but no H4K20me3 enrichment (n=2067). (C) Gene Ontology (GO) analysis of H3K27me3 enriched genes lacking detectable transcripts (≤1 FPKM) categorizes genes based on known biological processes or molecular functions and top 15 significant GO terms associated with H3K27me3 enriched genes with no expression (Top 15 GO categories had Bonferroni corrected p-values ranging from 1.89×10−43 to 2.22×10⁻¹⁴). Significance of GO terms was calculated based on binomial distribution model plus Bonferroni correction. (D) Gene Ontology (GO) analysis of H4K20me3 enriched genes lacking detectable transcripts (≤1 FPKM) for top 15 significant GO terms in either biological processes of molecular function categories (Top 15 GO categories had Bonferroni adjusted p-values between 1.57×10⁻²⁷ and 3.09×10⁻⁴). Significance of GO terms was calculated based on binomial distribution model plus Bonferroni correction.
Fig. 4
Fig. 4. Colocalization of H3K27me3 and H4K20me3 in NSPCs of baboon SVZ
(A) Co-immunostaining of H3K27me3 and H4K20me3 in baboon brain. Region imaged corresponds to coronal section of the astrocytic ribbon within baboon SVZ. 40× magnification; Scale bar = 20 um. Inset shows 100× of H3K27me3 and H4K20me3 staining patterns. (B) Co-immunostaining of H3K27me3 and H4K20me3 in mouse SVZ. 40× magnification; Scale bar = 20 um. Inset shows 100× of H3K27me3 and H4K20me3 staining patterns. (C) Proportional Venn diagram generated by comparing numbers of genes enriched by H3K27me3, H4K20me3 or both histone modifications. Green area represents H3K27me3 enriched genes (n=192), purple represents H4K20me3 enriched genes (n=684), and blue area represents genes enriched by H3K27me3 and H4K20me3 (n=79). Text box describes functions of H3K27me3/H4K20me3 dual-enriched genes predicted by Ingenuity Pathway Analysis (IPA) software using known biochemical pathways and constructing de novo interaction networks. (D) Proportional Venn diagram generated by comparing numbers of genes enriched by H3K27me3, H4K20me3 and genes detectable by RNA-Seq. Dark blue portion indicates genes enriched with H3K27me3 and H4K20me3 with no detectable transcription (≤1 FPKM) (n=62). Light green portion represents H3K27me3/H4K20me3 co-enriched genes with detectable RNA levels (>1 FPKM) (n=17).
Fig. 5
Fig. 5. EZH2/H3K27me3 influence cell cycle in the SVZ cells
(A) Scheme of coronal sectioned mouse brain indicates region of immunostaining. Multiple images of dorsal SVZ and RMS were taken along rostro-caudal axis at 20X and 40X to obtain representative images of DAPI – positive and EdU-positive nuclei. (B) Bargraph of EdU-positive nuclei within dorsal SVZ quantified using 40× magnification. Y-axis indicates percentage of cells which are EdU-positive compared to control. (C) DAPI counterstain depicts nuclei at dorsal SVZ and rostral migratory stream in R26RLacZ reporter mouse with wildtype Ezh2 allele 10 days post-stereotaxic Cre administration. 20X, Scale bar = 20 um. (D) 10 days post-stereotaxic Cre administration into a R26RLacZ reporter mouse with wildtype Ezh2 allele, EdU was detected 2 hours after intraperitoneal EdU injection. Cells undergoing DNA synthesis during the 2 hour window are detected as EdU -positive nuclei at dorsal SVZ and rostral migratory stream. 20X, Scale bar = 20 um. (E) DAPI counterstain depicts nuclei at dorsal SVZ and rostral migratory stream 10 days post-stereotaxic Cre administration in an Ezh2flox/flox:ROSAL/L knockout mouse with 2 copies of a floxed Ezh2 gene. 20X, Scale bar = 20 um. (F) 10 days post-stereotaxic Cre administration into an Ezh2flox/flox:ROSAL/L knockout mouse with 2 copies of a floxed Ezh2 gene, EdU was detected 2 hours after intraperitoneal EdU injection. The proportion of EdU-positive nuclei at the dorsal horn of the SVZ and RMS are diminished following stereotaxic injection into dorsal SVZ compared to Cre-injected R26RLacZ reporter mice. 20X, Scale bar = 20 um. (G) DAPI counterstain depicts nuclei at dorsal SVZ and rostral migratory stream in R26RLacZ reporter mouse with wildtype Ezh2 allele 10 days post-stereotaxic Cre administration. 40X, Scale bar = 20 um. (H) 10 days post-stereotaxic Cre administration into a R26RLacZ reporter mouse with wildtype Ezh2 allele, EdU was detected 2 hours after intraperitoneal EdU injection. Cells undergoing DNA synthesis during the 2 hour window are detected as EdU -positive nuclei at dorsal SVZ and rostral migratory stream. 40X, Scale bar = 20 um. (I) DAPI counterstain depicts nuclei at dorsal SVZ and rostral migratory stream 10 days post-stereotaxic Cre administration in an Ezh2flox/flox:ROSAL/L knockout mouse with 2 copies of a floxed Ezh2 gene. 40X, Scale bar = 20 um. (J) 10 days post-stereotaxic Cre administration into an Ezh2flox/flox:ROSAL/L knockout mouse with 2 copies of a floxed Ezh2 gene, EdU was detected 2 hours after intraperitoneal EdU injection. The proportion of EdU-positive nuclei at the dorsal horn of the SVZ and RMS are diminished following stereotaxic injection into dorsal SVZ compared to Cre-injected R26RLacZ reporter mice. 40X, Scale bar = 20 um. (K) DAPI counterstain depicts nuclei at dorsal SVZ and rostral migratory stream in R26RLacZ reporter mouse 10 days post-stereotaxic Cre administration. 20X, Scale bar = 20 um. (L) 10 days post-stereotaxic Cre administration into a R26RLacZ reporter mouse with wildtype Ezh2 allele, EdU was detected 2 hours after intraperitoneal EdU injection. 20X, Scale bar = 20 um. (M) DAPI counterstain depicts nuclei at dorsal SVZ and rostral migratory stream 10 days post-stereotaxic Cre administration in an Ezh2flox/flox:ROSAL/L knockout mouse. 20X, Scale bar = 20 um. (N) 10 days post-stereotaxic Cre administration into an Ezh2flox/flox:ROSAL/L knockout mouse with 2 copies of a floxed Ezh2 gene, EdU was detected 2 hours after intraperitoneal EdU injection. 20X, Scale bar = 20 um. (O) DAPI counterstain depicts nuclei at dorsal SVZ and rostral migratory stream in R26RLacZ reporter mouse 10 days post-stereotaxic Cre administration. 40X, Scale bar = 20 um. (P) 10 days post-stereotaxic Cre administration into a ROSA-LacZ reporter mouse with wildtype Ezh2 allele, EdU was detected 2 hours after intraperitoneal EdU injection. 40X, Scale bar = 20 um. (Q) DAPI counterstain depicts nuclei at dorsal SVZ and rostral migratory stream 10 days post-stereotaxic Cre administration in an Ezh2flox/flox:ROSAL/L knockout mouse. 40X, Scale bar = 20 um. (R) 10 days post-stereotaxic Cre administration into an Ezh2flox/flox:ROSAL/L knockout mouse with 2 copies of a floxed Ezh2 gene, EdU was detected 2 hours after intraperitoneal EdU injection. 40X, Scale bar = 20 um. (S) DAPI counterstain depicts nuclei at dorsal SVZ and rostral migratory stream in R26RLacZ reporter mouse 10 days post-stereotaxic Cre administration. 20X, Scale bar = 20 um. (T) 10 days post-stereotaxic Cre administration into a R26RLacZ reporter mouse with wildtype Ezh2 allele, EdU was detected 2 hours after intraperitoneal EdU injection. 20X, Scale bar = 20 um. (U) DAPI counterstain depicts nuclei at dorsal SVZ and rostral migratory stream 10 days post-stereotaxic Cre administration in an Ezh2flox/flox:ROSAL/L knockout mouse. 20X, Scale bar = 20 um. (V) 10 days post-stereotaxic Cre administration into an Ezh2flox/flox:ROSAL/L knockout mouse with 2 copies of a floxed Ezh2 gene, EdU was detected 2 hours after intraperitoneal EdU injection. 20X, Scale bar = 20 um. (W) DAPI counterstain depicts nuclei at dorsal SVZ and rostral migratory stream in R26RLacZ reporter mouse 10 days post-stereotaxic Cre administration. 40X, Scale bar = 20 um. (X) 10 days post-stereotaxic Cre administration into an R26RLacZ reporter mouse with wildtype Ezh2 allele, EdU was detected 2 hours after intraperitoneal EdU injection. 40X, Scale bar = 20 um. (Y) DAPI counterstain depicts nuclei at dorsal SVZ and rostral migratory stream 10 days post-stereotaxic Cre administration in an Ezh2flox/flox:ROSAL/L knockout mouse. 40X, Scale bar = 20 um. (Z) 10 days post-stereotaxic Cre administration into an Ezh2flox/flox:ROSAL/L knockout mouse with 2 copies of a floxed Ezh2 gene, EdU was detected 2 hours after intraperitoneal EdU injection. 40X, Scale bar = 20 um.
Fig. 6
Fig. 6. Suv4-20h/H4K20me3 influence cell cycle in the SVZ cells
(A) Scheme of coronal sectioned mouse brain indicates region of immunostaining. (B) Co-localization of EdU and DAPI in non-injected SVZ in Suv4-20hflox/flox:RosaY/Y mouse. 20X, Scale bar = 20 um. (C) Co-localization of EdU and DAPI in Cre injected SVZ in Suv4-20hflox/flox:RosaY/Y mouse, 5 days post-stereotaxic administration. 20X, Scale bar = 20 um. (D) Bargraph of EdU-positive nuclei within dorsal SVZ quantified using 40x magnification. Y-axis indicates percentage of cells which are EdU –positive compared to control. (E) Non-injected hemisphere in Suv4-20hflox/flox:RosaY/Y mouse depicting DAPI at dorsal SVZ and rostral migratory stream. 20X, Scale bar = 20 um. (F) Non-injected hemisphere in a Suv4-20hflox/flox:RosaY/Y mouse. EdU was detected 2 hours after intraperitoneal EdU injection. 20X, Scale bar = 20 um. (G) Cre injected hemisphere in Suv4-20hflox/flox:RosaY/Y mouse, 5 days post-stereotaxic Cre administration depicting DAPI at dorsal SVZ and rostral migratory stream. 20X, Scale bar = 20 um. (H) Cre injected hemisphere in a Suv4-20hflox/flox:RosaY/Y mouse, 5 days post-stereotaxic Cre administration into. EdU was detected 2 hours after intraperitoneal EdU injection on last day of post-surgical rest. 20X, Scale bar = 20 um. (I) Non-injected hemisphere in Suv4-20hflox/flox:RosaY/Y mouse depicting DAPI at dorsal SVZ and rostral migratory stream. 40X, Scale bar = 20 um. (J) Non-injected hemisphere in a Suv4-20hflox/flox:RosaY/Y mouse. EdU was detected 2 hours after intraperitoneal EdU injection. 40X, Scale bar = 20 um. (K) Cre injected hemisphere in Suv4-20hflox/flox:RosaY/Y mouse, 5 days post-stereotaxic Cre administration depicting DAPI at dorsal SVZ and rostral migratory stream. 40X, Scale bar = 20 um. (L) Cre injected hemisphere in a Suv4-20hflox/flox:RosaY/Y mouse, 5 days post-stereotaxic Cre administration into. EdU was detected 2 hours after intraperitoneal EdU injection on last day of post-surgical rest. 40X, Scale bar = 20 um. (M) Non-injected hemisphere in Suv4-20hflox/flox:RosaY/Y mouse depicting DAPI at dorsal SVZ and rostral migratory stream. 20X, Scale bar = 20 um. (N) Non-injected hemisphere in a Suv4-20hflox/flox:RosaY/Y mouse. EdU was detected 2 hours after intraperitoneal EdU injection on last day of post-surgical rest. 20X, Scale bar = 20 um. (O) Cre injected hemisphere in Suv4-20hflox/flox:RosaY/Y mouse, 5 days post-stereotaxic Cre administration depicting DAPI at dorsal SVZ and rostral migratory stream. 20X, Scale bar = 20 um. (P) Cre injected hemisphere in a Suv4-20hflox/flox:RosaY/Y mouse, 5 days post-stereotaxic Cre administration into. EdU was detected 2 hours after intraperitoneal EdU injection on last day of post-surgical rest. 20X, Scale bar = 20 um. (Q) Non-injected hemisphere in Suv4-20hflox/flox:RosaY/Y mouse depicting DAPI at dorsal SVZ and rostral migratory stream. 40X, Scale bar = 20 um. (R) Non-injected hemisphere in a Suv4-20hflox/flox:RosaY/Y mouse. EdU was detected 2 hours after intraperitoneal EdU injection. 40X, Scale bar = 20 um. (S) Cre injected hemisphere in Suv4-20hflox/flox:RosaY/Y mouse, 5 days post-stereotaxic Cre administration depicting DAPI at dorsal SVZ and rostral migratory stream. 40X, Scale bar = 20 um. (T) Cre injected hemisphere in a Suv4-20hflox/flox:RosaY/Y mouse. EdU was detected 2 hours after intraperitoneal EdU injection on last day of post-surgical rest. 40X, Scale bar = 20 um.
Fig. 7
Fig. 7. Experimental Design for Correlation between genes in normal NSPCS enriched with H3K27me3 or H4K20me3 without detectable transcripts and genes altered in MRI-classified group I and group II GBM
Graphical diagram illustrates the experimental design and analyses. Left panel: ChIP-Seq identified H3K27me3 and H4K20me3 enriched genes in normal NSPCs isolated from baboon SVZ and RNA-Seq analysis of normal NSPCs isolated from baboon SVZ. Right panel: RNA-Seq and Cuffdiff determined differential gene expression of human GBMI and GBMI compared to normal human specimens within correlated brain regions.
Fig. 8
Fig. 8. Comparison among genes in normal NSPCS enriched with H3K27me3 or H4K20me3, genes without detectable transcripts in normal NSPCs, and genes elevated in MRI-classified group I and group II GBM
(A) Proportional Venn diagram of three-way comparisons involving genes in NSPCS enriched with H3K27me3, undetectable genes in NSPCs by RNA-Seq (≤1 FPKM), and genes elevated in SVZ-associated human GBMI tumors. Text box indicates gene function as predicted by Ingenuity Pathway Analysis (IPA). (B) Proportional Venn diagram of three-way comparisons involving genes in NSPCS enriched with H4K20me3, undetectable genes in NSPCs by RNA-Seq (≤1 FPKM), and genes elevated in SVZ-associated human GBMI tumors. Text box indicates gene function as predicted by IPA. (C) Proportional Venn diagram of genes in NSPCs enriched with H3K27me3, undetectable genes in NSPCs by RNA-Seq (≤1 FPKM), and upregulated genes in GBMII. (D) Proportional Venn diagram of genes in NSPCs enriched with H4K20me3, undetectable genes in NSPCs by RNA-Seq (≤1 FPKM), and upregulated genes in GBMII. (E) Proportional Venn diagram of genes in NSPCs enriched with H3K27me3, undetectable genes in NSPCs by RNA-Seq (≤1 FPKM), and upregulated genes in GBMI and GBMII. (F) Proportional Venn diagram of genes in NSPCs enriched with H4K20me3, undetectable genes in NSPCs by RNA-Seq (≤1 FPKM), and upregulated genes in GBMI and GBMII.
Fig. 9
Fig. 9. Differential expression analysis of genes of human GBM specimens
(A) A heatmap for differential expression of genes of human GBM specimens and corresponding H3K27me3 enrichment in endogenous NSPCs. Genes used for input are differentially expressed genes with greater than 2-fold change in human GBM corresponding to genes in normal NSPCs of baboon SVZ, which are lack of detectable transcript levels (≤1 FPKM) and enriched by H3K27me3. Inset shows symmetric color scale indicating differences in expression level as the (base 2) log of the fold change of GBM sample divided by control. Red indicates increased expression of genes in GBM relative to control, blue color indicates decreased expression of genes in GBM compared to control. Colored bars in column to left of heatmap indicate whether corresponding gene in baboon NSPC is not detectable by RNA-Seq (≤ 1 FPKM) or is expressed (> 1FPKM). Dendrogram was determined by hierarchical clustering using Euclidian distance and complete linkage. (B) A heatmap for differential expression of genes of human GBM specimens and corresponding H4K20me3 enrichment in endogenous NSPCs. Genes used for input are differentially expressed genes with greater than 2-fold change in human GBM corresponding to genes in normal NSPCs of baboon SVZ, which are lack of detectable transcript levels (≤1 FPKM) and enriched by H4K20me3. Inset shows symmetric color scale indicating differences in expression level as the (base 2) log of the fold change of GBM sample divided by control. Red indicates increased expression of genes in GBM relative to control, blue color indicates decreased expression of genes in GBM compared to control. Colored bars in column to left of heatmap indicate whether corresponding gene in baboon NSPC is not detectable by RNA-Seq (≤ 1 FPKM) or is expressed (> 1FPKM). Dendrogram was determined by hierarchical clustering using Euclidian distance and complete linkage.
Fig. 10
Fig. 10
Correlation between genes in normal NSPCS enriched with H3K27me3 or H4K20me3 without detectable transcripts and genes altered in MRI-classified group I and group II GBM A heatmap for differential expression of genes of human GBM specimens. Genes used for input are 289 differentially expressed genes with greater than 2-fold change in human GBM corresponding to genes in normal NSPCs of baboon SVZ, which are lack of detectable transcript levels (≤1 FPKM) and enriched by either H3K27me3, H4K20me3, or co-enriched with H3K27me3/H4K20me3. Inset shows symmetric color scale indicating differences in expression level as the (base 2) log of the fold change of GBM sample divided by control. Red indicates increased expression of genes in GBM relative to control, blue color indicates decreased expression of genes in GBM compared to control. SVZ-associated GBM1 and GBM2 exhibit expression level changes in genes involved in multiple biological functions. Colored bars in column on top of heatmap indicate H3K27me3/H4K20me3 enrichment of corresponding genes in NSPCs of baboon SVZ. Dendrogram was determined by hierarchical clustering using Euclidian distance and complete linkage. Red text box indicates functions of clustered genes upregulated in both GBM1 and GBM2, as predicted by IPA. Red and blue box indicates functions of clustered genes upregulated in GBM1 and downregulated in GBM2, as predicted by IPA. While there is no evident pattern of clustering of histone modifications with respect to particular GBM genes, there is a substantial increase in the number of upregulated GBM genes which correspond to H3K27me3 and H4K20me3 enrichment, yet lacking detectable transcripts in the normal NSPCs of baboon SVZ.

References

    1. Trievel RC, Beach BM, Dirk LM, Houtz RL, Hurley JH. Structure and catalytic mechanism of a SET domain protein methyltransferase. Cell. 2002;111:91–103. - PubMed
    1. Varambally S, Dhanasekaran SM, Zhou M, Barrette TR, Kumar-Sinha C, Sanda MG, Ghosh D, Pienta KJ, Sewalt RG, Otte AP, et al. The polycomb group protein EZH2 is involved in progression of prostate cancer. Nature. 2002;419:624–629. - PubMed
    1. Bracken AP, Pasini D, Capra M, Prosperini E, Colli E, Helin K. EZH2 is downstream of the pRB-E2F pathway, essential for proliferation and amplified in cancer. The EMBO journal. 2003;22:5323–5335. - PMC - PubMed
    1. Kleer CG, Cao Q, Varambally S, Shen R, Ota I, Tomlins SA, Ghosh D, Sewalt RG, Otte AP, Hayes DF, et al. EZH2 is a marker of aggressive breast cancer and promotes neoplastic transformation of breast epithelial cells. Proceedings of the National Academy of Sciences of the United States of America. 2003;100:11606–11611. - PMC - PubMed
    1. Ting AH, McGarvey KM, Baylin SB. The cancer epigenome--components and functional correlates. Genes & development. 2006;20:3215–3231. - PubMed