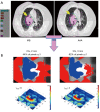
Quantitative comparison of dose distribution in radiotherapy plans using 2D gamma maps and X-ray computed tomography
- PMID: 27429908
- PMCID: PMC4929278
- DOI: 10.21037/qims.2016.06.04
Quantitative comparison of dose distribution in radiotherapy plans using 2D gamma maps and X-ray computed tomography
Abstract
Background: The advanced dose calculation algorithms implemented in treatment planning system (TPS) have remarkably improved the accuracy of dose calculation especially the modeling of electrons transport in the low density medium. The purpose of this study is to evaluate the use of 2D gamma (γ) index to quantify and evaluate the impact of the calculation of electrons transport on dose distribution for lung radiotherapy.
Methods: X-ray computed tomography images were used to calculate the dose for twelve radiotherapy treatment plans. The doses were originally calculated with Modified Batho (MB) 1D density correction method, and recalculated with anisotropic analytical algorithm (AAA), using the same prescribed dose. Dose parameters derived from dose volume histograms (DVH) and target coverage indices were compared. To compare dose distribution, 2D γ-index was applied, ranging from 1%/1 mm to 6%/6 mm. The results were displayed using γ-maps in 2D. Correlation between DVH metrics and γ passing rates was tested using Spearman's rank test and Wilcoxon paired test to calculate P values.
Results: the plans generated with AAA predicted more heterogeneous dose distribution inside the target, with P<0.05. However, MB overestimated the dose predicting more coverage of the target by the prescribed dose. The γ analysis showed that the difference between MB and AAA could reach up to ±10%. The 2D γ-maps illustrated that AAA predicted more dose to organs at risks, as well as lower dose to the target compared to MB.
Conclusions: Taking into account of the electrons transport on radiotherapy plans showed a significant impact on delivered dose and dose distribution. When considering the AAA represent the true cumulative dose, a readjusting of the prescribed dose and an optimization to protect the organs at risks should be taken in consideration in order to obtain the better clinical outcome.
Keywords: Electrons transport; bootstrap; computed tomography; gamma maps; radiotherapy dosage.
Conflict of interest statement
Figures


Similar articles
-
Agreement between gamma passing rates using computed tomography in radiotherapy and secondary cancer risk prediction from more advanced dose calculated models.Quant Imaging Med Surg. 2017 Jun;7(3):292-298. doi: 10.21037/qims.2017.06.03. Quant Imaging Med Surg. 2017. PMID: 28811995 Free PMC article.
-
Assessing the shift of radiobiological metrics in lung radiotherapy plans using 2D gamma index.Transl Lung Cancer Res. 2016 Jun;5(3):265-71. doi: 10.21037/tlcr.2016.06.01. Transl Lung Cancer Res. 2016. PMID: 27413708 Free PMC article.
-
Statistic and dosimetric criteria to assess the shift of the prescribed dose for lung radiotherapy plans when integrating point kernel models in medical physics: are we ready?Transl Lung Cancer Res. 2016 Dec;5(6):681-687. doi: 10.21037/tlcr.2016.11.03. Transl Lung Cancer Res. 2016. PMID: 28149762 Free PMC article.
-
Advanced kernel methods vs. Monte Carlo-based dose calculation for high energy photon beams.Radiother Oncol. 2009 Dec;93(3):645-53. doi: 10.1016/j.radonc.2009.10.013. Epub 2009 Nov 18. Radiother Oncol. 2009. PMID: 19926153
-
The use of TCP based EUD to rank and compare lung radiotherapy plans: in-silico study to evaluate the correlation between TCP with physical quality indices.Transl Lung Cancer Res. 2017 Jun;6(3):366-372. doi: 10.21037/tlcr.2017.04.07. Transl Lung Cancer Res. 2017. PMID: 28713681 Free PMC article.
Cited by
-
Agreement between gamma passing rates using computed tomography in radiotherapy and secondary cancer risk prediction from more advanced dose calculated models.Quant Imaging Med Surg. 2017 Jun;7(3):292-298. doi: 10.21037/qims.2017.06.03. Quant Imaging Med Surg. 2017. PMID: 28811995 Free PMC article.
-
Dosimetric impact of CT metal artifact reduction for spinal implants in stereotactic body radiotherapy planning.Quant Imaging Med Surg. 2023 Dec 1;13(12):8290-8302. doi: 10.21037/qims-23-442. Epub 2023 Oct 27. Quant Imaging Med Surg. 2023. PMID: 38106297 Free PMC article.
References
-
- Rana S. Clinical dosimetric impact of Acuros XB and analytical anisotropic algorithm (AAA) on real lung cancer treatment plans: review Int J Cancer 2014;2:02019.
-
- Ojala J. The accuracy of the Acuros XB algorithm in external beam radiotherapy – a comprehensive review. Int J Cancer 2014;2:020417.
-
- Aarup LR, Nahum AE, Zacharatou C, Juhler-Nøttrup T, Knöös T, Nyström H, Specht L, Wieslander E, Korreman SS. The effect of different lung densities on the accuracy of various radiotherapy dose calculation methods: implications for tumour coverage. Radiother Oncol 2009;91:405-14. 10.1016/j.radonc.2009.01.008 - DOI - PubMed
LinkOut - more resources
Full Text Sources
Other Literature Sources
Miscellaneous
