. 2016 Jul;3(3):033501.
doi: 10.1117/1.JMI.3.3.033501. Epub 2016 Jul 7.

Construction of realistic phantoms from patient images and a commercial three-dimensional printer

Affiliations

Construction of realistic phantoms from patient images and a commercial three-dimensional printer

Shuai Leng et al. J Med Imaging (Bellingham). 2016 Jul.

Abstract

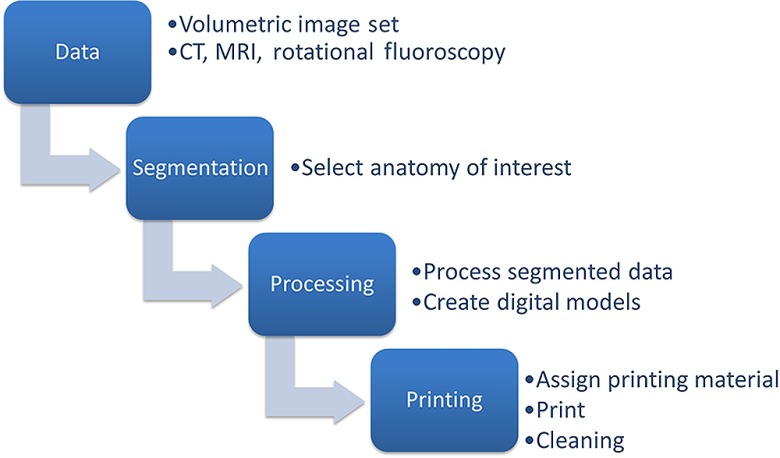
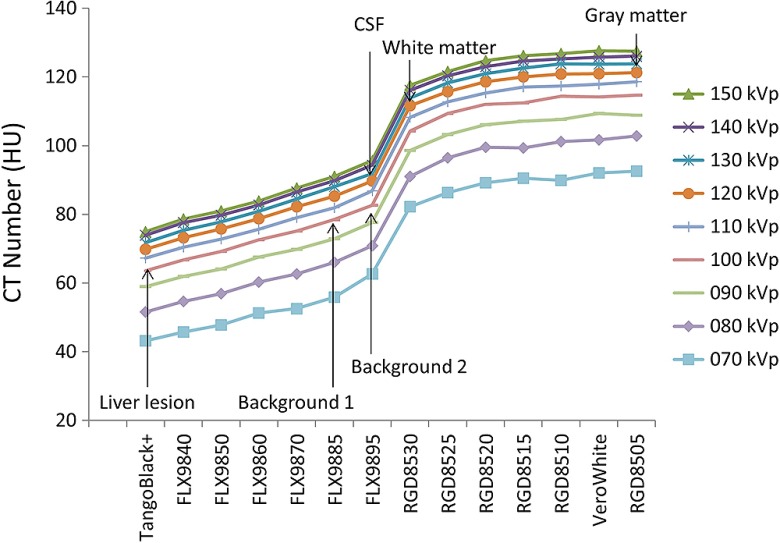
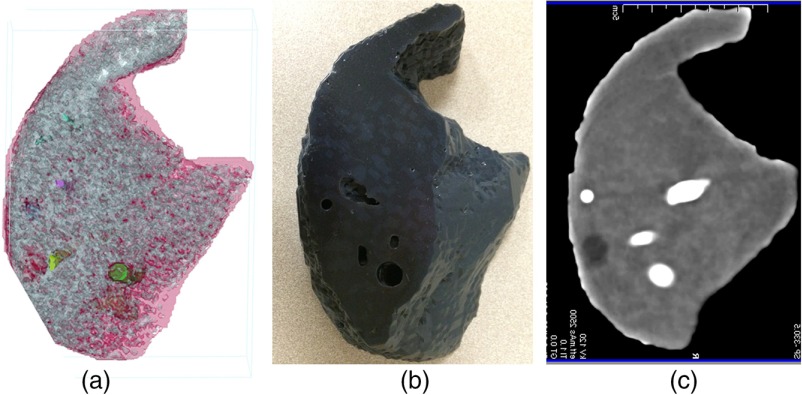
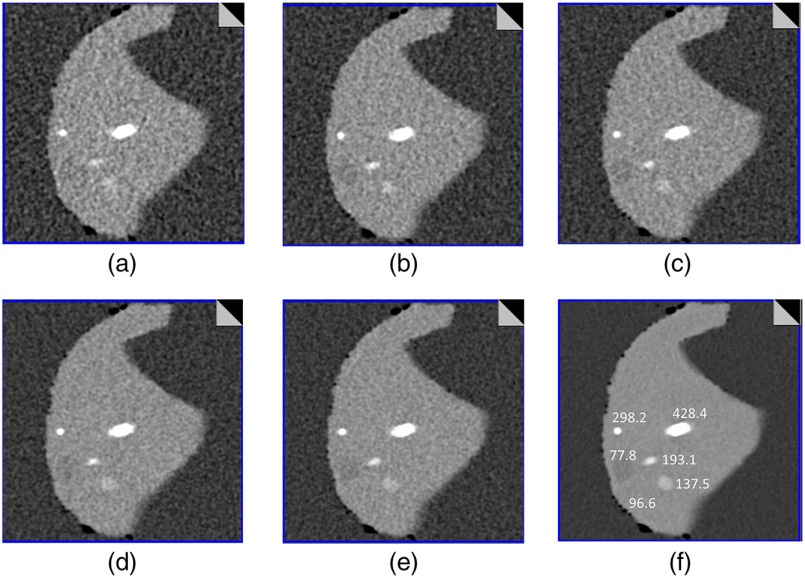
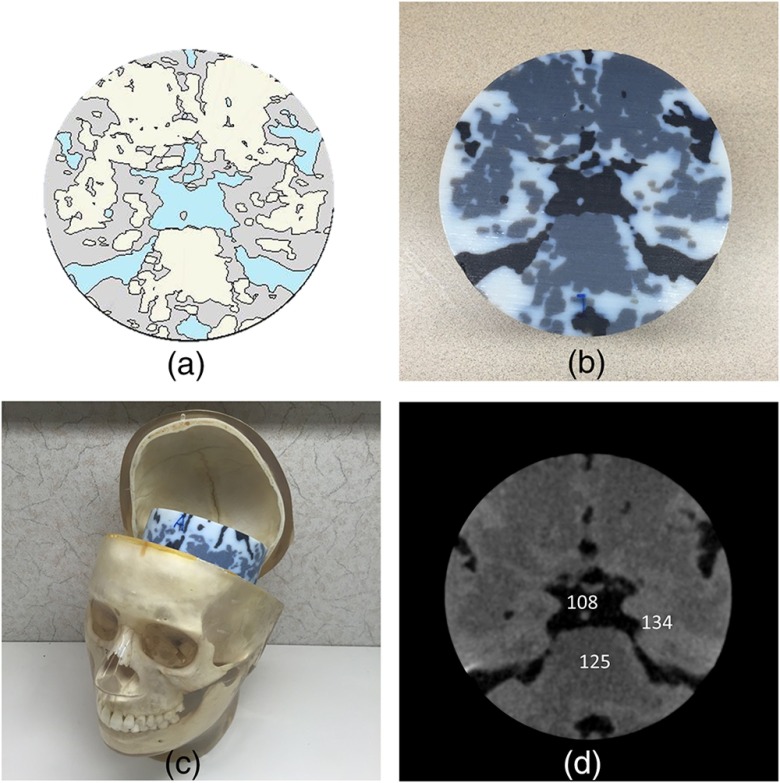
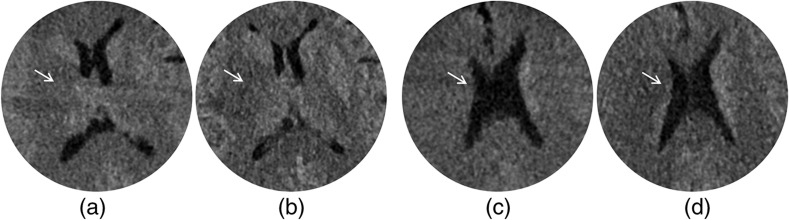
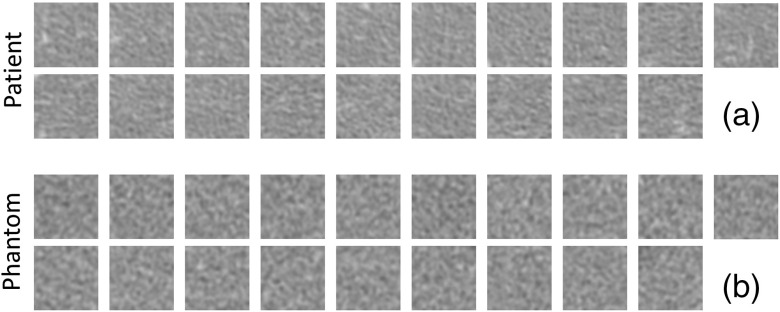
The purpose of this study was to use three-dimensional (3-D) printing techniques to construct liver and brain phantoms having realistic pathologies, anatomic structures, and heterogeneous backgrounds. Patient liver and head computed tomography (CT) images were segmented into tissue, vessels, liver lesion, white and gray matter, and cerebrospinal fluid (CSF). Stereolithography files of each object were created and imported into a commercial 3-D printer. Printing materials were assigned to each object after test scans, which showed that the printing materials had CT numbers ranging from 70 to 121 HU at 120 kV. Printed phantoms were scanned on a CT scanner and images were evaluated. CT images of the liver phantom had measured CT numbers of 77.8 and 96.6 HU for the lesion and background, and 137.5 to 428.4 HU for the vessels channels, which were filled with iodine solutions. The difference in CT numbers between lesions and background (18.8 HU) was representative of the low-contrast values needed for optimization tasks. The liver phantom background was evaluated with Haralick features and showed similar texture between patient and phantom images. CT images of the brain phantom had CT numbers of 125, 134, and 108 HU for white matter, gray matter, and CSF, respectively. The CT number differences were similar to those in patient images.

Keywords: brain; computed tomography; image quality; liver; phantom; three-dimensional printer.


Figures

Fig. 1
Fig. 1
Flowchart of the 3-D printing procedure.
Fig. 2
Fig. 2
CT numbers of printing materials at tube potentials from 70 to 150 kV. The materials used for the liver lesion, the heterogeneous liver background, white matter, gray matter, and CSF are annotated.
Fig. 3
Fig. 3
Segmentation of the (a) liver phantom model, (b) photograph, and (c) CT image of the printed liver phantom. The display window width and window center are 100 and 80 HU. Heterogeneity of the liver tissue can be observed in the CT image.
Fig. 4
Fig. 4
CT images of the liver phantom scanned at six different dose levels with CTDIvol of (a) 5.2, (b) 7.7, (c) 10.2, (d) 15.4, (e) 23.1, and (f) 147.6 mGy. Measured CT numbers of lesion, tissue, and vessels (in the unit of Hounsfield unit) are marked on (f).
Fig. 5
Fig. 5
(a) Segmentation of the brain phantom model, (b) photograph of the printed brain phantom, (c) placement of the brain phantom in a skull phantom, and (d) a CT image of the brain phantom acquired at very high dose, with CT numbers measured in the unit of Hounsfield unit. The display window width and window center for (d) are 80 and 145 HU.
Fig. 6
Fig. 6
(a), (c) The images of the brain phantom acquired at clinical dose level compared to (b), (d) the images of the original patient. The hypoattenuation of the lentiform nucleus due to acute stroke is indicated by the arrow. The display window width and window center for (a) and (c) are 80 and 145 HU. The display window width and window center for (b) and (d) are 80 and 40 HU.
Fig. 7
Fig. 7
ROIs cropped from the liver parenchyma of (a) patient images and (b) liver phantom images. The display window width and window center are 400 and 40 HU.

References

    1. McCollough C., et al. , “Achieving routine sub-mSv CT scanning: report from the summit on management of radiation dose in CT,” Radiology 264(2), 567–580 (2012).RADLAX10.1148/radiol.12112265 - DOI - PMC - PubMed
    1. Kalra M. K., et al. , “Computed tomography radiation dose optimization: scanning protocols and clinical applications of automatic exposure control,” Curr. Probl. Diagn. Radiol. 34(5), 171–181 (2005).10.1067/j.cpradiol.2005.06.002 - DOI - PubMed
    1. McCollough C. H., Bruesewitz M. R., Kofler J. M., Jr., “CT dose reduction and dose management tools: overview of available options,” Radiographics 26(2), 503–512 (2006).10.1148/rg.262055138 - DOI - PubMed
    1. La Rivière P. J., Bian J., Vargas P. A., “Penalized-likelihood sinogram restoration for computed tomography,” IEEE Trans. Med. Imaging 25(8), 1022–1036 (2006).ITMID410.1109/TMI.2006.875429 - DOI - PubMed
    1. Wang J., et al. , “Penalized weighted least-squares approach to sinogram noise reduction and image reconstruction for low-dose X-ray computed tomography,” IEEE Trans. Med. Imaging 25(10), 1272–1283 (2006).10.1109/TMI.2006.882141 - DOI - PMC - PubMed