

Netrin-1 Augments Chemokinesis in CD4+ T Cells In Vitro and Elicits a Proinflammatory Response In Vivo
- PMID: 27430720
- PMCID: PMC4976028
- DOI: 10.4049/jimmunol.1502432
Netrin-1 Augments Chemokinesis in CD4+ T Cells In Vitro and Elicits a Proinflammatory Response In Vivo
Abstract
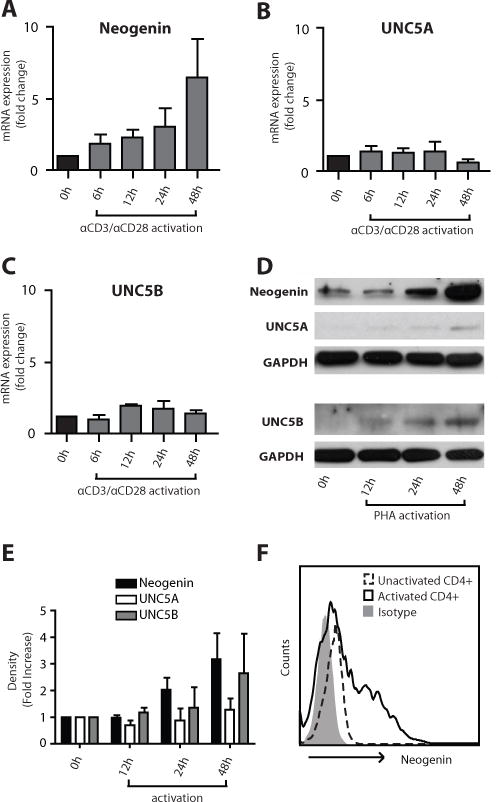
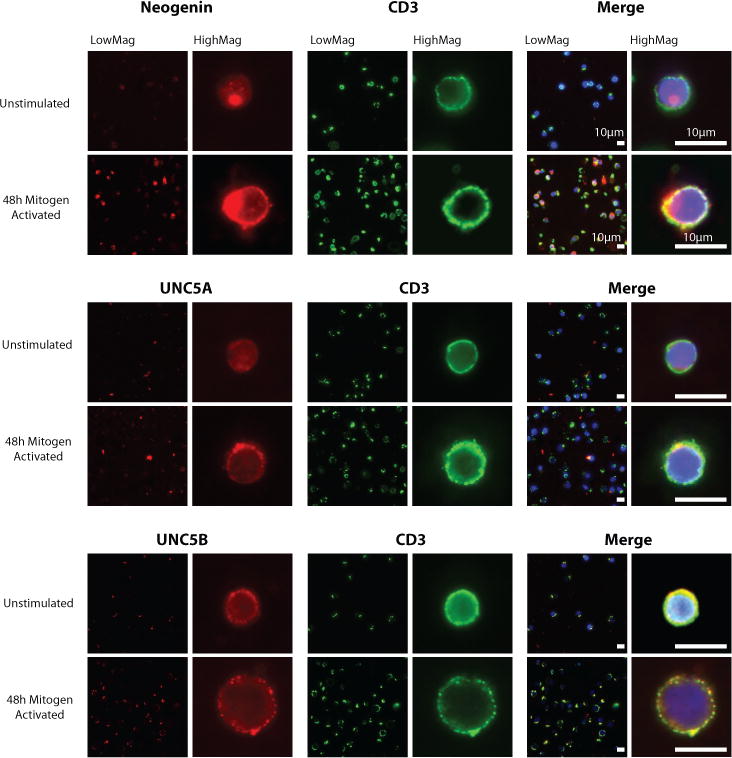
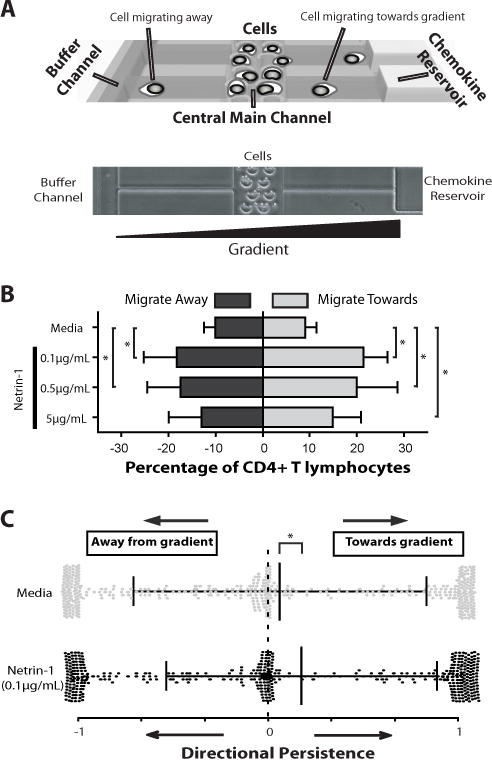
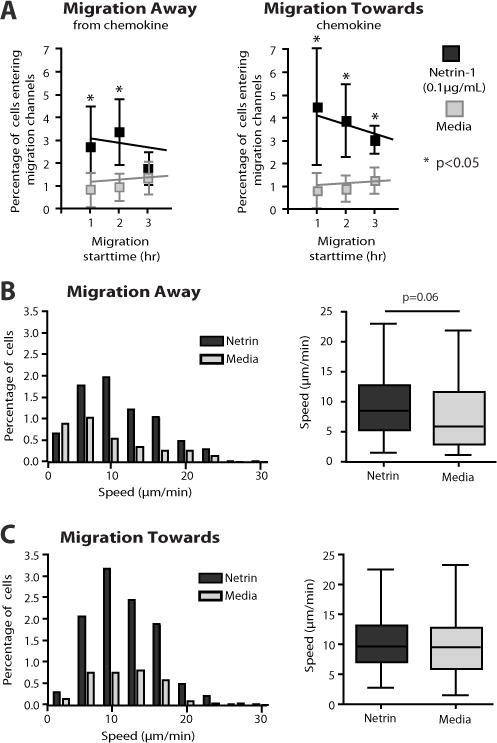
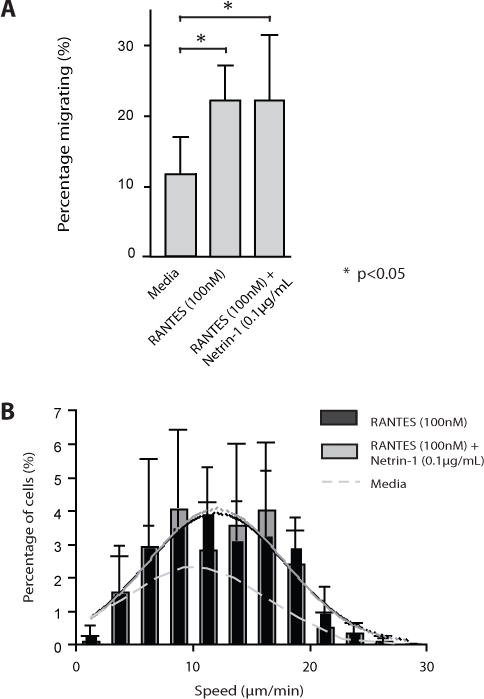
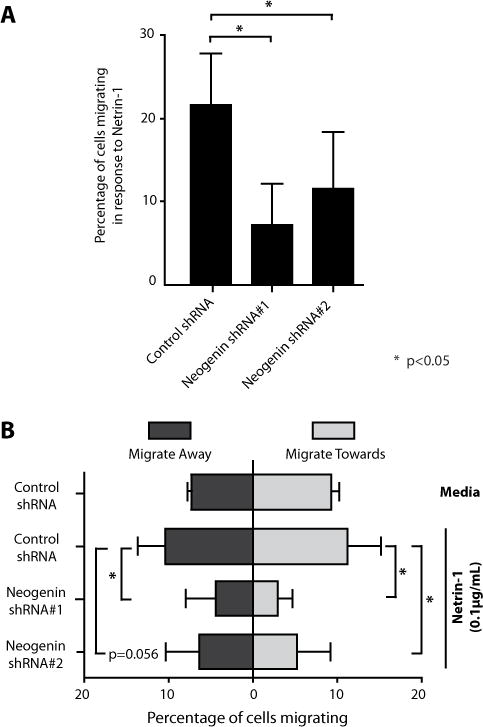
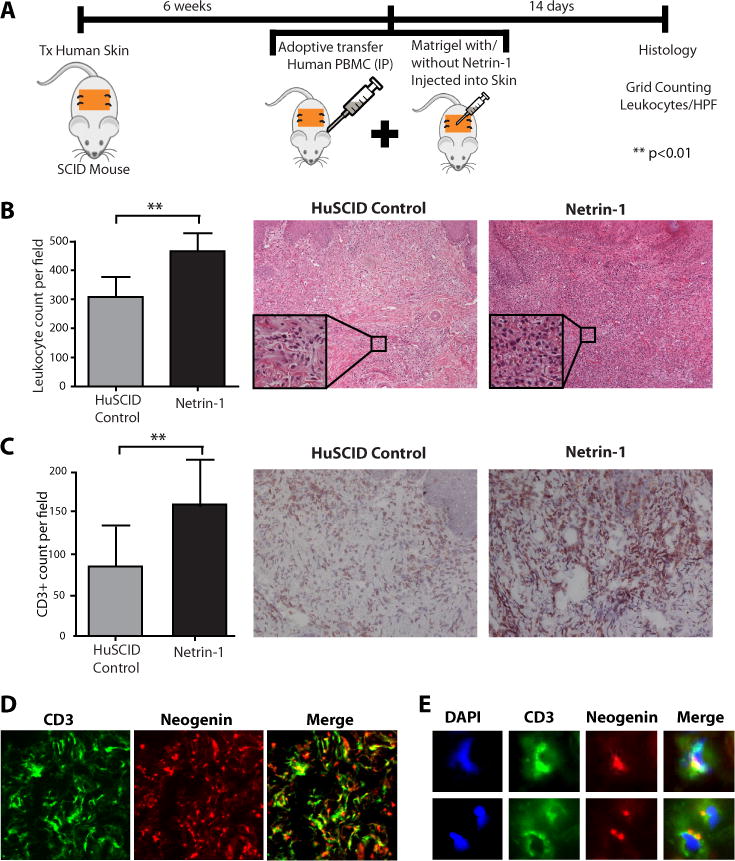
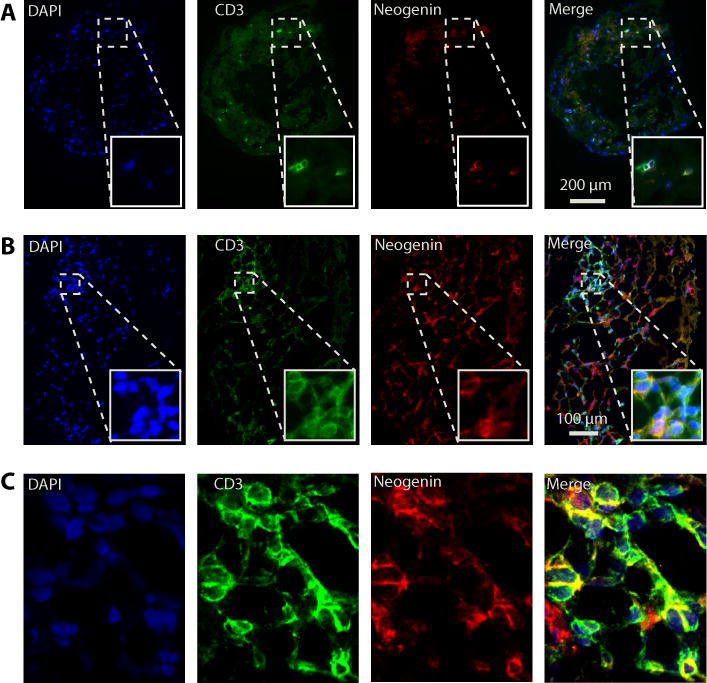
Netrin-1 is a neuronal guidance cue that regulates cellular activation, migration, and cytoskeleton rearrangement in multiple cell types. It is a chemotropic protein that is expressed within tissues and elicits both attractive and repulsive migratory responses. Netrin-1 has recently been found to modulate the immune response via the inhibition of neutrophil and macrophage migration. However, the ability of Netrin-1 to interact with lymphocytes and its in-depth effects on leukocyte migration are poorly understood. In this study, we profiled the mRNA and protein expression of known Netrin-1 receptors on human CD4(+) T cells. Neogenin, uncoordinated-5 (UNC5)A, and UNC5B were expressed at low levels in unstimulated cells, but they increased following mitogen-dependent activation. By immunofluorescence, we observed a cytoplasmic staining pattern of neogenin and UNC5A/B that also increased following activation. Using a novel microfluidic assay, we found that Netrin-1 stimulated bidirectional migration and enhanced the size of migratory subpopulations of mitogen-activated CD4(+) T cells, but it had no demonstrable effects on the migration of purified CD4(+)CD25(+)CD127(dim) T regulatory cells. Furthermore, using a short hairpin RNA knockdown approach, we observed that the promigratory effects of Netrin-1 on T effectors is dependent on its interactions with neogenin. In the humanized SCID mouse, local injection of Netrin-1 into skin enhanced inflammation and the number of neogenin-expressing CD3(+) T cell infiltrates. Neogenin was also observed on CD3(+) T cell infiltrates within human cardiac allograft biopsies with evidence of rejection. Collectively, our findings demonstrate that Netrin-1/neogenin interactions augment CD4(+) T cell chemokinesis and promote cellular infiltration in association with acute inflammation in vivo.
Copyright © 2016 by The American Association of Immunologists, Inc.
Figures
Similar articles
-
Netrin-1 increases proliferation and migration of renal proximal tubular epithelial cells via the UNC5B receptor.Am J Physiol Renal Physiol. 2009 Apr;296(4):F723-9. doi: 10.1152/ajprenal.90686.2008. Epub 2009 Feb 11. Am J Physiol Renal Physiol. 2009. PMID: 19211685
-
Netrin-4 inhibits angiogenesis via binding to neogenin and recruitment of Unc5B.Proc Natl Acad Sci U S A. 2008 Aug 26;105(34):12491-6. doi: 10.1073/pnas.0804008105. Epub 2008 Aug 21. Proc Natl Acad Sci U S A. 2008. PMID: 18719102 Free PMC article.
-
Netrin-1 induces the migration of Schwann cells via p38 MAPK and PI3K-Akt signaling pathway mediated by the UNC5B receptor.Biochem Biophys Res Commun. 2015 Aug 14;464(1):263-8. doi: 10.1016/j.bbrc.2015.06.140. Epub 2015 Jun 23. Biochem Biophys Res Commun. 2015. PMID: 26116534
-
Role of Netrin-1 Signaling in Nerve Regeneration.Int J Mol Sci. 2017 Feb 24;18(3):491. doi: 10.3390/ijms18030491. Int J Mol Sci. 2017. PMID: 28245592 Free PMC article. Review.
-
Netrin-1: An emerging player in inflammatory diseases.Cytokine Growth Factor Rev. 2022 Apr;64:46-56. doi: 10.1016/j.cytogfr.2022.01.003. Epub 2022 Jan 14. Cytokine Growth Factor Rev. 2022. PMID: 35082104 Review.
Cited by
-
Neuron-derived Netrin-1 deficiency aggravates spinal cord injury through activating the NF-κB signaling pathway.Heliyon. 2024 Sep 3;10(17):e37388. doi: 10.1016/j.heliyon.2024.e37388. eCollection 2024 Sep 15. Heliyon. 2024. PMID: 39290272 Free PMC article.
-
From netrin-1-targeted SPECT/CT to internal radiotherapy for management of advanced solid tumors.EMBO Mol Med. 2023 Apr 11;15(4):e16732. doi: 10.15252/emmm.202216732. Epub 2023 Mar 6. EMBO Mol Med. 2023. PMID: 36876343 Free PMC article.
-
Netrins & Semaphorins: Novel regulators of the immune response.Biochim Biophys Acta Mol Basis Dis. 2017 Dec;1863(12):3183-3189. doi: 10.1016/j.bbadis.2017.09.010. Epub 2017 Sep 14. Biochim Biophys Acta Mol Basis Dis. 2017. PMID: 28918114 Free PMC article. Review.
-
Methylome Patterns of Cattle Adaptation to Heat Stress.Front Genet. 2021 May 28;12:633132. doi: 10.3389/fgene.2021.633132. eCollection 2021. Front Genet. 2021. PMID: 34122501 Free PMC article.
-
Macrophage-derived netrin-1 promotes abdominal aortic aneurysm formation by activating MMP3 in vascular smooth muscle cells.Nat Commun. 2018 Nov 27;9(1):5022. doi: 10.1038/s41467-018-07495-1. Nat Commun. 2018. PMID: 30479344 Free PMC article.
References
-
- Tessier-Lavigne M, Goodman CS. The molecular biology of axon guidance. Science. 1996;274:1123–1133. - PubMed
-
- Klagsbrun M, Eichmann A. A role for axon guidance receptors and ligands in blood vessel development and tumor angiogenesis. Cytokine & growth factor reviews. 2005;16:535–548. - PubMed
-
- Gaur P, Bielenberg DR, Samuel S, Bose D, Zhou Y, Gray MJ, Dallas NA, Fan F, Xia L, Lu J, Ellis LM. Role of class 3 semaphorins and their receptors in tumor growth and angiogenesis. Clinical cancer research: an official journal of the American Association for Cancer Research. 2009;15:6763–6770. - PubMed
-
- van Gils JM, Derby MC, Fernandes LR, Ramkhelawon B, Ray TD, Rayner KJ, Parathath S, Distel E, Feig JL, Alvarez-Leite JI, Rayner AJ, McDonald TO, O’Brien KD, Stuart LM, Fisher EA, Lacy-Hulbert A, Moore KJ. The neuroimmune guidance cue netrin-1 promotes atherosclerosis by inhibiting the emigration of macrophages from plaques. Nat Immunol. 13:136–143. - PMC - PubMed
Publication types
MeSH terms
Substances
Grants and funding
LinkOut - more resources
Full Text Sources
Other Literature Sources
Research Materials
