

Pervasive isoform-specific translational regulation via alternative transcription start sites in mammals
- PMID: 27430939
- PMCID: PMC4965872
- DOI: 10.15252/msb.20166941
Pervasive isoform-specific translational regulation via alternative transcription start sites in mammals
Abstract
Transcription initiated at alternative sites can produce mRNA isoforms with different 5'UTRs, which are potentially subjected to differential translational regulation. However, the prevalence of such isoform-specific translational control across mammalian genomes is currently unknown. By combining polysome profiling with high-throughput mRNA 5' end sequencing, we directly measured the translational status of mRNA isoforms with distinct start sites. Among 9,951 genes expressed in mouse fibroblasts, we identified 4,153 showed significant initiation at multiple sites, of which 745 genes exhibited significant isoform-divergent translation. Systematic analyses of the isoform-specific translation revealed that isoforms with longer 5'UTRs tended to translate less efficiently. Further investigation of cis-elements within 5'UTRs not only provided novel insights into the regulation by known sequence features, but also led to the discovery of novel regulatory sequence motifs. Quantitative models integrating all these features explained over half of the variance in the observed isoform-divergent translation. Overall, our study demonstrated the extensive translational regulation by usage of alternative transcription start sites and offered comprehensive understanding of translational regulation by diverse sequence features embedded in 5'UTRs.
Keywords: alternative transcription start sites; cis‐regulatory elements; isoform‐divergent translation; translational regulation.
© 2016 The Authors. Published under the terms of the CC BY 4.0 license.
Figures
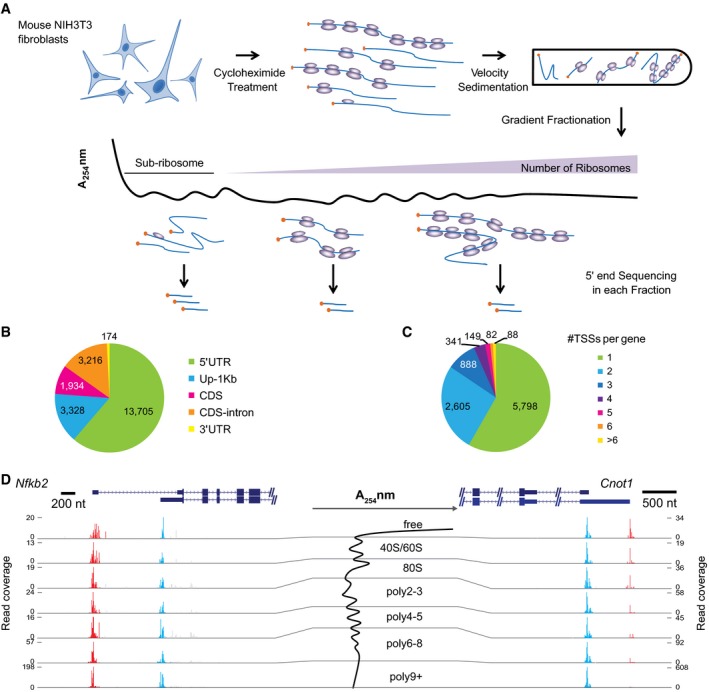
Experimental scheme. RNAs were collected from seven gradient fractions and the 5ʹ ends of RNA transcripts were quantitatively profiled in each fraction using an adapted cap‐trapping approach.
Pie chart showing the distribution of TSSs identified in this study in different regions of protein‐coding genes. The majority of TSSs were derived from gross 5ʹUTRs, including annotated 5ʹUTRs and 1 kb upstream of the annotated TSSs (Up‐1 kb).
Pie chart showing the number of TSSs in the gross 5ʹUTRs per protein‐coding gene. Out of the 9,951 genes with at least one TSS detected, 4,153 (41.7%) expressed multiple TSSs.
Two examples were shown to demonstrate the impact of alternative TSSs on TE. Cumulative reads along each gene from the seven gradient fractions (shown in the middle) were plotted under the gene structure. While the two alternative TSSs from gene Nfkb2 resulted in no difference in TE, the two from gene Cnot1 led to substantial TE difference. Please note the range of read coverage varied across fractions. Red and blue bars represented sequencing reads mapped within distal and proximal TSSs, respectively; gray bars represented reads mapped outside of the identified TSSs. The description of the two genes can be found in Table EV3.
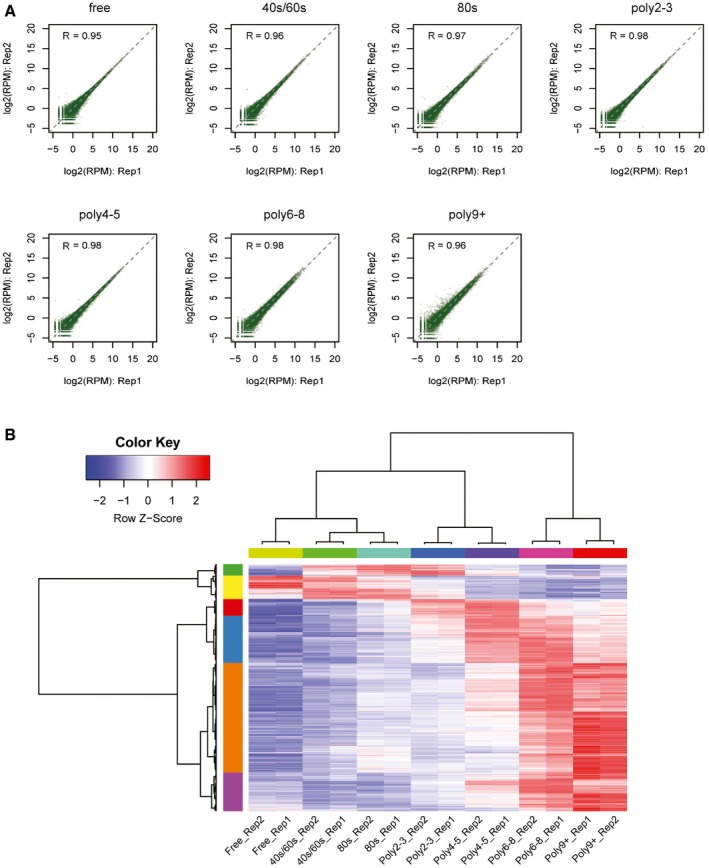
The scatter plot comparing read counts of each TSS cluster between biological replicates for each of the seven polysome fractions.
Hierarchical clustering of TSS isoform abundance across all fractions and replicates. Each row represented one TSS isoform, and each column represented different fractions. Z‐scores, showing in different colors, represented the normalized isoform abundance across fractions.
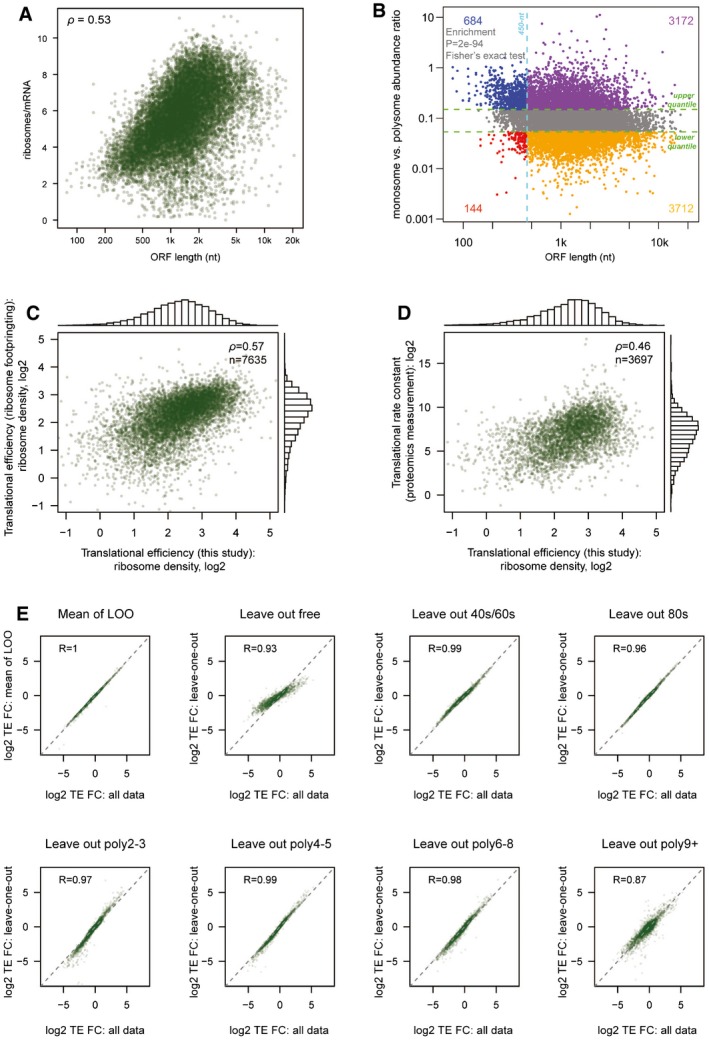
For each TSS isoform, the number of ribosomes per mRNA was plotted against its corresponding ORF length.
For each TSS isoform, the abundance ratio between monosome fraction and sum of polysome factions was plotted against its corresponding ORF length. Short ORFs (≤ 450 nt) were more enriched in the monosome fraction.
TE values for each gene calculated based on published ribosome footprinting data were plotted against the TE values calculated based on polysome profiling data in this study.
TE values for each gene calculated based on published proteomics/genomics data were plotted against the TE values calculated based on polysome profiling data in this study.
Log2‐transformed TE fold change values for each pair of alternative TSS isoforms calculated based on all seven fraction data were compared to those calculated based on data with one of the seven fractions left out.
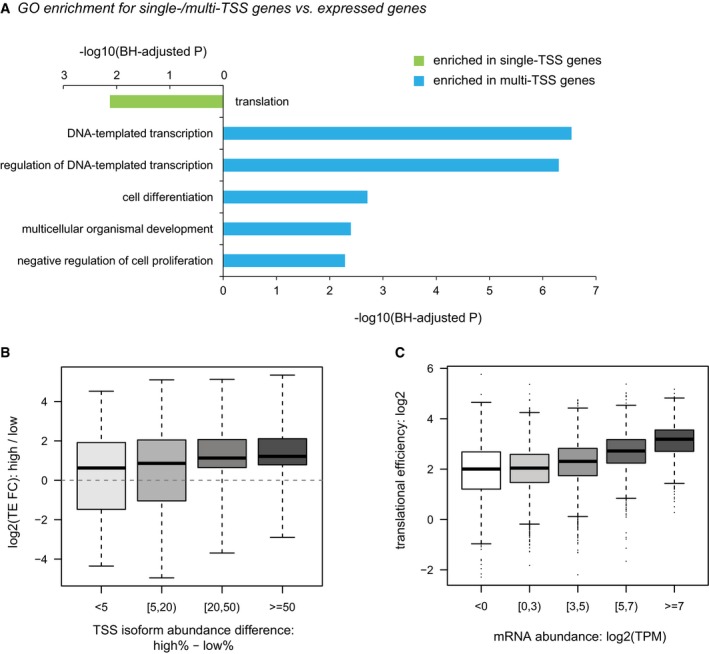
GO enrichment for single/multi‐TSS genes over all expressed genes.
Boxplots showing the distribution of TE divergence between alternative TSS isoforms grouped by their abundance differences. Box edges represent quantiles, whiskers represent extreme data points.
Boxplots showing the distribution of TE at the gene level grouped by mRNA abundance. Box edges represent quantiles, whiskers represent extreme data points no more than 1.5 times the interquartile range.
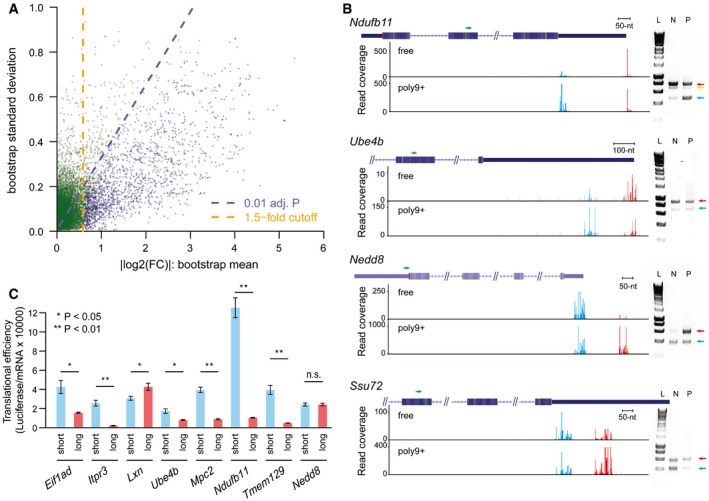
Scatter plot showing the bootstrap means (x‐axis) and standard deviations (y‐axis) for log2‐transformed TE difference between 13,118 TSS isoform pairs in the 4,153 multi‐TSS genes. Dashed purple lines indicated the Benjamini–Hochberg adjusted P‐value of 0.01, and dashed orange lines indicated the 1.5‐fold divergence. Genes with significant TE divergence (Benjamini–Hochberg adjusted P‐value < 0.01, TE divergence > 1.5‐fold) are depicted in blue. See also Table EV2.
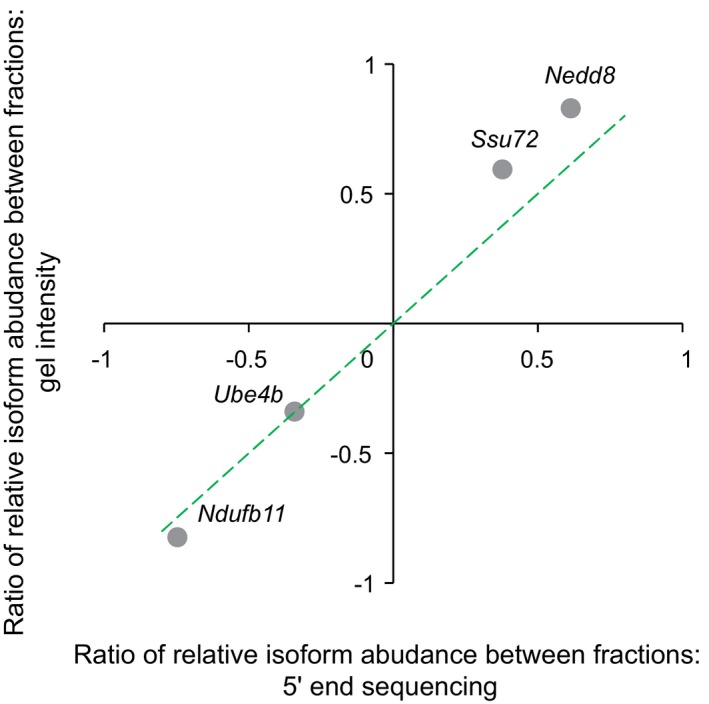
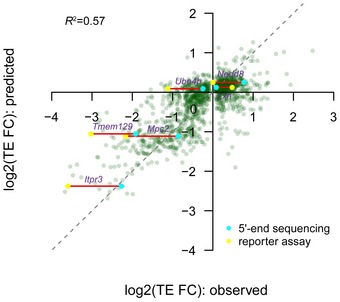
Independent validation of TSS isoforms and their associated translational efficiency in genes Ndufb11, Ube4b, Nedd8, and Ssu72, respectively. Left: Under each gene structure, cumulative reads were shown for the alternative TSSs in the “free” fraction and poly9+ fraction. Green arrows above the gene structure indicate the locations of the reverse PCR primer. Red and blue bars represented sequencing reads mapped within distal and proximal TSSs, respectively; gray bars represented reads mapped outside of the identified TSSs. Right: Agarose gel electrophoresis of amplified products of mRNA 5ʹ ends obtained from non‐ribosomal fraction and polysomal fraction. Positions of the distal TSS isoform and the proximal TSS isoforms are indicated with red and blue arrows, respectively. In the case of gene Ndufb11, the band below the distal TSS (indicated by a yellow arrow) in the gel image was caused by an alternative splicing event, which removed an 88‐nt region for a minor fraction of transcripts initiating at the distal TSS. L, HyperLadder I; N, non‐ribosomal fraction; P, polysomal fraction. The description of these genes can be found in Table EV3.
Alternative 5ʹUTR sequences are able to drive the observed isoform‐specific TE divergence. An in vivo reporter system was used to compare the TE of a Renilla luminescent reporter gene led by the 5ʹUTR sequences derived from eight pairs of alternative TSS isoforms identified in eight genes. TE is calculated by luciferase activity normalized to mRNA abundance. Seven out of eight reporter pairs showed significant differential TE biased toward the same TSS isoforms as observed in our global analysis (n = 3; mean ± SEM; *P < 0.05, **P < 0.01; Student's t‐test). The description of these genes can be found in Table EV3.
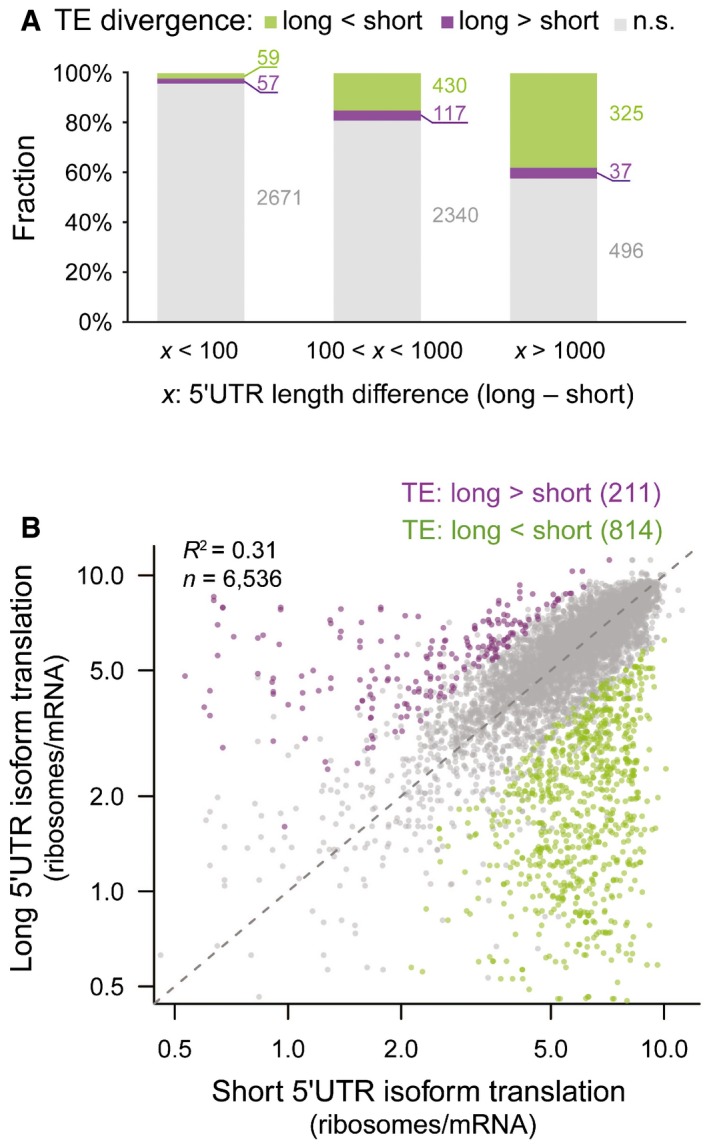
Barplots showing the fraction of alternative TSS isoform pairs with and without significant differential TE. Isoform pairs with certain 5ʹUTR length difference were grouped together. The larger the length difference between the two isoforms, the higher the fraction associated with significant TE divergence.
Scatter plot comparing the number of ribosomes per mRNA between shorter 5ʹUTR isoforms (x‐axis) and longer 5ʹUTR isoforms (y‐axis) from the same genes. Purple and green dots were isoform pairs with significant differential TE biased toward longer and shorter isoforms, respectively.
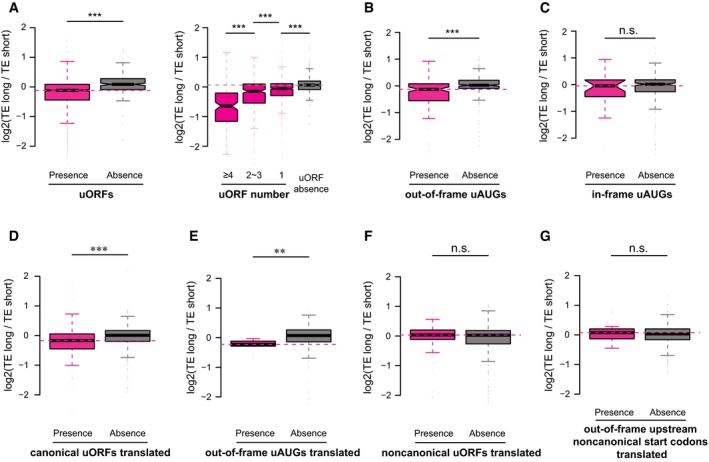
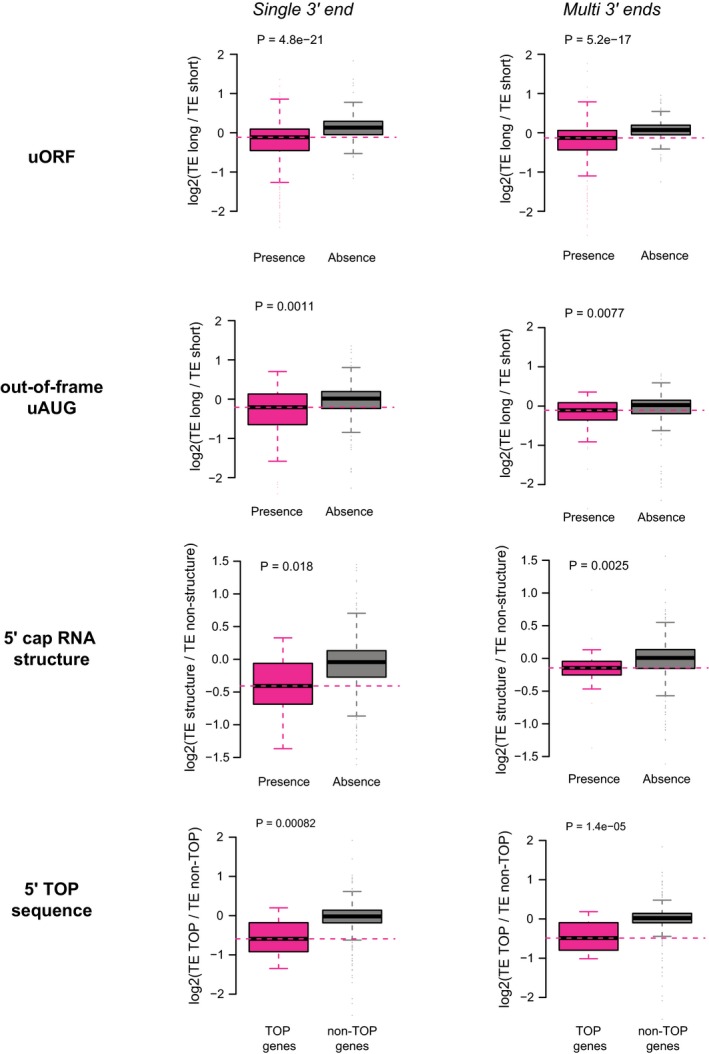
Left: Boxplots comparing the log2 TE fold changes between two groups of alternative isoform pairs, one group with at least one uORF present in the isoform‐divergent 5ʹUTR and the other without. Right: The group with uORF was further separated into three subgroups according to the number of uORFs present in the divergent 5ʹUTR.
Same as (A)—left, but the sequence feature of interest is the out‐of‐frame uAUGs.
Same as (A)—left, but the sequence feature of interest is the in‐frame uAUGs.
Same as (A)—left, but the sequence feature of interest is the translated uORFs (i.e. supported by ribosome footprinting) with canonical AUG start codon.
Same as (A)—left, but the sequence feature of interest is the translated out‐of‐frame uAUGs (i.e. supported by ribosome footprinting).
Same as (A)—left, but the sequence feature of interest is the translated uORFs (i.e. supported by ribosome footprinting) with non‐canonical start codons.
Same as (A)—left, but the sequence feature of interest is the translated out‐of‐frame upstream non‐canonical start codons (i.e. supported by ribosome footprinting).
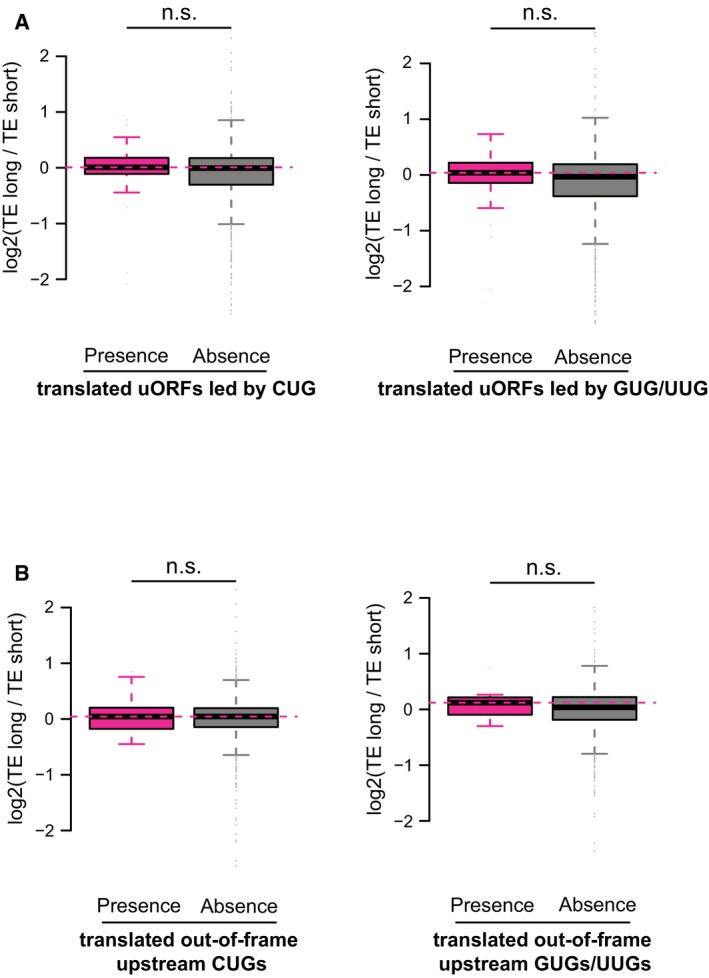
Similar to Fig 4F, but split non‐canonical uORFs into uORFs led by CUGs and uORFs led by GUGs/UUGs.
Similar to Fig 4G, but split out‐of‐frame upstream non‐canonical start codons into out‐of‐frame upstream CUGs and out‐of‐frame upstream GUGs/UUGs.
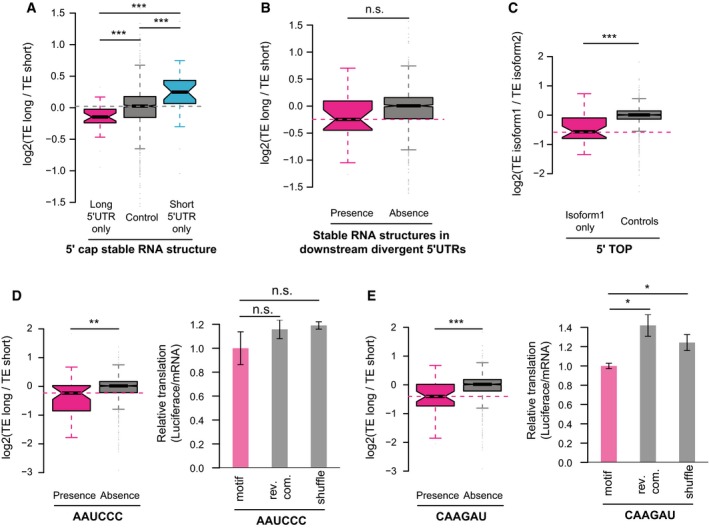
Boxplots comparing the log2 TE fold changes between three groups of alternative isoform pairs, the first group with 5ʹ cap‐adjacent (50 nt to 5ʹ ends) stable RNA secondary structures (MFE < −30 kcal/mol) present only in long 5ʹUTR isoforms, the second group with 5ʹ cap‐adjacent stable RNA structure present/absent in both isoforms, and the last group with 5ʹ cap‐adjacent stable RNA structure present only in short 5ʹUTR isoforms.
Boxplots comparing the log2 TE fold changes between two groups of alternative isoform pairs, one group with stable RNA secondary structures (MFE < −35 kcal/mol in any 50‐nt RNA fragments) present in the downstream divergent 5ʹUTR and the other without.
Boxplots comparing the log2 TE fold changes between TOP genes and non‐TOP genes (controls). For TOP genes, the TE fold changes were the ratios between the isoforms with 5ʹ TOP sequences present and isoforms without, and for non‐TOP genes, isoforms were randomly assigned as numerators and denominators.
Left: Boxplots comparing the log2 TE fold changes between two groups of alternative isoform pairs, one group with the motif AAUCCC present in divergent 5ʹUTRs and the other without.
Right: Luciferase assay comparing the relative TE between reporter genes with five copies of motif AAUCCC, reverse complement of motif AAUCCC, and randomly shuffled sequences in their 5ʹUTRs (n = 3; mean ± SEM; n.s. P > 0.05).
Similar to (D), but the motif is CAAGAU (n = 3; mean ± SEM; *P < 0.05; Student's t‐test).
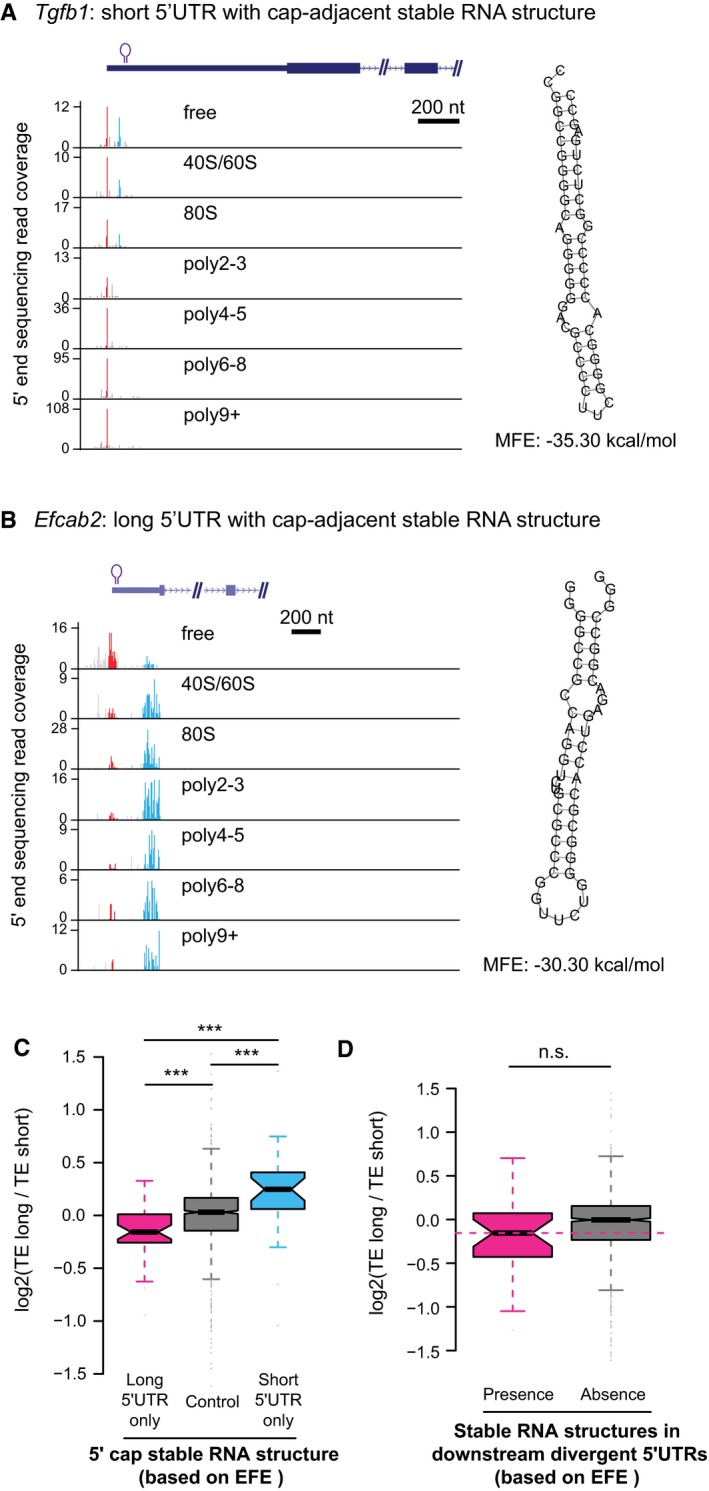
- A, B
Two examples showing that cap‐adjacent stable RNA structures repressed translation. The description of the two genes can be found in Table EV3.
- C, D
Same as Fig 5A and B, but based on EFE to define stable RNA structures. ***P < 0.001; Mann–Whitney U‐test. Box edges represent quantiles, whiskers represent extreme data points no more than 1.5 times the interquartile range.
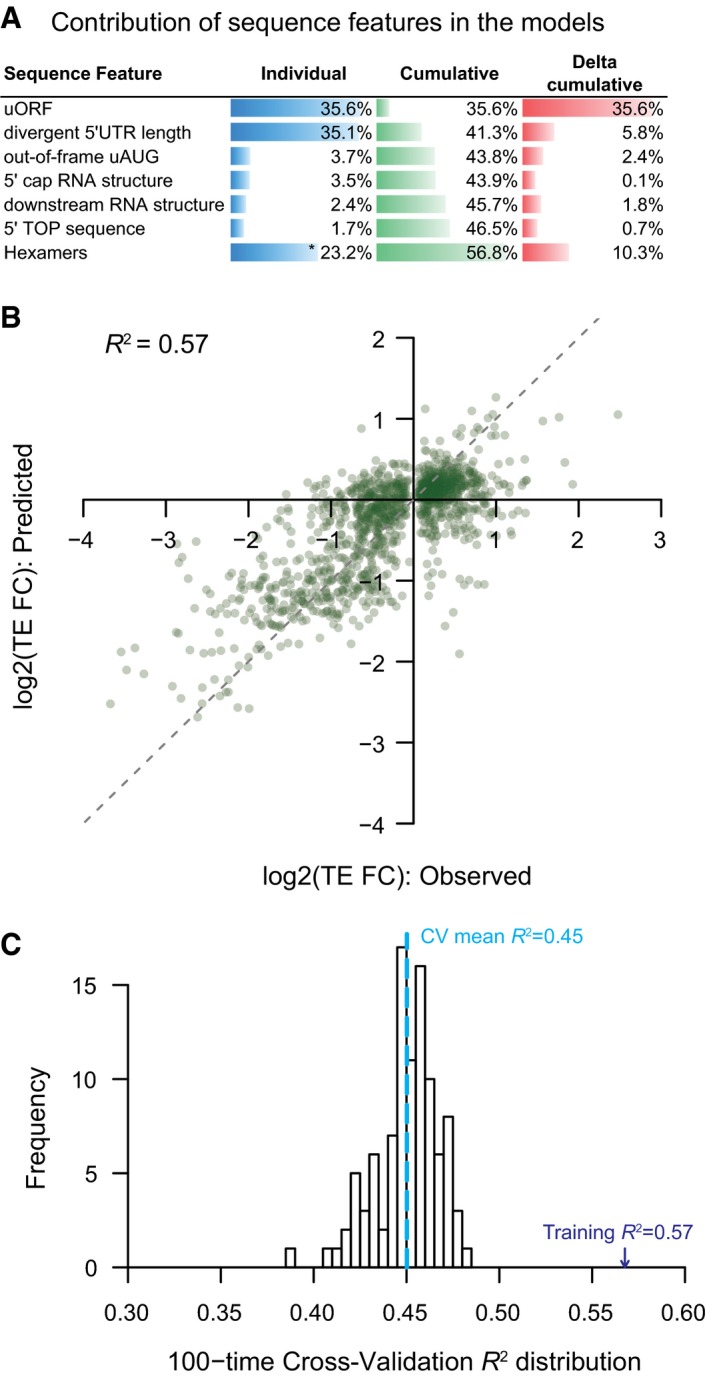
Barplots showing the individual and cumulative contribution for sequence features in explaining the TE difference between alternative TSS isoforms. Individual: variance of TE divergence explained by the model with only the sequence feature; Cumulative: variance explained by the model combining the sequence feature and those above; Delta cumulative: additional variance explained by adding the sequence feature to the model. *The value was the contribution of all significant hexamer motifs.
The combinatory nonlinear regression model based on all sequences features investigated in this study explained 57% variance of TE difference between alternative TSS isoforms.
Histogram showing the distribution of model‐explained variance in the 100 times cross‐validation procedure.
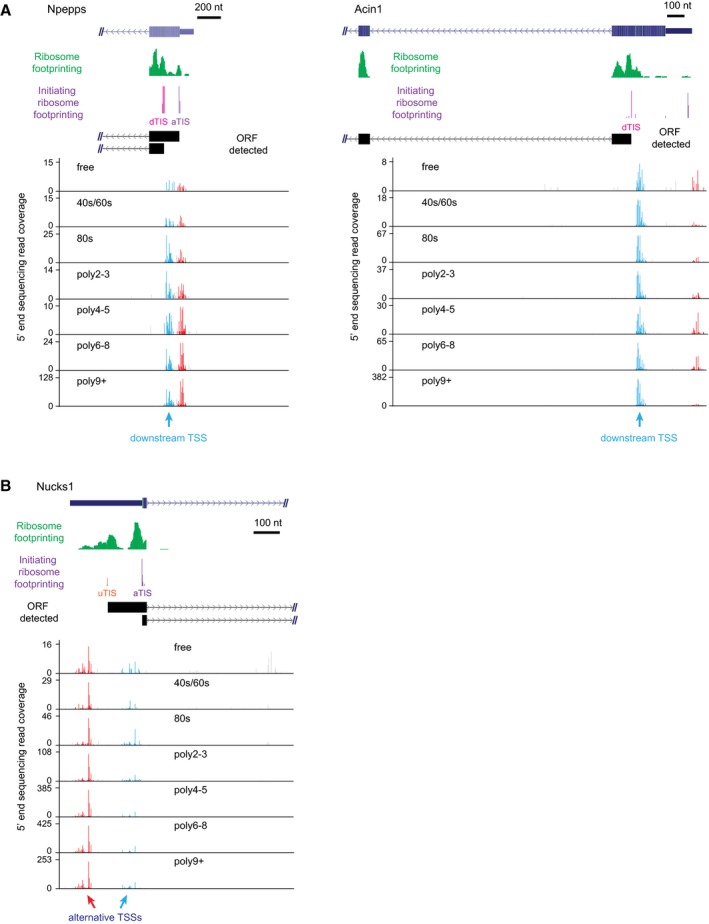
Downstream TSSs could lead to N‐terminal truncated proteins. Two examples were shown here. The description of the two genes can be found in Table EV3.
Alternative TSS could also lead to N‐terminal extended proteins. One example was shown here. The description of this gene can be found in Table EV3.
Similar articles
-
Evolution of alternative and constitutive regions of mammalian 5'UTRs.BMC Genomics. 2009 Apr 16;10:162. doi: 10.1186/1471-2164-10-162. BMC Genomics. 2009. PMID: 19371439 Free PMC article.
-
Novel splice variants in the 5'UTR of Gtf2i expressed in the rat brain: alternative 5'UTRs and differential expression in the neuronal dendrites.J Neurochem. 2015 Aug;134(3):578-89. doi: 10.1111/jnc.13136. Epub 2015 May 14. J Neurochem. 2015. PMID: 25913238
-
Exploring the selective constraint on the sizes of insertions and deletions in 5' untranslated regions in mammals.BMC Evol Biol. 2011 Jul 5;11:192. doi: 10.1186/1471-2148-11-192. BMC Evol Biol. 2011. PMID: 21726469 Free PMC article.
-
Cis-regulatory RNA elements that regulate specialized ribosome activity.RNA Biol. 2015;12(10):1083-7. doi: 10.1080/15476286.2015.1085149. Epub 2015 Sep 1. RNA Biol. 2015. PMID: 26327194 Free PMC article. Review.
-
TOPs and their regulation.Biochem Soc Trans. 2006 Feb;34(Pt 1):12-6. doi: 10.1042/BST20060012. Biochem Soc Trans. 2006. PMID: 16246169 Review.
Cited by
-
Translatomics: The Global View of Translation.Int J Mol Sci. 2019 Jan 8;20(1):212. doi: 10.3390/ijms20010212. Int J Mol Sci. 2019. PMID: 30626072 Free PMC article. Review.
-
Alternative transcription start sites contribute to acute-stress-induced transcriptome response in human skeletal muscle.Hum Genomics. 2022 Jul 22;16(1):24. doi: 10.1186/s40246-022-00399-8. Hum Genomics. 2022. PMID: 35869513 Free PMC article.
-
Selective translational usage of TSS and core promoters revealed by translatome sequencing.BMC Genomics. 2019 Apr 11;20(1):282. doi: 10.1186/s12864-019-5650-0. BMC Genomics. 2019. PMID: 30987607 Free PMC article.
-
Unveiling the A-to-I mRNA editing machinery and its regulation and evolution in fungi.Nat Commun. 2024 May 10;15(1):3934. doi: 10.1038/s41467-024-48336-8. Nat Commun. 2024. PMID: 38729938 Free PMC article.
-
Identification and Functional Characterization of Alternative Transcripts of LncRNA HNF1A-AS1 and Their Impacts on Cell Growth, Differentiation, Liver Diseases, and in Response to Drug Induction.Noncoding RNA. 2024 Apr 21;10(2):28. doi: 10.3390/ncrna10020028. Noncoding RNA. 2024. PMID: 38668386 Free PMC article.
References
-
- Arce L, Yokoyama NN, Waterman ML (2006) Diversity of LEF/TCF action in development and disease. Oncogene 25: 7492–7504 - PubMed
Publication types
MeSH terms
Substances
LinkOut - more resources
Full Text Sources
Other Literature Sources
Molecular Biology Databases
