Biophysical differences between chronic myelogenous leukemic quiescent and proliferating stem/progenitor cells
- PMID: 27431055
- PMCID: PMC5116407
- DOI: 10.1016/j.nano.2016.06.016
Biophysical differences between chronic myelogenous leukemic quiescent and proliferating stem/progenitor cells
Abstract
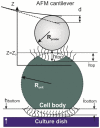
The treatment of chronic myeloid leukemia (CML), a clonal myeloproliferative disorder has improved recently, but most patients have not yet been cured. Some patients develop resistance to the available tyrosine kinase treatments. Persistence of residual quiescent CML stem cells (LSCs) that later resume proliferation is another common cause of recurrence or relapse of CML. Eradication of quiescent LSCs is a promising approach to prevent recurrence of CML. Here we report on new biophysical differences between quiescent and proliferating CD34+ LSCs, and speculate how this information could be of use to eradicate quiescent LSCs. Using AFM measurements on cells collected from four untreated CML patients, substantial differences are observed between quiescent and proliferating cells in the elastic modulus, pericellular brush length and its grafting density at the single cell level. The higher pericellular brush densities of quiescent LSCs are common for all samples. The significance of these observations is discussed.
Keywords: Atomic force microscopy; Cell mechanics; Chronic myeloid leukemia; Personalized medicine; Single cell analysis.
Copyright © 2016 Elsevier Inc. All rights reserved.
Figures


Similar articles
-
Selective and effective targeting of chronic myeloid leukemia stem cells by topoisomerase II inhibitor etoposide in combination with imatinib mesylate in vitro.Cell Biol Int. 2017 Jan;41(1):16-23. doi: 10.1002/cbin.10686. Epub 2016 Nov 16. Cell Biol Int. 2017. PMID: 27677634
-
Erosion of the chronic myeloid leukaemia stem cell pool by PPARγ agonists.Nature. 2015 Sep 17;525(7569):380-3. doi: 10.1038/nature15248. Epub 2015 Sep 2. Nature. 2015. PMID: 26331539
-
Depletion of γ-catenin by Histone Deacetylase Inhibition Confers Elimination of CML Stem Cells in Combination with Imatinib.Theranostics. 2016 Aug 12;6(11):1947-62. doi: 10.7150/thno.16139. eCollection 2016. Theranostics. 2016. PMID: 27570562 Free PMC article.
-
Treatment and molecular monitoring update in chronic myeloid leukemia management.Ann Biol Clin (Paris). 2017 Apr 1;75(2):129-145. doi: 10.1684/abc.2017.1233. Ann Biol Clin (Paris). 2017. PMID: 28377326 Review. English.
-
The implication of cancer progenitor cells and the role of epigenetics in the development of novel therapeutic strategies for chronic myeloid leukemia.Antioxid Redox Signal. 2015 Jun 1;22(16):1425-62. doi: 10.1089/ars.2014.6096. Epub 2015 Jan 19. Antioxid Redox Signal. 2015. PMID: 25366930 Review.
Cited by
-
Detection of Human Bladder Epithelial Cancerous Cells with Atomic Force Microscopy and Machine Learning.Cells. 2024 Dec 26;14(1):14. doi: 10.3390/cells14010014. Cells. 2024. PMID: 39791715 Free PMC article.
-
The Revolution in Breast Cancer Diagnostics: From Visual Inspection of Histopathology Slides to Using Desktop Tissue Analysers for Automated Nanomechanical Profiling of Tumours.Bioengineering (Basel). 2024 Feb 28;11(3):237. doi: 10.3390/bioengineering11030237. Bioengineering (Basel). 2024. PMID: 38534510 Free PMC article. Review.
-
Manipulation and Mechanical Deformation of Leukemia Cells by High-Frequency Ultrasound Single Beam.IEEE Trans Ultrason Ferroelectr Freq Control. 2022 Jun;69(6):1889-1897. doi: 10.1109/TUFFC.2022.3170074. Epub 2022 May 26. IEEE Trans Ultrason Ferroelectr Freq Control. 2022. PMID: 35468061 Free PMC article.
-
AFM study shows prominent physical changes in elasticity and pericellular layer in human acute leukemic cells due to inadequate cell-cell communication.Nanotechnology. 2016 Dec 9;27(49):494005. doi: 10.1088/0957-4484/27/49/494005. Epub 2016 Nov 11. Nanotechnology. 2016. PMID: 27834315 Free PMC article.
References
-
- Faderl S, Talpaz M, Estrov Z, O'Brien S, Kurzrock R, Kantarjian HM. The biology of chronic myeloid leukemia. N Engl J Med. 1999;341:164–72. - PubMed
-
- Clarkson B, Strife A, Wisniewski D, Lambek CL, Liu C. Chronic myelogenous leukemia as a paradigm of early cancer and possible curative strategies. Leukemia. 2003;17:1211–62. - PubMed
-
- Jabbour E, Kantarjian H. Chronic myeloid leukemia: 2012 update on diagnosis, monitoring, and management. Am J Hematol. 2012;87:1037–45. - PubMed
-
- Jabbour E, Kantarjian H. Chronic myeloid leukemia: 2014 update on diagnosis, monitoring, and management. Am J Hematol. 2014;89:547–56. - PubMed
MeSH terms
Substances
Grants and funding
LinkOut - more resources
Full Text Sources
Other Literature Sources
Medical
Miscellaneous

