

Insertion sequence-caused large-scale rearrangements in the genome of Escherichia coli
- PMID: 27431326
- PMCID: PMC5009759
- DOI: 10.1093/nar/gkw647
Insertion sequence-caused large-scale rearrangements in the genome of Escherichia coli
Abstract
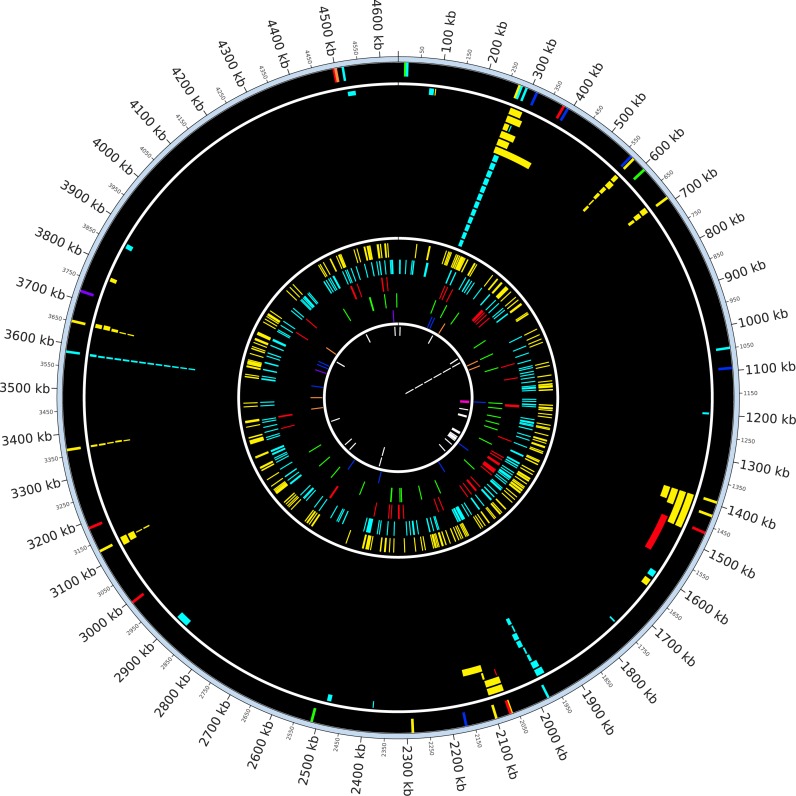
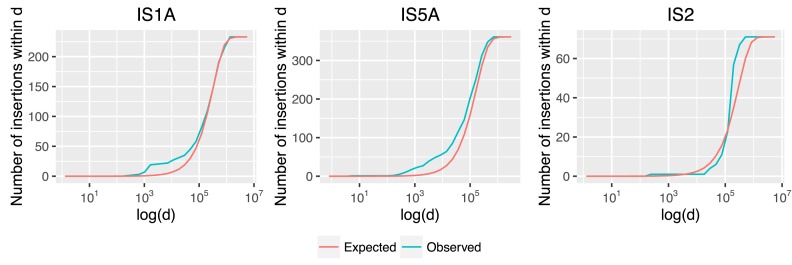
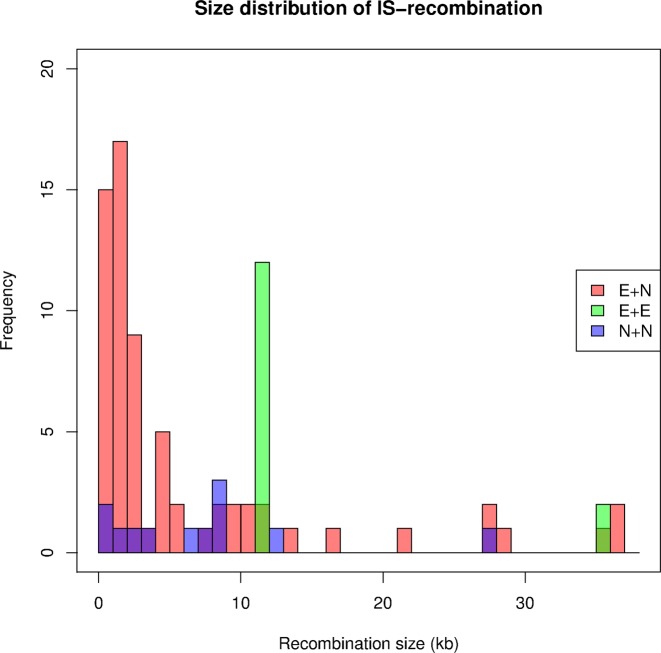
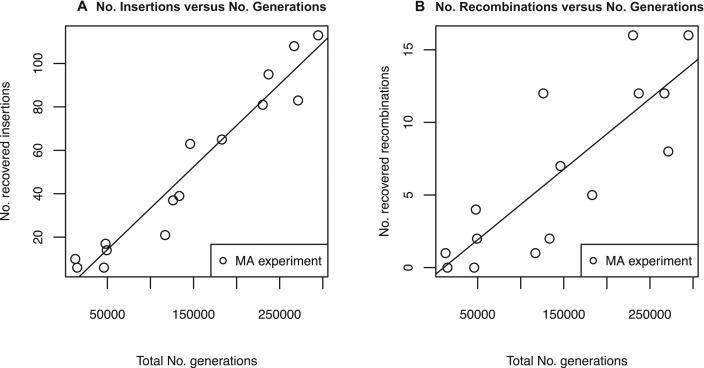
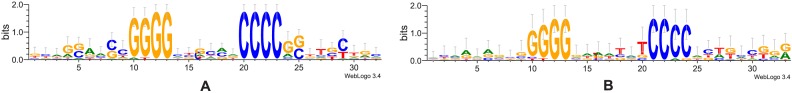
A majority of large-scale bacterial genome rearrangements involve mobile genetic elements such as insertion sequence (IS) elements. Here we report novel insertions and excisions of IS elements and recombination between homologous IS elements identified in a large collection of Escherichia coli mutation accumulation lines by analysis of whole genome shotgun sequencing data. Based on 857 identified events (758 IS insertions, 98 recombinations and 1 excision), we estimate that the rate of IS insertion is 3.5 × 10(-4) insertions per genome per generation and the rate of IS homologous recombination is 4.5 × 10(-5) recombinations per genome per generation. These events are mostly contributed by the IS elements IS1, IS2, IS5 and IS186 Spatial analysis of new insertions suggest that transposition is biased to proximal insertions, and the length spectrum of IS-caused deletions is largely explained by local hopping. For any of the ISs studied there is no region of the circular genome that is favored or disfavored for new insertions but there are notable hotspots for deletions. Some elements have preferences for non-coding sequence or for the beginning and end of coding regions, largely explained by target site motifs. Interestingly, transposition and deletion rates remain constant across the wild-type and 12 mutant E. coli lines, each deficient in a distinct DNA repair pathway. Finally, we characterized the target sites of four IS families, confirming previous results and characterizing a highly specific pattern at IS186 target-sites, 5'-GGGG(N6/N7)CCCC-3'. We also detected 48 long deletions not involving IS elements.
© The Author(s) 2016. Published by Oxford University Press on behalf of Nucleic Acids Research.
Figures
Similar articles
-
A more significant role for insertion sequences in large-scale rearrangements in bacterial genomes.mBio. 2025 Jan 8;16(1):e0305224. doi: 10.1128/mbio.03052-24. Epub 2024 Dec 5. mBio. 2025. PMID: 39636122 Free PMC article.
-
Rates of transposition in Escherichia coli.Biol Lett. 2013 Dec 4;9(6):20130838. doi: 10.1098/rsbl.2013.0838. Print 2013. Biol Lett. 2013. PMID: 24307531 Free PMC article.
-
Insertions of transposable elements in the promoter proximal region of the gene cluster for Escherichia coli H+-ATPase: 8 base pair repeat generated by insertion of IS1.Mol Gen Genet. 1984;194(1-2):179-87. doi: 10.1007/BF00383514. Mol Gen Genet. 1984. PMID: 6328213
-
Transposable elements and adaptation of host bacteria.Genetica. 1994;93(1-3):5-12. doi: 10.1007/BF01435235. Genetica. 1994. PMID: 7813917 Review.
-
Mutational equilibrium model of genome size evolution.Theor Popul Biol. 2002 Jun;61(4):531-44. doi: 10.1006/tpbi.2002.1605. Theor Popul Biol. 2002. PMID: 12167373 Review.
Cited by
-
Conserved Patterns of Symmetric Inversion in the Genome Evolution of Bordetella Respiratory Pathogens.mSystems. 2019 Nov 19;4(6):e00702-19. doi: 10.1128/mSystems.00702-19. mSystems. 2019. PMID: 31744907 Free PMC article.
-
Genomic Changes and Genetic Divergence of Vibrio alginolyticus Under Phage Infection Stress Revealed by Whole-Genome Sequencing and Resequencing.Front Microbiol. 2021 Oct 4;12:710262. doi: 10.3389/fmicb.2021.710262. eCollection 2021. Front Microbiol. 2021. PMID: 34671325 Free PMC article.
-
A metagenomics pipeline reveals insertion sequence-driven evolution of the microbiota.bioRxiv [Preprint]. 2024 Mar 9:2023.10.06.561241. doi: 10.1101/2023.10.06.561241. bioRxiv. 2024. Update in: Cell Host Microbe. 2024 May 8;32(5):739-754.e4. doi: 10.1016/j.chom.2024.03.005. PMID: 37873088 Free PMC article. Updated. Preprint.
-
Transposable elements contribute to the genome plasticity of Ralstonia solanacearum species complex.Microb Genom. 2020 May;6(5):e000374. doi: 10.1099/mgen.0.000374. Epub 2020 May 7. Microb Genom. 2020. PMID: 32379020 Free PMC article.
-
Two mechanisms of chromosome fragility at replication-termination sites in bacteria.Sci Adv. 2021 Jun 18;7(25):eabe2846. doi: 10.1126/sciadv.abe2846. Print 2021 Jun. Sci Adv. 2021. PMID: 34144978 Free PMC article.
References
-
- Varshney R.K., Nayak S.N., May G.D., Jackson S.A. Next-generation sequencing technologies and their implications for crop genetics and breeding. Trends Biotechnol. 2009;27:522–530. - PubMed
-
- Brockhurst M.A., Colegrave N., Rozen D.E. Next-generation sequencing as a tool to study microbial evolution. Mol. Ecol. 2011;20:972–980. - PubMed
-
- Casjens S. The diverse and dynamic structure of bacterial genomes. Annu. Rev. Genet. 1998;32:339–377. - PubMed
-
- Roth J.R., Benson N., Galitski T., Haack K., Lawrence J.G., Miesel L. Escherichia Coli and Salmonella: Cellular and Molecular Biology. Vol. 2. Washington D.C.: ASM Press; 1996. Rearrangements of the bacterial chromosome: formation and applications; pp. 2256–2276.
MeSH terms
Substances
LinkOut - more resources
Full Text Sources
Other Literature Sources
