. 2016 Jul 18;5(7):e003868.
doi: 10.1161/JAHA.116.003868.

Genetic Abrogation of Adenosine A3 Receptor Prevents Uninephrectomy and High Salt-Induced Hypertension

Affiliations

Genetic Abrogation of Adenosine A3 Receptor Prevents Uninephrectomy and High Salt-Induced Hypertension

Ting Yang et al. J Am Heart Assoc. .

Abstract

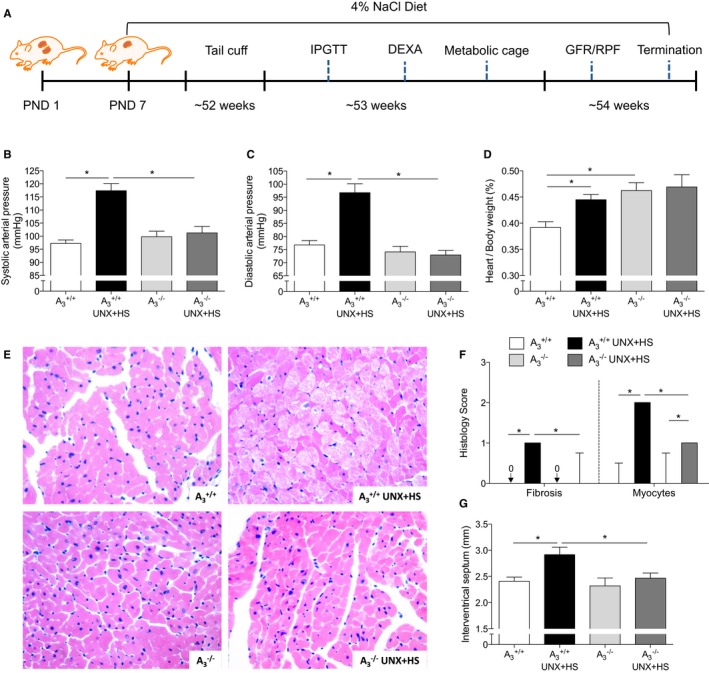
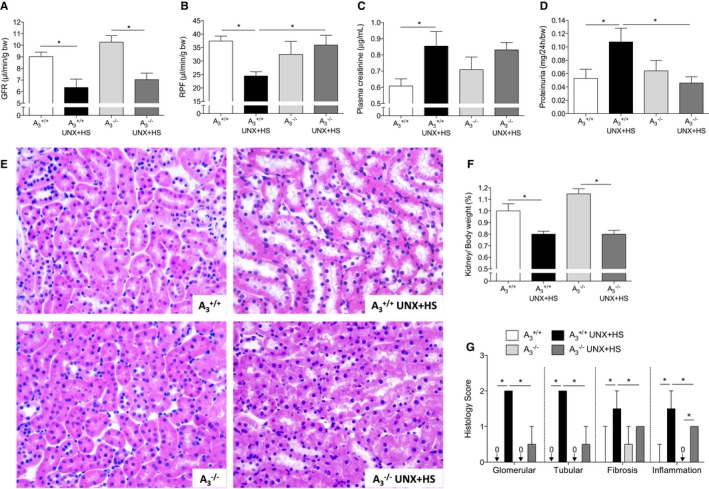
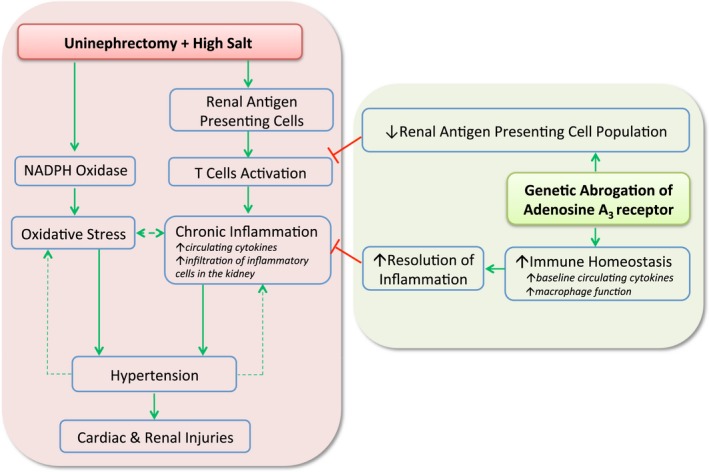
Background: Early-life reduction in nephron number (uninephrectomy [UNX]) and chronic high salt (HS) intake increase the risk of hypertension and chronic kidney disease. Adenosine signaling via its different receptors has been implicated in modulating renal, cardiovascular, and metabolic functions as well as inflammatory processes; however, the specific role of the A3 receptor in cardiovascular diseases is not clear. In this study, gene-modified mice were used to investigate the hypothesis that lack of A3 signaling prevents the development of hypertension and attenuates renal and cardiovascular injuries following UNX in combination with HS (UNX-HS) in mice.

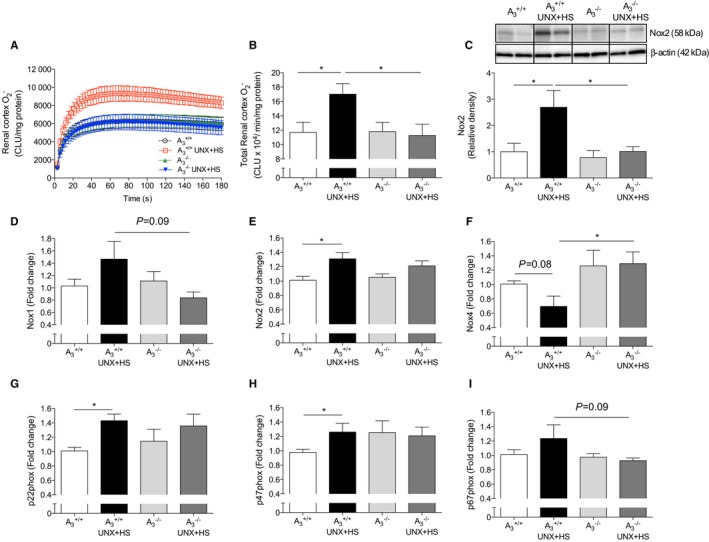
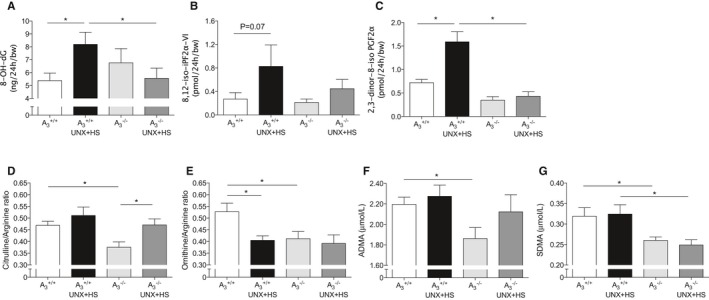
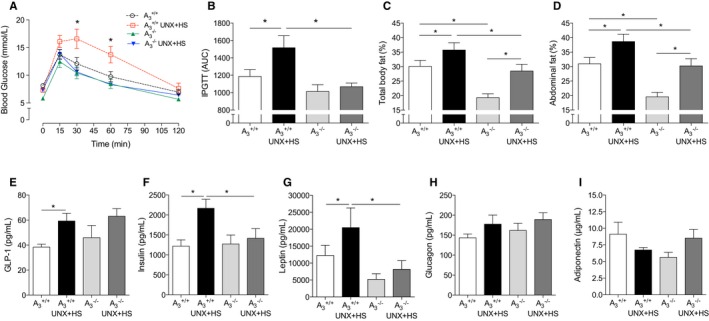
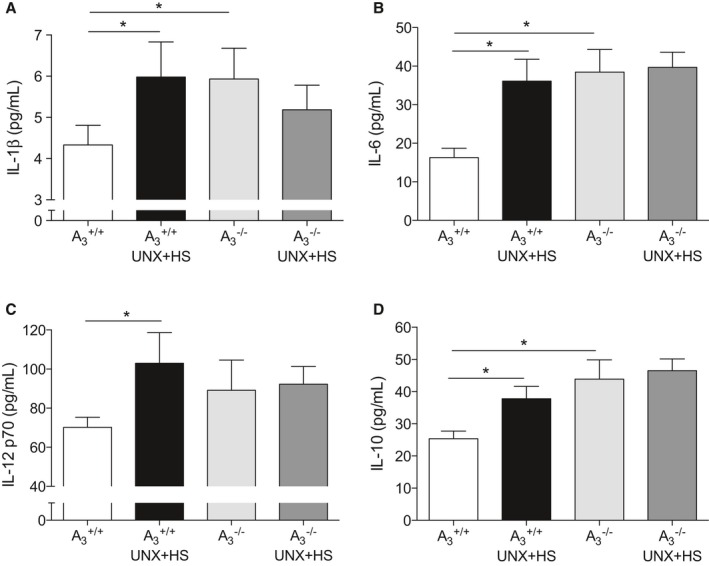
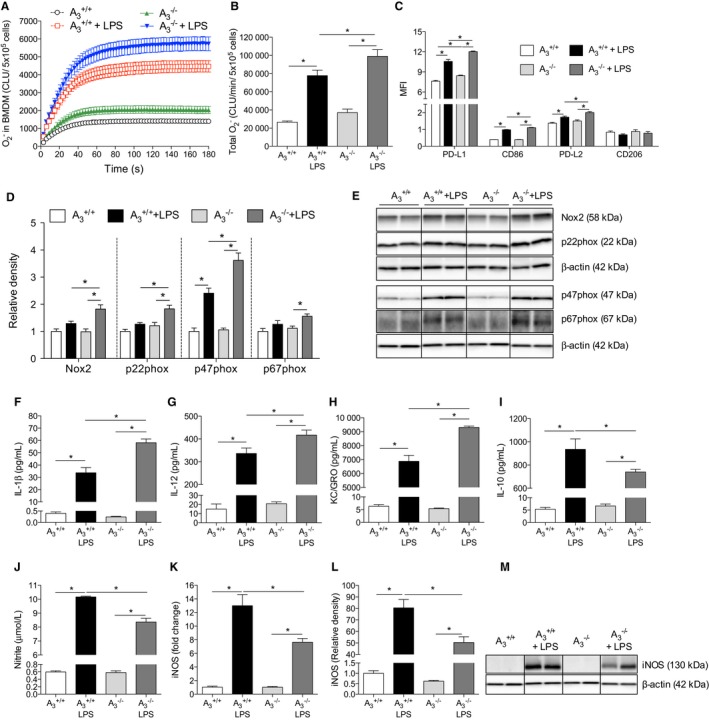
Methods and results: Wild-type (A3 (+/+)) mice subjected to UNX-HS developed hypertension compared with controls (mean arterial pressure 106±3 versus 82±3 mm Hg; P<0.05) and displayed an impaired metabolic phenotype (eg, increased adiposity, reduced glucose tolerance, hyperinsulinemia). These changes were associated with both cardiac hypertrophy and fibrosis together with renal injuries and proteinuria. All of these pathological hallmarks were significantly attenuated in the A3 (-/-) mice. Mechanistically, absence of A3 receptors protected from UNX-HS-associated increase in renal NADPH oxidase activity and Nox2 expression. In addition, circulating cytokines including interleukins 1β, 6, 12, and 10 were increased in A3 (+/+) following UNX-HS, but these cytokines were already elevated in naïve A3 (-/-) mice and did not change following UNX-HS.

Conclusions: Reduction in nephron number combined with chronic HS intake is associated with oxidative stress, chronic inflammation, and development of hypertension in mice. Absence of adenosine A3 receptor signaling was strongly protective in this novel mouse model of renal and cardiovascular disease.

Keywords: NADPH oxidase; adenosine receptor; cardiovascular disease; high salt diet; inflammation; kidney; nephron number; uninephrectomy.


Figures

Figure 1
Figure 1
Blood pressure and heart histology. A, The protocol and timeline of experiments. UNX in combination with HS (UNXHS) significantly increased the systolic and diastolic arterial pressure in A3 +/+ but not in A3 −/− mice (B and C). 2×2 ANOVA revealed significant (P<0.0001) interaction (ie, effects of genotype on the response to UNXHS). UNXHS also increased the heart/body weight ratio in A3 +/+ mice; the A3 −/− mice had a higher baseline heart/body weight ratio compared with A3 +/+ mice but were not affected by UNXHS (D). Representative pictures of hematoxylin and eosin staining in the heart are shown in (E). The A3 +/+ mice showed significantly worse pathological changes in the heart following UNXHS, which was evaluated as fibrosis and myocyte histological scores (F). The thickness of the intraventricular septum was significantly increased in the A3 +/+ mice after UNXHS, but there were no changes in the A3 −/− group (G). Data are shown as mean±SEM, except in (F), in which results are presented as median and interquartile range. *P<0.05, n=8 to 12 per group. DEXA indicates dual‐emission x‐ray absorptiometry; GFR, glomerular filtration rate; HS, high salt; IPGTT, intraperitoneal glucose tolerance test; PND, postnatal day; RPF, renal plasma flow; UNX, uninephrectomy.
Figure 2
Figure 2
Renal function and histology. UNX in combination with HS (UNXHS) caused significant reduction of GFR in both genotypes (A), but RPF was reduced only in A3 +/+ mice (B). 2×2 ANOVA did not reveal any interaction (ie, effects of genotype on the response to UNXHS) for GFR, but significant (P<0.0001) interaction was found for RPF. Plasma creatinine and proteinuria were significantly increased after UNXHS in A3 +/+ mice but were not changed in A3 −/− mice (C and D). Urinary protein excretion after UNXHS was also significantly lower in A3 −/− mice compared with A3 +/+ mice (D). UNXHS induced multiple renal histopathological changes in both genotypes, but these were more pronounced in the A3 +/+ mice after UNXHS compared with A3 −/− mice (G). Representative pictures of hematoxylin and eosin staining in the kidney are shown in (E). Kidney weight are similar between genotypes both at baseline and after UNX‐HS (F). Data are shown as mean±SEM, except in (G), in which results are presented as median and interquartile range. *P<0.05, n=8 to 12 per group. GFR indicates glomerular filtration rate; HS, high salt; RPF, renal plasma flow; UNX, uninephrectomy.
Figure 3
Figure 3
Nox activity and expression in kidney. Nox‐derived O2 generation and Nox2 protein level were significantly increased in the renal cortex in A3 +/+ mice after UNX in combination with HS (UNXHS), but none of these were changed following UNXHS in the A3 −/− mice (A–C). UNXHS associated with increased mRNA expressions of Nox2, whereas Nox1 and Nox4 were not significantly changed in A3 +/+ mice (D–F). p22phox and p47phox expression were increased in A3 +/+ mice but not in the A3 −/− mice following UNXHS (G and H). No significant changes in p67phox were observed, although expression trended higher in A3 +/+ compared with A3 −/− mice after UNXHS (I). Data are shown as mean±SEM, *P<0.05, n=8 to 12 per group. CLU indicates chemiluminescence unit; HS, high salt; Nox, NADPH oxidase; UNX, uninephrectomy.
Figure 4
Figure 4
Plasma markers of oxidative stress and nitric oxide synthase activity. Urinary excretion of the oxidative stress markers 8‐OHdG (A), 8,12‐iso‐iPF2α‐VI (B), and its metabolite 2,3‐dinor‐8‐iso iPF2α (C) were increased in A3 +/+ mice after UNX in combination with HS (UNXHS) but were not significantly changed in the A3 −/− mice. UNXHS caused significant increase of plasma citrulline/arginine ratio in A3 −/− mice (D) and significant reduction of plasma ornithine/arginine ratio in A3 +/+ mice only (E). Baseline levels of both citrulline/arginine and ornithine/arginine ratios were lower in the A3 −/− mice compared with A3 +/+ mice. A3 −/− mice had significantly lower plasma ADMA and SDMA levels (F and G). Although UNXHS did not influence circulating ADMA and SDMA levels, the SDMA level after UNXHS was significantly lower in A3 −/− compared with A3 +/+ mice. Data are shown as mean±SEM, *P<0.05, n=8 to 12 per group. ADMA indicates asymmetric dimethylarginine; HS, high salt; SDMA, symmetric dimethylarginine; UNX, uninephrectomy.
Figure 5
Figure 5
Glucose handling, fat content, and metabolic markers in plasma. UNX in combination with HS (UNXHS) significantly impaired glucose clearance ability in the A3 +/+ mice but not in the A3 −/− mice (A and B). 2×2 ANOVA revealed significant (P<0.05) interaction (ie, effects of genotype on the response to UNXHS) for the glucose tolerance responses. Although fat content increased in both genotypes after UNXHS, the A3 −/− mice showed significantly less total body fat content and abdominal fat content at both baseline and after UNXHS compared with A3 +/+ mice (C and D). GLP‐1, insulin, and leptin levels in the A3 +/+ mice were significantly increased after UNXHS, but the levels of these metabolic hormones were not changed with UNXHS in the A3 −/− mice (E–G). Insulin and leptin were also significantly lower in the A3 −/− UNXHS mice compared with A3 +/+ UNXHS mice (F and G). No significant differences in circulating glucagon were observed (H). Adiponectin levels trended toward being reduced in A3 +/+ mice but increased in A3 −/− mice after UNXHS (I). Data are shown as mean±SEM, *P<0.05, n=8 to 12 per group (A–D), n=8 to 10 per group (E–I). AUC indicates area under the curve; GLP‐1, glucagon‐like peptide 1; HS indicates high salt; IPGTT, intraperitoneal glucose tolerance test; UNX, uninephrectomy.
Figure 6
Figure 6
Systemic cytokines. Plasma IL‐1β, IL‐6, IL‐12, and IL‐10 levels were all significantly increased after UNX in combination with HS (UNXHS) in the A3 +/+ mice (A–D). UNXHS did not affect plasma cytokines levels in A3 −/− mice; however, A3 −/− mice had significantly higher baseline IL‐1β, IL‐6, and IL‐10 compared with A3 +/+ mice. Data are shown as mean±SEM, *P<0.05, n=8 to 12 per group. HS indicates high salt; IL, interleukin; UNX, uninephrectomy.
Figure 7
Figure 7
Antigen‐presenting cells in the kidney. A, The gating of the cell population. In kidneys from A3 −/− mice, there was significant less proportion of major histocompatibility complex class II (H2iab+) cells in both CD11b+ macrophages and CD11c+ dendritic cells compared with those from A3 +/+ mice (B). Data are shown as mean±SEM, *P<0.05, n=9 per group. HS indicates high salt; UNX, uninephrectomy.
Figure 8
Figure 8
Bone marrow‐derived macrophages. NADPH oxidase‐derived O2 production was significantly increased in the BMDMs following 24 hours of LPS stimulation (10 ng/mL), with this increase being greater in A3 −/− BMDMs (A and B). As indicated by MFI, both M1 markers (PD‐L1 and CD86) and M2 marker (PD‐L2) were significantly increased after LPS stimulation in both genotypes (C). Moreover, cells from A3 −/− expressed higher surface markers after LPS compared with A3 +/+. No differences of CD206 level were observed between groups. LPS significantly increased Nox2, p22phox, and p67phox protein levels in A3 −/− BMDMs but not in the A3 +/+ cells (D and E). The p47phox protein was increased in both genotypes following LPS stimulation; however, after LPS stimulation, the Nox2, p22phox, and p47phox levels were significantly higher in cells from A3 −/− mice than from A3 +/+ mice. The IL‐1β, IL‐12, KC/GRO, and IL‐10 levels in the cell culture medium were significantly increased after LPS stimulation (24 hours) in both genotypes, but the cytokine levels of IL‐1β, IL‐12, and KC/GRO were significantly higher in BMDMs from A3 −/− compared with A3 +/+ mice (F–I). Nitrite levels in the culture medium were significantly increased in both genotypes following LPS stimulation (J); however, nitrite was significantly lower in the A3 −/− group compared with the A3 +/+ group. In agreement with the nitrite levels, both mRNA (K) and protein levels (L and M) of iNOS showed similar patterns. Data are shown as mean±SEM, *P<0.05, n=6 per group (A and B), n=4 to 5 per group (C–J), n=3 to 6 per group (K–M). BMDM indicates bone marrow‐derived macrophage; CLU, chemiluminescence unit; IL, interleukin; iNOS, inducible nitric oxide synthase; KC/GRO, keratinocyte chemoattractant/human growth‐regulated oncogene; LPS, lipopolysaccharide; MFI, mean fluorescence intensity; Nox2, NADPH oxidase 2; PD‐L, programmed death ligand.
Figure 9
Figure 9
Proposed mechanisms contributing to a protective renal and cardiovascular phenotype in adenosine A3 knockout mice following reduction in nephron number at early age and chronic feeding with high salt diet. Early age reduction of nephron number (UNX) combined with an HS diet (UNX‐HS) induces hypertension, which is associated with increased renal oxidative stress and inflammation in wild‐type mice. Our study demonstrates that gene‐modified mice lacking the adenosine A3 receptor are protected from the development of hypertension and organ injuries in this chronic model of renal and cardiovascular disease. Mechanistically, we proposed a novel role of the A3 receptors in modulating immune system development and homeostasis, which affects the ability to fight chronic inflammation and oxidative stress during conditions of renal and cardiovascular disease. Red lines denote inhibition or negative feedback, whereas the green arrows represent stimulation of a particular response. The dashed green arrows indicate a vicious cycle once hypertension is established, contributing to oxidative stress and progressive inflammation as well as accelerated renal and cardiac injuries following UNXHS. HS indicates high salt; UNX, uninephrectomy.

Similar articles

Cited by

References

    1. Luyckx VA, Brenner BM. Birth weight, malnutrition and kidney‐associated outcomes—a global concern. Nat Rev Nephrol. 2015;11:135–149. - PubMed
    1. Carlstrom M, Sallstrom J, Skott O, Larsson E, Persson AE. Uninephrectomy in young age or chronic salt loading causes salt‐sensitive hypertension in adult rats. Hypertension. 2007;49:1342–1350. - PubMed
    1. Moritz KM, Wintour EM, Dodic M. Fetal uninephrectomy leads to postnatal hypertension and compromised renal function. Hypertension. 2002;39:1071–1076. - PubMed
    1. Woods LL, Weeks DA, Rasch R. Hypertension after neonatal uninephrectomy in rats precedes glomerular damage. Hypertension. 2001;38:337–342. - PubMed
    1. Carlstrom M, Persson AE, Larsson E, Hezel M, Scheffer PG, Teerlink T, Weitzberg E, Lundberg JO. Dietary nitrate attenuates oxidative stress, prevents cardiac and renal injuries, and reduces blood pressure in salt‐induced hypertension. Cardiovasc Res. 2011;89:574–585. - PubMed

Publication types

MeSH terms

Substances