

Changes in mitochondrial stability during the progression of the Barrett's esophagus disease sequence
- PMID: 27431913
- PMCID: PMC4950724
- DOI: 10.1186/s12885-016-2544-2
Changes in mitochondrial stability during the progression of the Barrett's esophagus disease sequence
Abstract
Background: Barrett's esophagus follows the classic step-wise progression of metaplasia-dysplasia-adenocarcinoma. While Barrett's esophagus is a leading known risk factor for esophageal adenocarcinoma, the pathogenesis of this disease sequence is poorly understood. Mitochondria are highly susceptible to mutations due to high levels of reactive oxygen species (ROS) coupled with low levels of DNA repair. The timing and levels of mitochondria instability and dysfunction across the Barrett's disease progression is under studied.
Methods: Using an in-vitro model representing the Barrett's esophagus disease sequence of normal squamous epithelium (HET1A), metaplasia (QH), dysplasia (Go), and esophageal adenocarcinoma (OE33), random mitochondrial mutations, deletions and surrogate markers of mitochondrial function were assessed. In-vivo and ex-vivo tissues were also assessed for instability profiles.
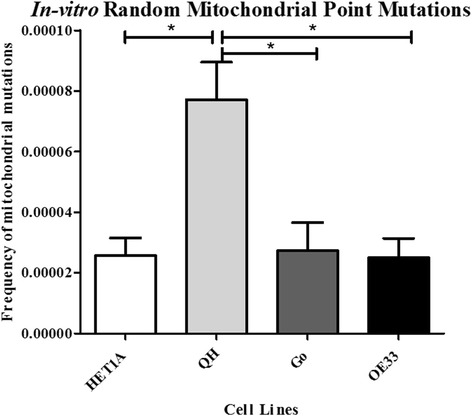
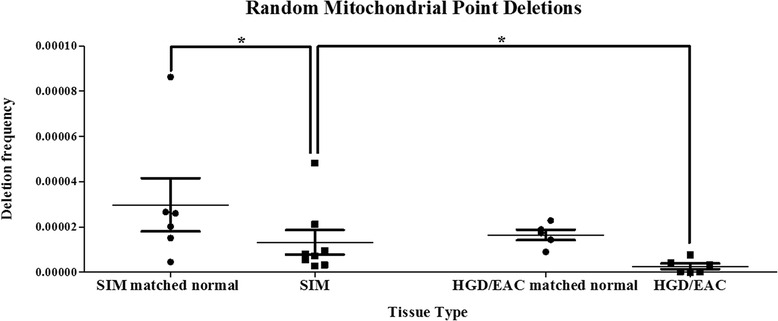
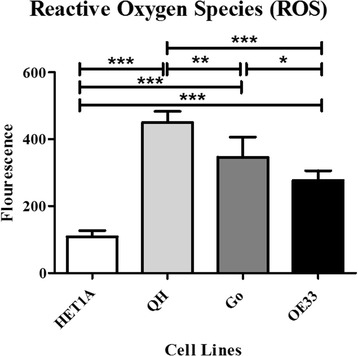
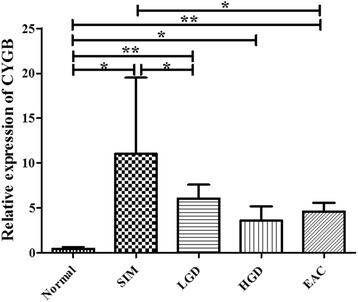
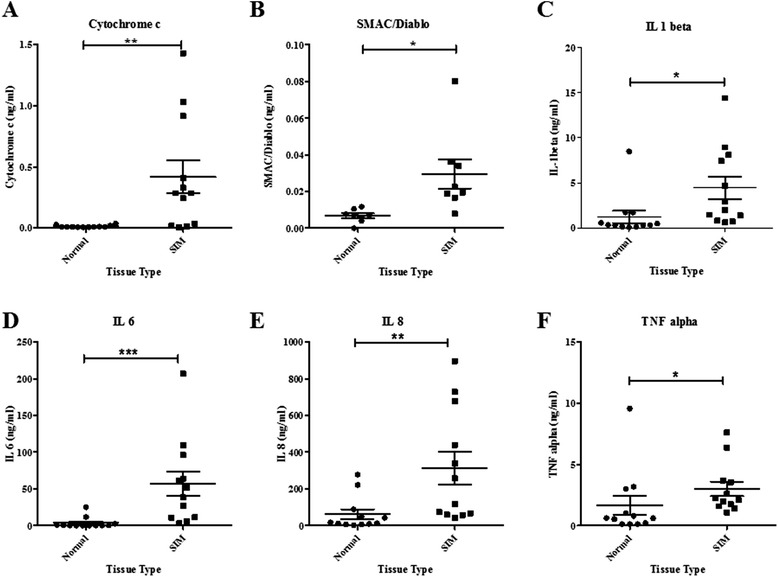
Results: Barrett's metaplastic cells demonstrated increased levels of ROS (p < 0.005) and increased levels of random mitochondrial mutations (p < 0.05) compared with all other stages of the Barrett's disease sequence in-vitro. Using patient in-vivo samples, Barrett's metaplasia tissue demonstrated significantly increased levels of random mitochondrial deletions (p = 0.043) compared with esophageal adenocarcinoma tissue, along with increased expression of cytoglobin (CYGB) (p < 0.05), a gene linked to oxidative stress, compared with all other points across the disease sequence. Using ex-vivo Barrett's metaplastic and matched normal patient tissue explants, higher levels of cytochrome c (p = 0.003), SMAC/Diablo (p = 0.008) and four inflammatory cytokines (all p values <0.05) were secreted from Barrett's metaplastic tissue compared with matched normal squamous epithelium.
Conclusions: We have demonstrated that increased mitochondrial instability and markers of cellular and mitochondrial stress are early events in the Barrett's disease sequence.
Keywords: Barrett’s esophagus; Mitochondrial instability; Oxidative stress.
Figures
Similar articles
-
The Mitochondrial Genes BAK1, FIS1 and SFN are Linked with Alterations in Mitochondrial Membrane Potential in Barrett's Esophagus.Int J Mol Sci. 2018 Nov 6;19(11):3483. doi: 10.3390/ijms19113483. Int J Mol Sci. 2018. PMID: 30404157 Free PMC article.
-
Differential expression of mitochondrial energy metabolism profiles across the metaplasia-dysplasia-adenocarcinoma disease sequence in Barrett's oesophagus.Cancer Lett. 2014 Nov 1;354(1):122-31. doi: 10.1016/j.canlet.2014.07.035. Epub 2014 Aug 10. Cancer Lett. 2014. PMID: 25107643
-
Frequent occurrence of mitochondrial DNA mutations in Barrett's metaplasia without the presence of dysplasia.PLoS One. 2012;7(5):e37571. doi: 10.1371/journal.pone.0037571. Epub 2012 May 22. PLoS One. 2012. PMID: 22629421 Free PMC article.
-
Inflammation and Barrett's carcinogenesis.Pathol Res Pract. 2012 May 15;208(5):269-80. doi: 10.1016/j.prp.2012.03.007. Epub 2012 Apr 27. Pathol Res Pract. 2012. PMID: 22541897 Review.
-
Cellular and molecular mechanisms responsible for progression of Barrett's metaplasia to esophageal carcinoma.Gastroenterol Clin North Am. 2002 Jun;31(2):461-79, ix. doi: 10.1016/s0889-8553(02)00013-4. Gastroenterol Clin North Am. 2002. PMID: 12134613 Review.
Cited by
-
Role of Mitochondrial Markers in Improved Detection and Risk-Stratification in Barrett's Esophagus Patients.Yale J Biol Med. 2019 Sep 20;92(3):533-539. eCollection 2019 Sep. Yale J Biol Med. 2019. PMID: 31543714 Free PMC article. Review.
-
Diablo: A Double-Edged Sword in Cancer?Mol Ther. 2018 Mar 7;26(3):678-679. doi: 10.1016/j.ymthe.2018.02.004. Epub 2018 Feb 20. Mol Ther. 2018. PMID: 29472100 Free PMC article. No abstract available.
-
Trends in gastroesophageal reflux disease research: A bibliometric and visualized study.Front Med (Lausanne). 2022 Sep 29;9:994534. doi: 10.3389/fmed.2022.994534. eCollection 2022. Front Med (Lausanne). 2022. PMID: 36250094 Free PMC article.
-
Molecular Basis of the Anticancer and Antibacterial Properties of CecropinXJ Peptide: An In Silico Study.Int J Mol Sci. 2021 Jan 12;22(2):691. doi: 10.3390/ijms22020691. Int J Mol Sci. 2021. PMID: 33445613 Free PMC article.
-
Amprenavir Mitigates Pepsin-Induced Transcriptomic Changes in Normal and Precancerous Esophageal Cells.Int J Mol Sci. 2025 Jun 26;26(13):6182. doi: 10.3390/ijms26136182. Int J Mol Sci. 2025. PMID: 40649959 Free PMC article.
References
MeSH terms
Substances
LinkOut - more resources
Full Text Sources
Other Literature Sources
