. 2016 Jul 19:6:29846.
doi: 10.1038/srep29846.

Focal adhesions control cleavage furrow shape and spindle tilt during mitosis

Affiliations

Focal adhesions control cleavage furrow shape and spindle tilt during mitosis

Nilay Taneja et al. Sci Rep. .

Abstract

The geometry of the cleavage furrow during mitosis is often asymmetric in vivo and plays a critical role in stem cell differentiation and the relative positioning of daughter cells during development. Early observations of adhesive cell lines revealed asymmetry in the shape of the cleavage furrow, where the bottom (i.e., substrate attached side) of the cleavage furrow ingressed less than the top (i.e., unattached side). This data suggested substrate attachment could be regulating furrow ingression. Here we report a population of mitotic focal adhesions (FAs) controls the symmetry of the cleavage furrow. In single HeLa cells, stronger adhesion to the substrate directed less ingression from the bottom of the cell through a pathway including paxillin, focal adhesion kinase (FAK) and vinculin. Cell-cell contacts also direct ingression of the cleavage furrow in coordination with FAs in epithelial cells-MDCK-within monolayers and polarized cysts. In addition, mitotic FAs established 3D orientation of the mitotic spindle and the relative positioning of mother and daughter centrosomes. Therefore, our data reveals mitotic FAs as a key link between mitotic cell shape and spindle orientation, and may have important implications in our understanding stem cell homeostasis and tumorigenesis.


Figures
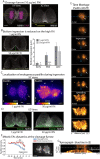
Figure 1
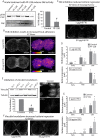
Figure 1. Substrate adhesion controls the symmetry of the cleavage furrow.
(A) XY and XZ views of the cleavage furrow of a HeLa cell cultured on 10 μg/mL FN and stained for endogenous NMIIA and DNA. (B) XZ views of the cleavage furrow of cells cultured on low (1 μg/mL) and high (50 μg/mL) FN substrates. XZ projections were made from a similar sized ROI as in (A). Ingression from the bottom (double headed green arrow) was measured as the distance between the substrate (dotted yellow line) and the bottom of the cleavage furrow. Cells were grouped based on the height of the cleavage furrow into early (>15 μm), mid (9–15 μm) and late (3–9 μm) stages of ingression. Measurements were made on 34 cells and 42 cells for 1 μg/mL and 50 μg/mL FN, respectively, across 6 independent experiments for each condition (see Methods). (C) XY views of HeLa cells at anaphase stained for paxillin, cultured on low and high adhesive substrates. Look up table is fire and color bars show the gray scale values of the images. White arrows show retraction fiber adhesions and green arrows show mitotic FAs. (D) Merged XZ views of HeLa cells at anaphase stained for paxillin (green) and NMIIA (gray) cultured on low and high adhesive substrates. XY views are shown in Figure S1C. (E) TIRF time montage of a HeLa cell expressing Paxillin-mEGFP and H2B-mCherry cultured on high adhesive substrate undergoing anaphase imaged using TIRF microscopy. Ingression starts at 0 min and the arrowheads indicate the position of the cleavage furrow. Arrows denote the side with larger adhesions maintained until the daughter cells start spreading at 10 min. (F) Quantification of relative paxillin intensity comparing adhesions underneath the cleavage furrow (red ROI in inset) and immediately adjacent to the cleavage furrow (blue ROI in inset). Measurements were made from 7 cells across 5 independent experiments. (G) Kymograph created from blue line in (C). Dotted line denotes the onset of ingression. * denotes p < 0.05 and ** denotes p < 0.01; Scale bars, 5 μm. Error bars show standard error of the mean (SEM).
Figure 2
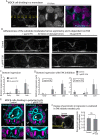
Figure 2. Molecular mechanisms governing mitotic Fas.
(A) Western blot to validate acute inhibition of FAK using the FAK inhibitor (PF-228). Lysates were prepared from cells treated for 10 minutes versus untreated controls from 3 independent experiments. Total FAK was used as loading control. Intensities for each lane were normalized to the respective loading controls. (B,C) XY (B) and XZ (C) views of HeLa cells at anaphase stained for NMIIA and paxillin, cultured on low (top) and high (bottom) adhesive substrate treated with 1 μM FAK inhibitor PF-228. (D) Quantification of bottom ingression comparing FAK inhibitor treated versus untreated control cells cultured on low and high FN substrates. Cells were grouped into early, mid and late anaphase based on the height of the cytokinetic ring as in Fig. 1. Measurements were made on 31 cells across 4 independent experiments and 30 cells across 3 independent experiments for 1 and 50 μg/mL FN, respectively. (E) Validation of si-RNA knockdown of vinculin using western blotting and immunofluorescence. For western blotting, intensities for each lane were normalized to the respective tubulin loading controls. Each knockdown was then normalized to the respective scrambled (Scr) control. N = 3 independent experiments, each performed with pooled siRNAs containing 4 independent siRNAs. For immunofluorescence, control and knockdown HeLa cells were stained for endogenous vinculin. (F) XZ views of vinculin knockdown HeLa cells at anaphase cultured on low and high adhesive substrates G) Quantification of bottom ingression comparing vinculin knockdown versus control cells cultured on low and high adhesive substrates. Cells were grouped into early, mid and late anaphase as in Fig. 1. Measurements were made on 17 cells across 3 independent experiments and 24 cells across 4 independent experiments for 1 μg/ml and 50 μg/ml FN, respectively. Each experiment was performed using pooled siRNAs containing 4 independent siRNAs. Scale bars in (B,C) and (F), 5 μm; (E), 100 μm. *denotes p < 0.05 and ** denotes p < 0.01. Error bars in (A,D,E,G) show standard error of the mean (SEM).
Figure 3
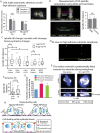
Figure 3. Adhesiveness of the substrate also controls the shape of the cleavage furrow in epithelial systems.
(A) XY view of a cell dividing in a MDCK monolayer (B) XZ views of control (top row) and FAK inhibitor treated (bottom row) cells dividing within a monolayer grown on low (left column) and high (right column) adhesive substrates. The XZ projections of the cleavage furrow were created from a thin slice (marked by dotted yellow box in (A)) passing through the long axis of the cell. (C) Quantification of basolateral ingression comparing low and high adhesive substrates. (D) Quantification of basolateral ingression comparing control and treated cells on low and high adhesive substrates. Cells were grouped into early (>10 μm), mid (6–10 μm) and late (1–5 μm) anaphase based upon the height of the cytokinetic ring. For the graph comparing control cells, measurements were made on 33 cells across 3 independent experiments and 36 cells across 4 independent experiments for 1 μg/ml and 50 μg/ml FN respectively. For the graph comparing FAK treated cells with control cells, measurements were made on 23 cells for 1 μg/ml FN and 24 cells for 50 μg/ml FN across 3 independent experiments for each condition. (E) Cross sections through a MDCK cyst showing cells at anaphase in either control (left) or FAK inhibitor treated (right) cysts stained with phalloidin (cyan) and DAPI (magenta). Shown are maximum projections of six 200 nm Z slices, with magnified views of the region marked by the dotted yellow rectangle below. (F) Quantification of degree of asymmetry in furrow ingression comparing control and FAK inhibitor treated cysts. Y axis represents the degree of asymmetry, calculated as ratio of basolateral versus apical ingression as shown in the inset. Measurements were made on 11 control cysts across 5 independent experiments and 4 PF-228 treated cysts across 3 independent experiments. Scale bars: 5 μm; * denotes p<0.05.
Figure 4
Figure 4. Adhesiveness of the substrate modulates the XZ orientation of the spindle.
(A) Quantification of degree of asymmetry in attachment on low and high adhesive substrates using TIRF. ROIs on either side of the cleavage furrow ROI were compared. Measurements were made from 8 cells across 5 independent experiments as in Fig. 2D for 50 μg/mL FN and 4 cells across 4 independent experiments on 1 μg/mL FN. (B) Methods used to quantify spindle tilt. XZ tilt of the spindle was calculated by either measuring the angle between the line joining the centroids of the chromosomes (solid magenta line) and the substrate (solid white line) or by measuring the angle between the line joining the centrosomes (solid green line) and the substrate (solid white line) using a HeLa cell line stably expressing GFP centrin. Dotted yellow line shows the substrate. Graph shows comparison of the two methods. Spindle tilt was measured using both methods in 28 cells across 5 independent experiments. (C) Tukey plots comparing spindle tilt measured using the DNA centroids method across all experimental conditions tested for HeLa and MDCK cells in the study (D) XZ view of a HeLa cell stably expressing centrin GFP at anaphase on a high adhesive substrate showing the mother (m) and daughter (d) centrosomes. (E) Shown are confocal images of cells in metaphase on FN or poly-L-lysine, with XY and XZ views of DNA (blue), centrin (fire) and tubulin (gray). (F) Tukey plots comparing the average spindle tilt on poly-L-lysine versus FN during metaphase. (G) Graph comparing the propensity of the mother centrosome being tilted towards the substrate during metaphase and anaphase. H) Our model for how mitotic adhesions control the 3D shape of the cleavage furrow of single cells and cells within epithelial monolayers. m and d indicate mother and daughter centrosomes, respectively. Scale bars, 5 μm. * denotes p < 0.05, ** denotes p < 0.01 and *** denotes p < 0.005. Error bars in (A,B,G) shows standard error of the mean (SEM).

Similar articles

Cited by

References

    1. Gupton S. L. & Waterman-Storer C. M. Spatiotemporal feedback between actomyosin and focal-adhesion systems optimizes rapid cell migration. Cell 125, 1361–1374 (2006). - PubMed
    1. Gustafsson M. G. Nonlinear structured-illumination microscopy: wide-field fluorescence imaging with theoretically unlimited resolution. Proc Natl Acad Sci USA 102, 13081–13086 (2005). - PMC - PubMed
    1. Schermelleh L. et al.. Subdiffraction multicolor imaging of the nuclear periphery with 3D structured illumination microscopy. Science 320, 1332–1336 (2008). - PMC - PubMed
    1. Fishkind D. J. & Wang Y. L. Orientation and three-dimensional organization of actin filaments in dividing cultured cells. The Journal of Cell Biology 123, 837–848 (1993). - PMC - PubMed
    1. Mitchison T. J. Actin based motility on retraction fibers in mitotic PtK2 cells. Cell Motil Cytoskeleton 22, 135–151 (1992). - PubMed

Publication types

Substances