. 2017 May;37(5):1829-1840.
doi: 10.1177/0271678X16659303. Epub 2016 Jan 1.

Requisite ischemia for spreading depolarization occurrence after subarachnoid hemorrhage in rodents

Affiliations

Requisite ischemia for spreading depolarization occurrence after subarachnoid hemorrhage in rodents

Fumiaki Oka et al. J Cereb Blood Flow Metab. 2017 May.

Abstract

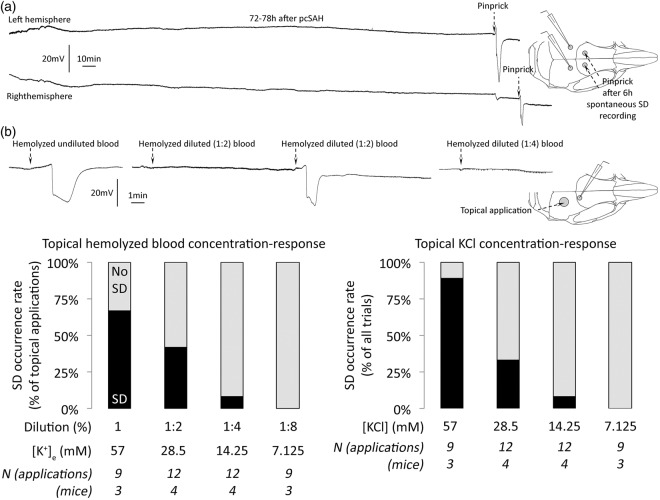
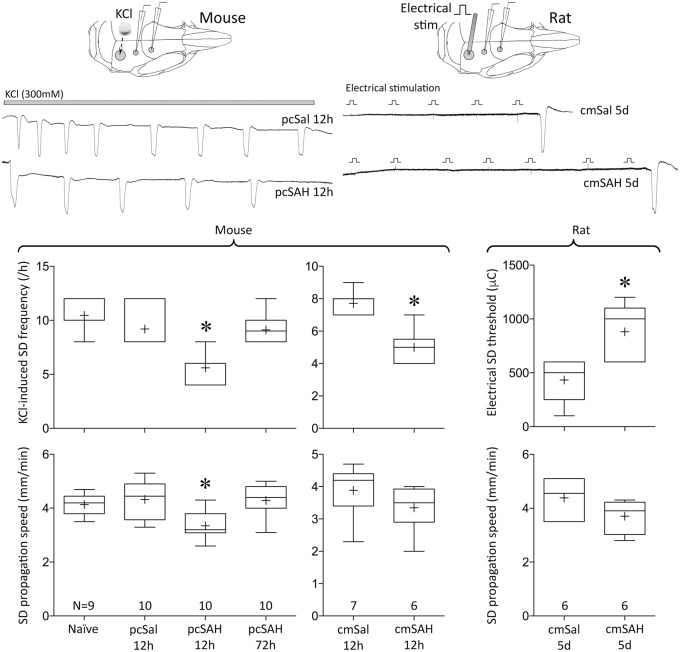
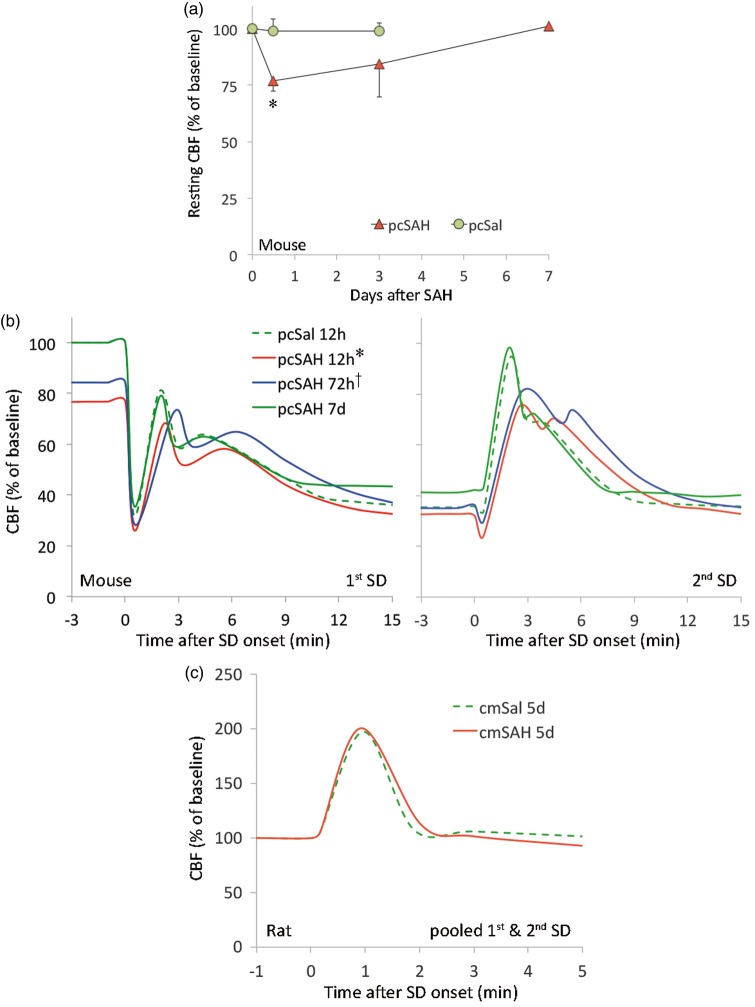
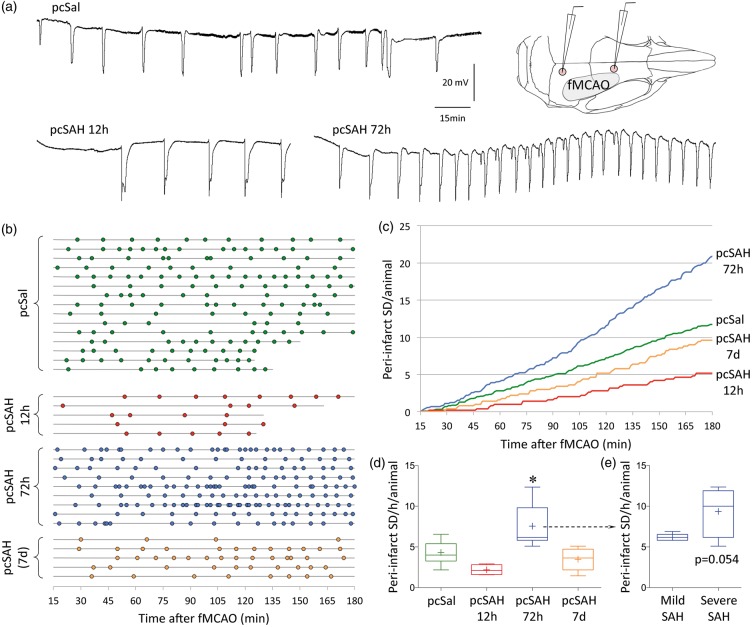
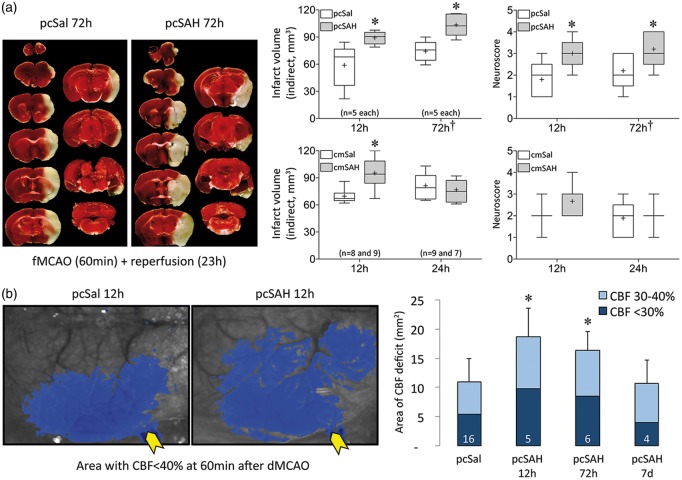
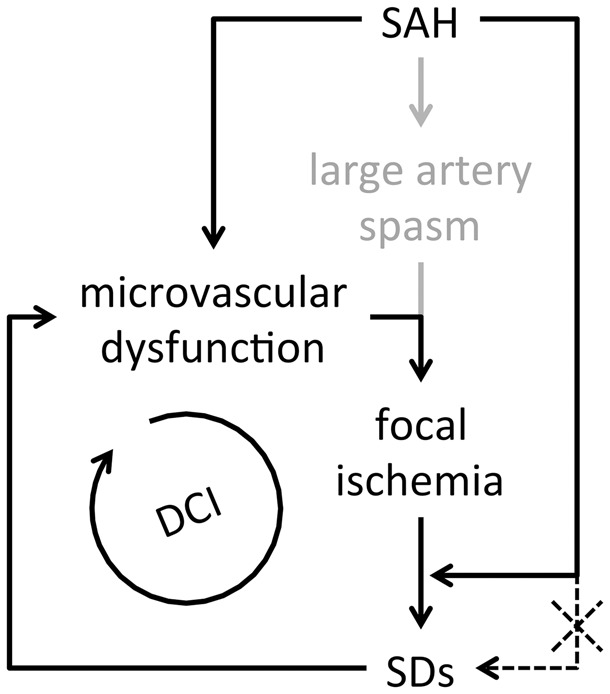
Spontaneous spreading depolarizations are frequent after various forms of human brain injury such as ischemic or hemorrhagic stroke and trauma, and worsen the outcome. We have recently shown that supply-demand mismatch transients trigger spreading depolarizations in ischemic stroke. Here, we examined the mechanisms triggering recurrent spreading depolarization events for many days after subarachnoid hemorrhage. Despite large volumes of subarachnoid hemorrhage induced by cisternal injection of fresh arterial blood in rodents, electrophysiological recordings did not detect a single spreading depolarization for up to 72 h after subarachnoid hemorrhage. Cortical susceptibility to spreading depolarization, measured by direct electrical stimulation or topical KCl application, was suppressed after subarachnoid hemorrhage. Focal cerebral ischemia experimentally induced after subarachnoid hemorrhage revealed a biphasic change in the propensity to develop peri-infarct spreading depolarizations. Frequency of peri-infarct spreading depolarizations decreased at 12 h, increased at 72 h and normalized at 7 days after subarachnoid hemorrhage compared with sham controls. However, ischemic tissue and neurological outcomes were significantly worse after subarachnoid hemorrhage even when peri-infarct spreading depolarization frequency was reduced. Laser speckle flowmetry implicated cerebrovascular hemodynamic mechanisms worsening the outcome. Altogether, our data suggest that cerebral ischemia is required for spreading depolarizations to be triggered after subarachnoid hemorrhage, which then creates a vicious cycle leading to the delayed cerebral ischemia syndrome.

Keywords: Subarachnoid hemorrhage; delayed cerebral ischemia; middle cerebral artery occlusion; peri-infarct depolarization; spreading depolarization.


Figures

Figure 1.
Figure 1.
Spontaneous SD occurrence after SAH, and topical blood as a trigger for SD. (a) Extracellular DC potential recordings bilaterally did not detect any spontaneous SD, as shown in these 6-h representative tracings taken between 72 and 78 h after pcSAH. The integrity of the recoding system was confirmed by detection of pinprick-induced SD sequentially in both hemispheres at the end of the monitoring period (dashed arrows). Inset shows electrode positioning. (b) The effect of topical application of hemolyzed blood is shown at different levels of dilution. Representative tracings show the efficacy of undiluted (100%) hemolyzed blood as well as two- (50%) and fourfold (25%) diluted blood to trigger SD upon topical application. Inset shows the electrode positioning and topical application site. Summary data show rapid decline in the efficacy of hemolyzed blood to trigger SD upon successive dilutions (left panel). Black bars show the percentage of all topical applications that triggered an SD at each dilution level. Undiluted hemolyzed blood had a highly consistent 57.3 ± 0.3 mM [K+]e (see “Methods” section), which was used to estimate the [K+]e of successive dilutions. In a separate cohort, we determined the KCl-concentration response relationship in triggering SD (right panel), and found that the efficacy of hemolyzed blood to trigger SD corresponded well with the efficacy of [K+]e in the hemolyzed sample. All KCl solutions were made isotonic by NaCl. Group sizes (N) are indicated under the bars.
Figure 2.
Figure 2.
SD susceptibility after SAH. Upper panel shows representative tracings of reduced frequency of repetitive SDs (left) induced by topical KCl (horizontal bar) after pcSAH compared with pcSal in the mouse, and higher threshold for escalating-intensity electrical stimulation-induced SD (right) in cmSAH compared with cmSal in the rat. Insets show the experimental setups. Lower panel shows summary data for SD susceptibility attributes. Group sizes (N) are indicated under the bars. *p < 0.05 vs. all other groups; one-way ANOVA (pcSAH) and unpaired t-test (cmSAH).
Figure 3.
Figure 3.
Resting CBF and changes during SD after SAH. (a) Resting CBF was calculated using the correlation time value measured by laser speckle flow imaging, as described previously. Values for each time point after pcSal or pcSAH were obtained in separate groups of mice. Each group was compared with its own baseline by repeat imaging. Compared with baseline, resting CBF decreased by ∼25% 12 h after pcSAH and gradually normalized over 7 days (*p < 0.05 vs. baseline; two-way repeated measures ANOVA within SAH group). Resting CBF did not change in pcSal group. N = 3 each in pcSal 12 h and 3 days; N = 5, 4, and 3 in pcSAH 12 h, 3 days, and 7 days, respectively. (b) Averaged CBF responses to SD in mice (two consecutive SDs 15 min apart) and rats (single SD). Each SD evoked typical CBF changes as described previously in mice and rats.,,, The pcSal group showed nearly identical CBF responses to SD in naïve mice (not shown). We found only minor, albeit statistically significant differences among the groups in mice (*p < 0.05 vs. all other groups in first SD, vs. pcSAH 72 h and 7 days in second SD; †p < 0.05 vs. pcSAH 12 h and 7 days in first SD only; two-way repeated measured ANOVA). Majority of the changes could be explained by the reduction in baseline CBF at 12 and 72 h (expressed as % of pre-injection baseline). (c) In rats, CBF response to SD did not differ between cmSal and cmSAH. Error bars were omitted for clarity. N = 5, 7, 5, and 3 mice in pcSal, pcSAH 12 h, pcSAH 72 h, and pcSAH 7 days, respectively. N = 6 rats each cmSal and cmSAH 5 days.
Figure 4.
Figure 4.
Peri-infarct SDs after SAH. (a) Representative tracings show recurrent peri-infarct SDs after filament middle cerebral artery occlusion (fMCAO) after pcSal, or 12 or 72 h after pcSAH. Inset shows electrode placement in relation to the cortical ischemic territory. (b) Peri-infarct SDs (circles) occurred in all animals and experimental groups throughout the recording period after fMCAO onset. Horizontal lines show the start and end of recording in each animal (n = 15, 5, 9, and 5 mice in pcSal and 12 h, 72 h, and 7-day pcSAH groups, respectively). (c) Cumulative peri-infarct SD occurrence is shown in each experimental group as a function of time. Shorter recordings in a few animals (as shown in (b)) were extrapolated to 180 min based on the average ongoing frequency in that animal. (d) The average hourly frequency of peri-infarct SD occurrence in each animal strongly tended to decrease at 12 h after pcSAH, significantly increased at 72 h, and normalized at 7 days. *p < 0.05 vs. all other groups, one-way ANOVA. (e) When we dichotomized the 72-h pcSAH group into mild or severe subarachnoid blood presence based on postmortem examination carried immediately after the electrophysiological recordings, we found a strong trend for the severe SAH subset (n = 4) to develop higher frequency of peri-infarct SDs than the mild SAH subset (n = 5; unpaired t-test).
Figure 5.
Figure 5.
Tissue and neurological outcomes and perfusion defect after focal cerebral ischemia induced at different time points after SAH. (a) Representative, TTC-stained, 1-mm thick coronal sections show the infarct (white tissue) 23 h after 60-min transient fMCAO induced 72 h after pcSal or pcSAH. Summary of tissue outcomes and neurological deficit scores are shown on the right. *p < 0.05 vs. pcSal; two-way ANOVA. In 12-h pcSAH and pcSal groups, we used 30-min fMCAO to minimize mortality; in all subsequent experiments, we used 60-min fMCAO. As a result, overall outcomes were worse in 72-h compared with 12-h group (†p < 0.05 vs. 12 h). Mortality was 1 in pcSAH 72 h, 3 in cmSal 12 h, 2 in cmSAH 12 h, and 2 in cmSAH 24 h. These are not included in the group sizes indicated on the figure. The volume of ischemic brain swelling (i.e. ipsilateral – contralateral hemisphere volume) did not differ between saline and SAH groups (data not shown). Group sizes are indicated under the bars. (b) Representative laser speckle flowmetry images of dorsal right hemisphere (upper panel) show the perfusion defect (residual CBF < 40% of pre-ischemic baseline, blue pixels) induced by dMCAO performed 12 h after pcSal or pcSAH. Yellow arrows point to the microvascular clip at the occlusion site. Lower panel shows averaged data using two different thresholding levels indicating moderate (light blue) and severe (dark blue) ischemia, respectively. *p < 0.05 vs. pcSal. Group sizes are indicated on the bars.
Figure 6.
Figure 6.
Proposed mechanism in which focal ischemia is a prerequisite for SDs after SAH. Vicious cycle created by focal ischemia, SDs and microvascular dysfunction after SAH lead to delayed cerebral ischemia and infarction (DCI). SAH alone is insufficient to directly trigger SDs (dashed line).

Similar articles

Cited by

References

    1. Lauritzen M, Dreier JP, Fabricius M, et al. Clinical relevance of cortical spreading depression in neurological disorders: migraine, malignant stroke, subarachnoid and intracranial hemorrhage, and traumatic brain injury. J Cereb Blood Flow Metab 2011; 31: 17–35. - PMC - PubMed
    1. Ayata C, Lauritzen M. Spreading depression, spreading depolarizations, and the cerebral vasculature. Physiol Rev 2015; 95: 953–993. - PMC - PubMed
    1. von Bornstadt D, Houben T, Seidel JL, et al. Supply-demand mismatch transients in susceptible peri-infarct hot zones explain the origins of spreading injury depolarizations. Neuron 2015; 85: 1117–1131. - PMC - PubMed
    1. Dreier JP. The role of spreading depression, spreading depolarization and spreading ischemia in neurological disease. Nat Med 2011; 17: 439–447. - PubMed
    1. Sabri M, Jeon H, Ai J, et al. Anterior circulation mouse model of subarachnoid hemorrhage. Brain Res 2009; 1295: 179–185. - PubMed

MeSH terms

LinkOut - more resources