. 2016 Jul 19:6:29898.
doi: 10.1038/srep29898.

FNDC5 expression and circulating irisin levels are modified by diet and hormonal conditions in hypothalamus, adipose tissue and muscle

Affiliations

FNDC5 expression and circulating irisin levels are modified by diet and hormonal conditions in hypothalamus, adipose tissue and muscle

B M Varela-Rodríguez et al. Sci Rep. .

Abstract

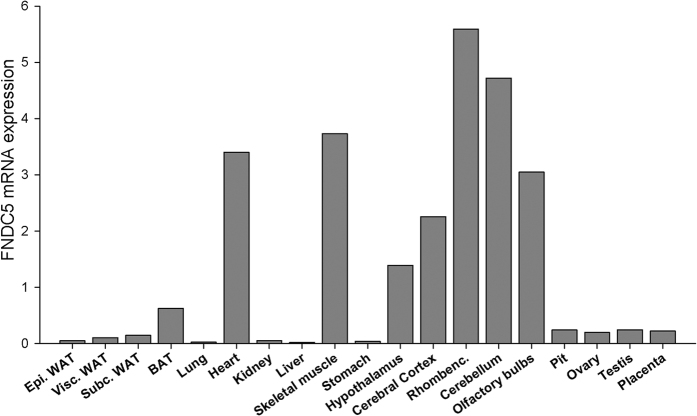
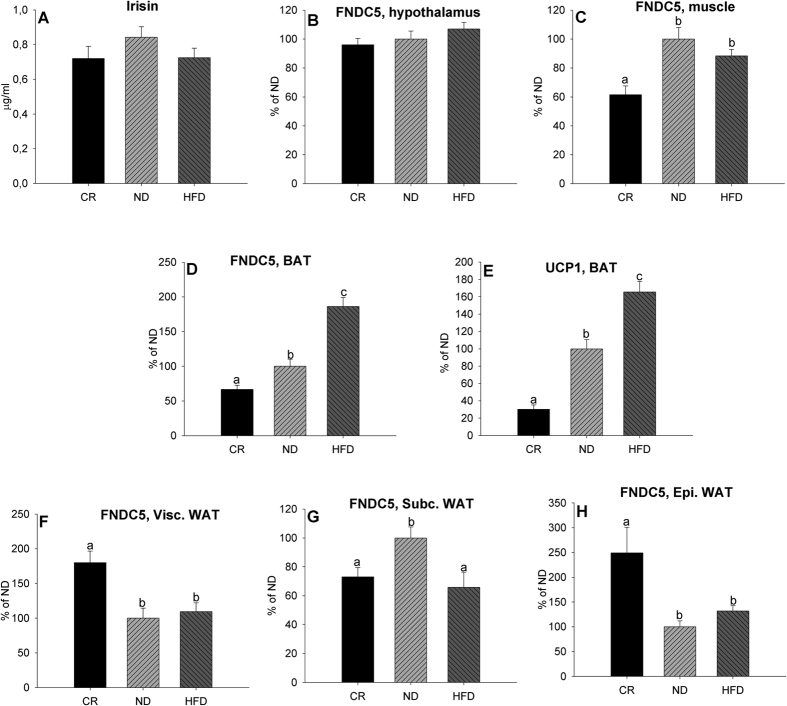
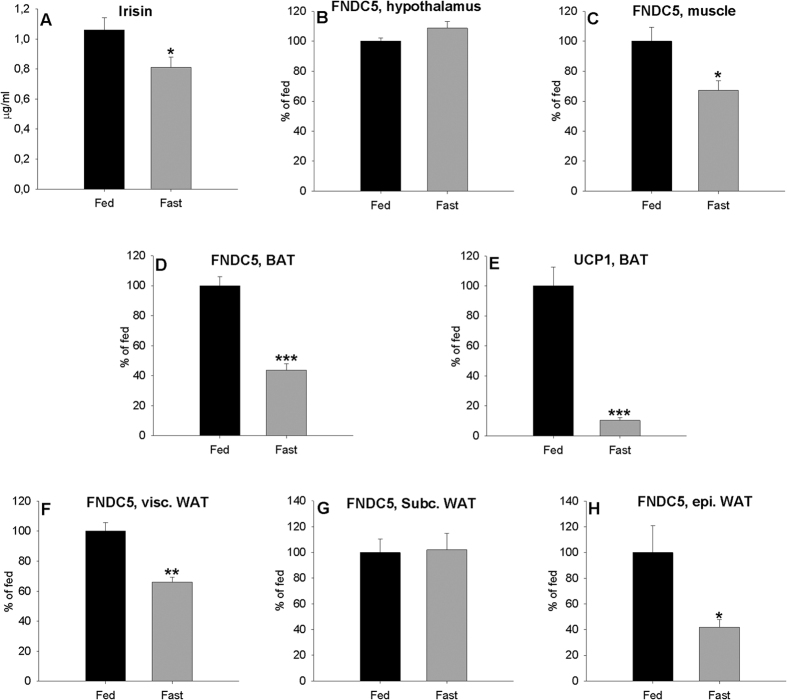
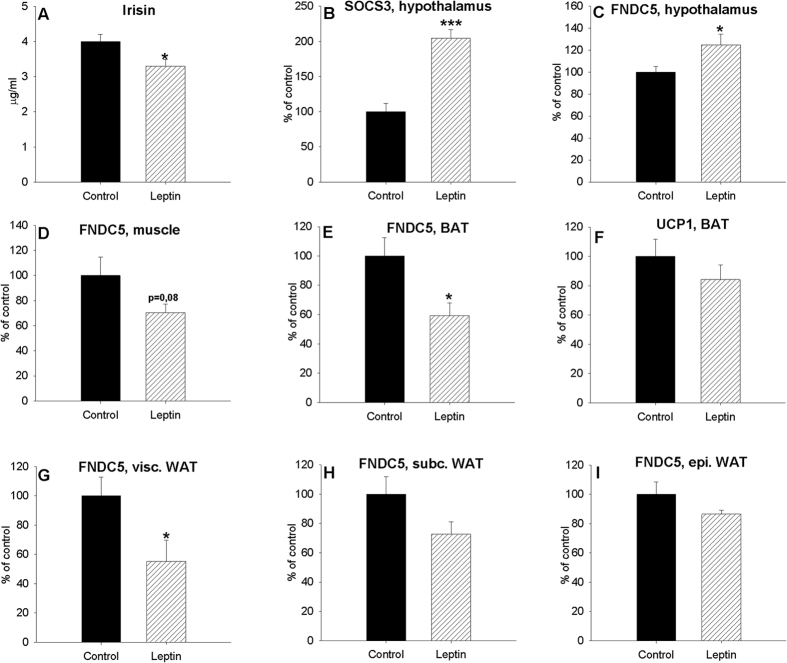
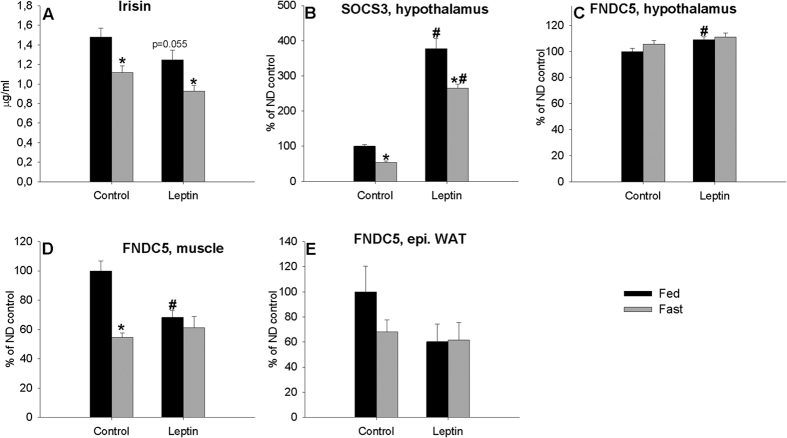
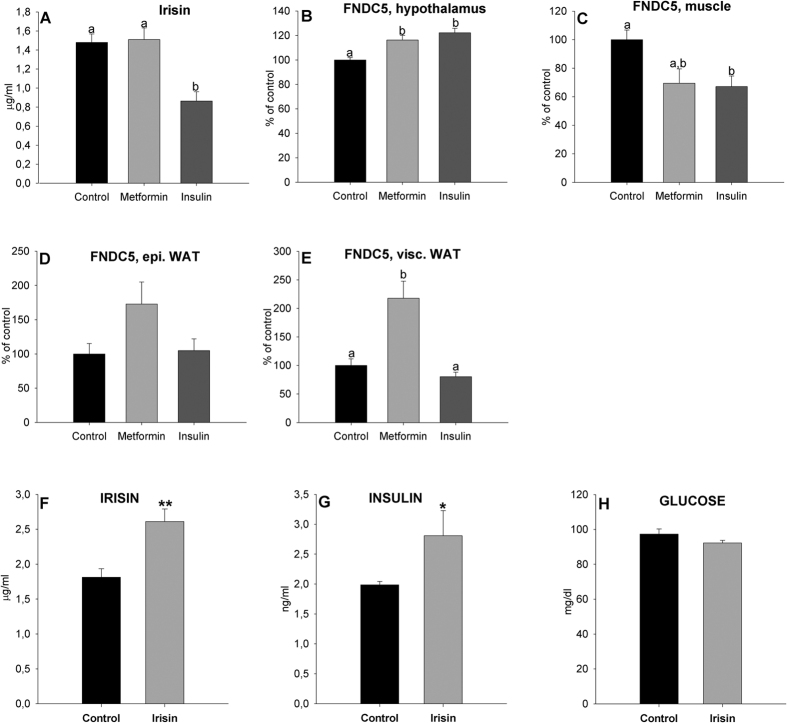
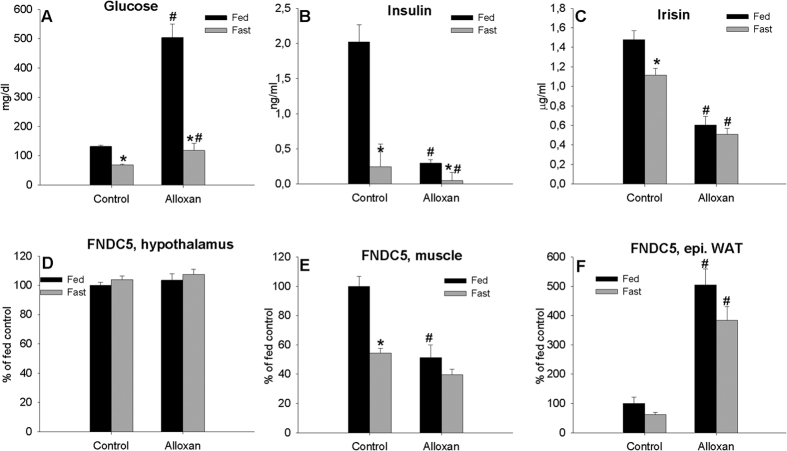
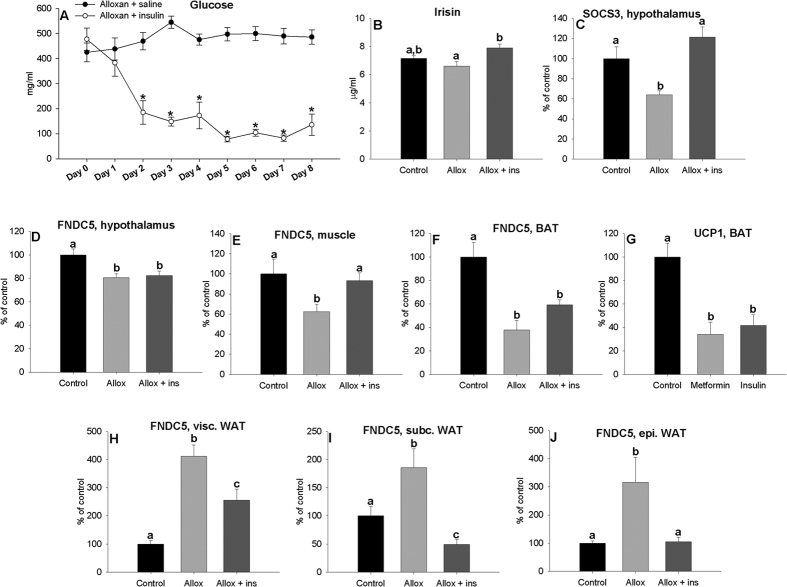
Irisin is processed from fibronectin type III domain-containing protein 5 (FNDC5). However, a controversy exists concerning irisin origin, regulation and function. To elucidate the relationship between serum irisin and FNDC5 mRNA expression levels, we evaluated plasma irisin levels and FNDC5 gene expression in the hypothalamus, gastrocnemius muscle and different depots of adipose tissue in models of altered metabolism. In normal rats, blood irisin levels diminished after 48-h fast and with leptin, insulin and alloxan treatments, and serum irisin concentrations increased in diabetic rats after insulin treatment and acute treatments of irisin increased blood insulin levels. No changes were observed during long-term experiments with different diets. We suggested that levels of circulating irisin are the result of the sum of the irisin produced by different depots of adipose tissue and skeletal muscle. This study shows for the first time that there are differences in FNDC5 expression depending on white adipose tissue depots. Moreover, a considerable decrease in visceral and epididymal adipose tissue depots correlated with increased FNDC5 mRNA expression levels, probably in an attempt to compensate the decrease that occurs in their mass. Hypothalamic FNDC5 expression did not change for any of the tested diets but increased with leptin, insulin and metformin treatments suggesting that the regulation of central and peripheral FNDC5/irisin expression and functions are different.


Figures

Figure 1
Figure 1. Expression profile of the FNDC5 gene in different tissues in the adult rat.
A panel of tissues from adult male and female (ovary and placenta) rats was screened for expression of FNDC5 mRNAs, using real-time RT-PCR.
Figure 2
Figure 2
Effect of the HFD and CR for three months on plasma irisin (A) levels, FNDC5 expression levels in the hypothalamus (B), muscle (C), BAT (D) and visceral (F), subcutaneous (G) and epididymal (H) white adipose tissue of adult male rats and UCP1 expression levels in BAT (E). Values are expressed in μg/ml for circulating irisin and arbitrary units for FNDC5 and UCP1 gene expression, as the mean ± SEM, where ND = 100%. Different letters above the bars indicate statistical differences (One-way ANOVA with post hoc Tukey’s test, a value of P < 0.05 was considered statistically significant). CR: caloric restriction (n = 10), ND: normal diet (n = 10) and HFD: high fat diet (n = 10). The animals were reared on these diets for three months after weaning.
Figure 3
Figure 3
Effect of 48 h of fasting on plasma irisin (A) levels, FNDC5 expression levels in the hypothalamus (B), muscle (C), BAT (D) and visceral (F), subcutaneous (G) and epididymal (H) white adipose tissue and UCP1 expression levels in BAT (E) of adult male rats. Values are expressed in μg/ml for circulating irisin and arbitrary units for FNDC5 and UCP1 gene expression, as the mean ± SEM, where fed = 100%. N = 6. Different symbols above the bars indicate statistical differences (t-test, a value of P < 0.05 was considered statistically significant). *P < 005 vs. fed.
Figure 4
Figure 4
Effect of 2-day IP leptin treatment in fed animals on plasma irisin (A) levels, SOCS3 gene expression (B), FNDC5 expression levels in the hypothalamus (C), muscle (D), BAT (E) and visceral (G), subcutaneous (H) and epididymal (I) white adipose tissue of adult male rats and UCP1 expression levels in BAT (F). Values are expressed in μg/ml for circulating irisin and arbitrary units for FNDC5 and SOCS3 gene expression, as the mean ± SEM, where control = 100%. n = 6–7. *, ***P < 0.05 and 0.01 respectively vs. control (rats injected with saline) (t-test).
Figure 5
Figure 5
Effect of 2-day IP leptin treatment in fed and fasted animals on plasma irisin levels (A), SOCS3 gene expression (B) and FNDC5 expression levels in the hypothalamus (C), muscle (D), and epididymal (E) white adipose tissue of adult male rats. Values are expressed in μg/ml for circulating irisin and arbitrary units for FNDC5 and SOCS3 gene expression, as the mean ± SEM, where fed animals treated with saline were the controls = 100%. n = 6–7. Different symbols above bars indicate statistical differences (Two-way ANOVA with post hoc Tukey’s test, a value of P < 0.05 was considered statistically significant). *P < 005 vs. fed; #P < 0.05 vs. saline.
Figure 6
Figure 6
Effect of a 14-day IP saline and insulin and subcutaneous metformin treatment on plasma irisin levels (A) and FNDC5 expression levels in the hypothalamus (B), muscle (C) and epididymal (D) and visceral (E) WAT of adult male rats and effect of 2-day IP irisin treatment in fed animals on plasma irisin (F), insulin (G) and glucose levels (H). Different letters above the bars indicate statistical differences (One-way ANOVA with post hoc Tukey’s test, a value of P < 0.05 was considered statistically significant). ***P < 0.05 and 0.01 respectively vs. control (rats injected with saline) (t-test). Values are expressed as the mean ± SEM where animals treated with saline. N = 6 (metformin treatment), 8 (saline and insulin treatments) and 7 (irisin treatment). Values are expressed in mg/dl for plasma glucose levels, ng/ml for plasma insulin levels and μg/ml for circulating irisin levels. Arbitrary units were used for FNDC5 gene expression where rats injected with saline = 100%.
Figure 7
Figure 7
Effect diabetes induced by a single injection of alloxan in fed and fasted (48 h) animals on plasma glucose (A) insulin (B) and irisin (C) levels and FNDC5 gene expression levels in the hypothalamus (D), muscle (E) and epididymal (F) WAT of adult male rats. *P < 0.05 vs. fed animals. #P < 0.05 vs. saline. (Two-way ANOVA with post hoc Tukey’s test, a value of P < 0.05 was considered statistically significant). Values are expressed in mg/dl for plasma glucose levels, ng/ml for plasma insulin levels and μg/ml for circulating irisin levels. Arbitrary units were used for FNDC5 gene expression, as the mean ± SEM, where rats fed and injected with saline = 100%. N = 8 (saline treatment) or 10 (alloxan treatment).
Figure 8
Figure 8
Effect of treatment of diabetic rats using 9.5 IU/day of NPH insulin for 8 days on plasma glucose levels (A) and effect after 8-day treatments of diabetics with insulin on plasma irisin (B) levels and SOCS3 (C), FNDC5 expression levels in the hypothalamus (D), and FNDC5 expression levels in muscle (E), BAT (F) and visceral (H), subcutaneous (I) and epididymal (J) white adipose tissue of adult male rats and UCP1 expression levels in BAT (G). *P < 0.05 vs. diabetics rats injected with saline. Different letters above the bars indicate statistical differences (One-way ANOVA with post hoc Tukey’s test, a value of P < 0.05 was considered statistically significant). Values are expressed in mg/dl for plasma glucose levels and μg/ml for circulating irisin levels. Arbitrary units were used for FNDC5 and SOCS3 gene expression, as the mean ± SEM, where normal rats injected with saline = 100%. N = 8.

Similar articles

Cited by

References

    1. Organization W. H. Diabetes fact sheet no. 312. Available at http://wwwwhoint/mediacentre/factsheets/fs312/en/indexhtml (2011).
    1. Travers M. E. & McCarthy M. I. Type 2 diabetes and obesity: genomics and the clinic. Hum Genet 130, 41–58 (2011). - PubMed
    1. McCarthy M. I. Genomics, type 2 diabetes, and obesity. N Engl J Med 363, 2339–2350 (2010). - PubMed
    1. Williams L. M. Hypothalamic dysfunction in obesity. Proc Nutr Soc 71, 521–533 (2012). - PubMed
    1. Cai D. Neuroinflammation and neurodegeneration in overnutrition-induced diseases. Trends Endocrinol Metab 24, 40–47 (2013). - PMC - PubMed

Publication types

MeSH terms