

Transitions from mono- to co- to tri-culture uniquely affect gene expression in breast cancer, stromal, and immune compartments
- PMID: 27432323
- PMCID: PMC5076020
- DOI: 10.1007/s10544-016-0083-x
Transitions from mono- to co- to tri-culture uniquely affect gene expression in breast cancer, stromal, and immune compartments
Abstract
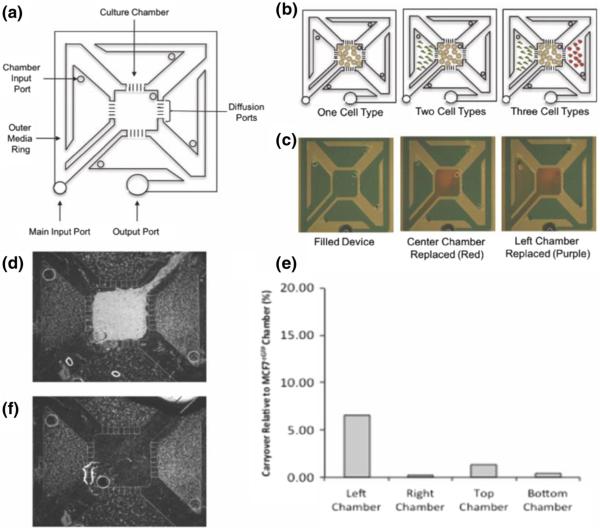
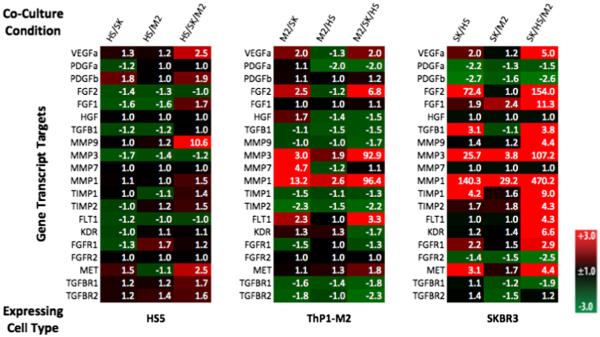
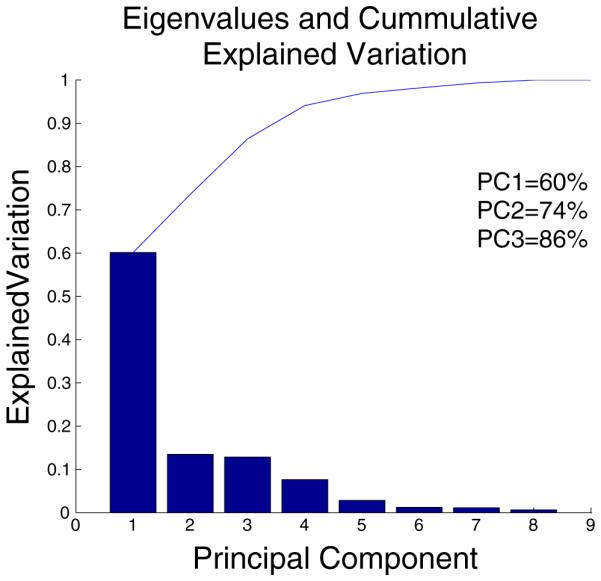
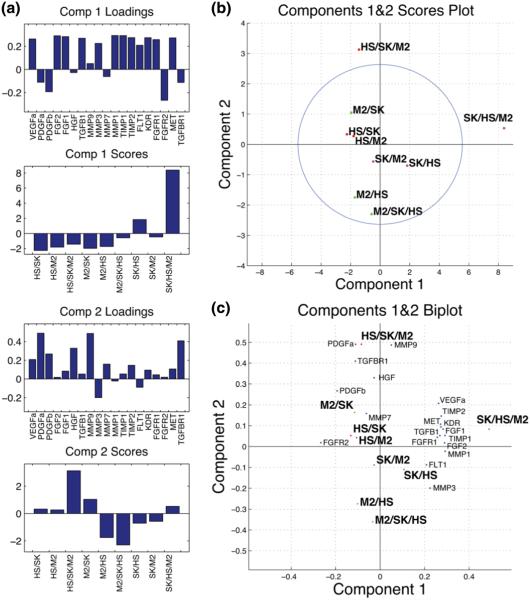
Heterotypic interactions in cancer microenvironments play important roles in disease initiation, progression, and spread. Co-culture is the predominant approach used in dissecting paracrine interactions between tumor and stromal cells, but functional results from simple co-cultures frequently fail to correlate to in vivo conditions. Though complex heterotypic in vitro models have improved functional relevance, there is little systematic knowledge of how multi-culture parameters influence this recapitulation. We therefore have employed a more iterative approach to investigate the influence of increasing model complexity; increased heterotypic complexity specifically. Here we describe how the compartmentalized and microscale elements of our multi-culture device allowed us to obtain gene expression data from one cell type at a time in a heterotypic culture where cells communicated through paracrine interactions. With our device we generated a large dataset comprised of cell type specific gene-expression patterns for cultures of increasing complexity (three cell types in mono-, co-, or tri-culture) not readily accessible in other systems. Principal component analysis indicated that gene expression was changed in co-culture but was often more strongly altered in tri-culture as compared to mono-culture. Our analysis revealed that cell type identity and the complexity around it (mono-, co-, or tri-culture) influence gene regulation. We also observed evidence of complementary regulation between cell types in the same heterotypic culture. Here we demonstrate the utility of our platform in providing insight into how tumor and stromal cells respond to microenvironments of varying complexities highlighting the expanding importance of heterotypic cultures that go beyond conventional co-culture.
Keywords: Compartmentalization; Heterotypic interactions; Microfluidic; Multi-culture; Principal component analysis.
Figures
Similar articles
-
Single cell dual adherent-suspension co-culture micro-environment for studying tumor-stromal interactions with functionally selected cancer stem-like cells.Lab Chip. 2016 Aug 7;16(15):2935-45. doi: 10.1039/c6lc00062b. Epub 2016 Jul 6. Lab Chip. 2016. PMID: 27381658 Free PMC article.
-
Progress towards understanding heterotypic interactions in multi-culture models of breast cancer.Integr Biol (Camb). 2016 Jun 13;8(6):684-92. doi: 10.1039/c6ib00001k. Epub 2016 Apr 21. Integr Biol (Camb). 2016. PMID: 27097801 Free PMC article. Review.
-
Effect of homotypic and heterotypic interaction in 3D on the E-selectin mediated adhesive properties of breast cancer cell lines.Biomaterials. 2012 Dec;33(35):9037-48. doi: 10.1016/j.biomaterials.2012.08.052. Epub 2012 Sep 17. Biomaterials. 2012. PMID: 22992472 Free PMC article.
-
Fabrication Method of a High-Density Co-Culture Tumor-Stroma Platform to Study Cancer Progression.Methods Mol Biol. 2021;2258:241-255. doi: 10.1007/978-1-0716-1174-6_16. Methods Mol Biol. 2021. PMID: 33340365
-
Gene expression analysis of in vitro cocultures to study interactions between breast epithelium and stroma.J Biomed Biotechnol. 2011;2011:520987. doi: 10.1155/2011/520987. Epub 2011 Dec 13. J Biomed Biotechnol. 2011. PMID: 22203785 Free PMC article. Review.
Cited by
-
Integrated cancer tissue engineering models for precision medicine.PLoS One. 2019 May 10;14(5):e0216564. doi: 10.1371/journal.pone.0216564. eCollection 2019. PLoS One. 2019. PMID: 31075118 Free PMC article. Review.
-
Breast tumor-on-chip models: From disease modeling to personalized drug screening.J Control Release. 2021 Mar 10;331:103-120. doi: 10.1016/j.jconrel.2020.12.057. Epub 2021 Jan 6. J Control Release. 2021. PMID: 33417986 Free PMC article. Review.
-
Organs-on-chips: into the next decade.Nat Rev Drug Discov. 2021 May;20(5):345-361. doi: 10.1038/s41573-020-0079-3. Epub 2020 Sep 10. Nat Rev Drug Discov. 2021. PMID: 32913334 Review.
-
The Tumor-on-Chip: Recent Advances in the Development of Microfluidic Systems to Recapitulate the Physiology of Solid Tumors.Materials (Basel). 2019 Sep 11;12(18):2945. doi: 10.3390/ma12182945. Materials (Basel). 2019. PMID: 31514390 Free PMC article. Review.
-
A microfluidic mammary gland coculture model using parallel 3D lumens for studying epithelial-endothelial migration in breast cancer.Biomicrofluidics. 2019 Dec 5;13(6):064122. doi: 10.1063/1.5123912. eCollection 2019 Nov. Biomicrofluidics. 2019. PMID: 31832120 Free PMC article.
References
-
- Abdi H, Williams LJ. Principal component analysis. Wiley Interdisciplinary Reviews: Computational Statistics. 2010;2(4):433–459.
-
- Bachelder RE, et al. Vascular endothelial growth factor is an autocrine survival factor for neuropilin-expressing breast carcinoma cells. Cancer Res. 2001;61(15):5736–5740. - PubMed
-
- Balkwill FR, Hagemann T. The tumor microenvironment at a glance. J. Cell Sci. 2012;125(23):5591–5596. - PubMed
Publication types
MeSH terms
Grants and funding
LinkOut - more resources
Full Text Sources
Other Literature Sources
Medical
