

Celecoxib Alters the Intestinal Microbiota and Metabolome in Association with Reducing Polyp Burden
- PMID: 27432344
- PMCID: PMC5010963
- DOI: 10.1158/1940-6207.CAPR-16-0095
Celecoxib Alters the Intestinal Microbiota and Metabolome in Association with Reducing Polyp Burden
Abstract
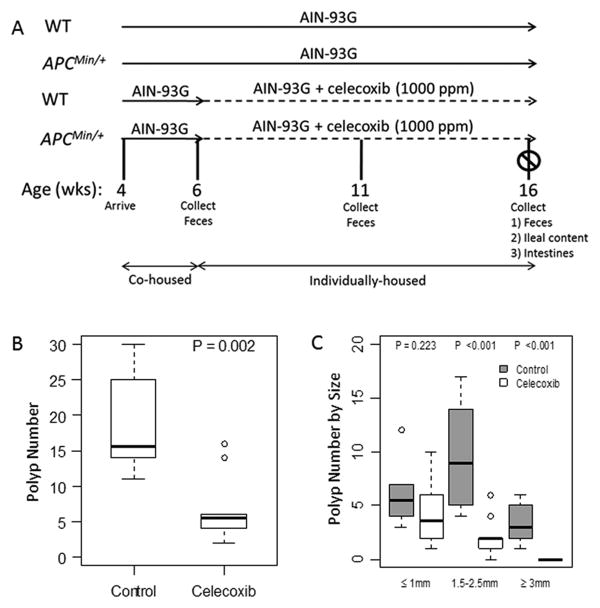
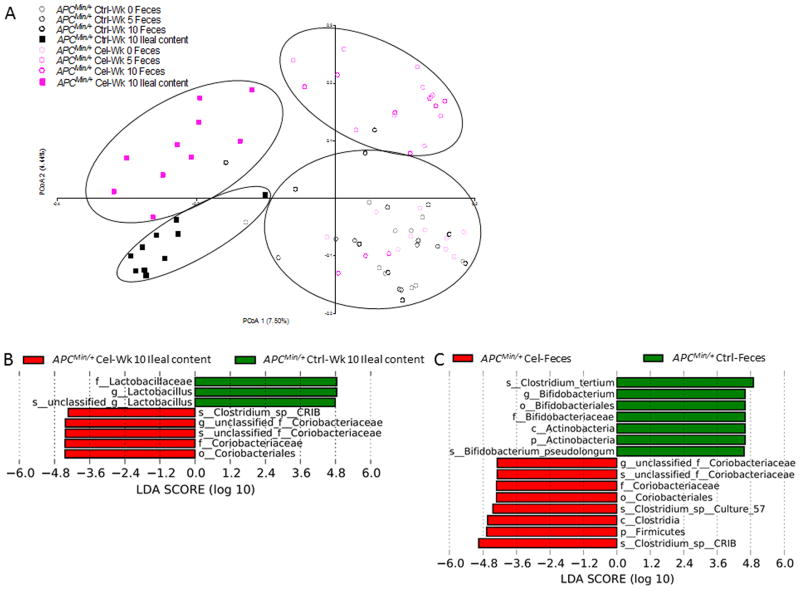
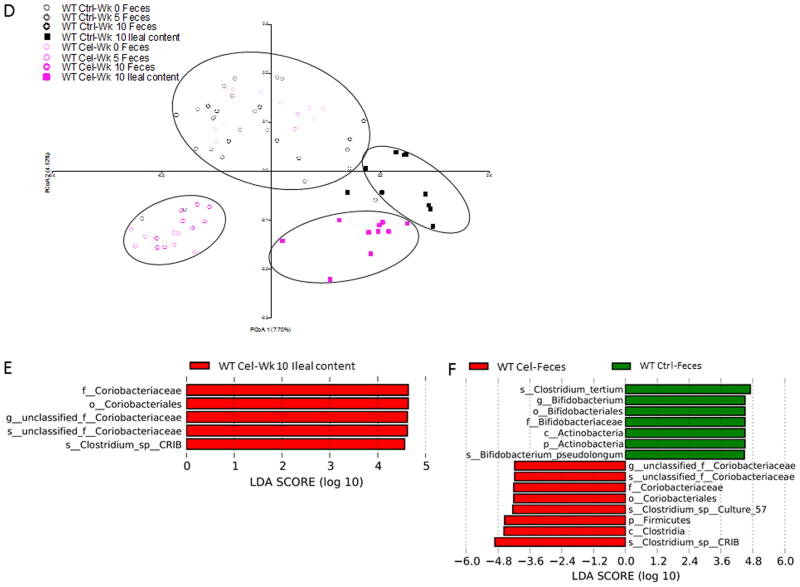
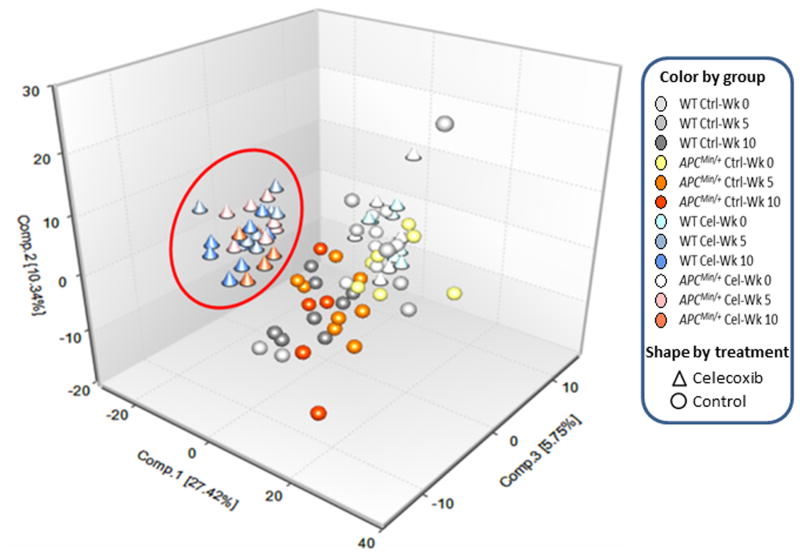
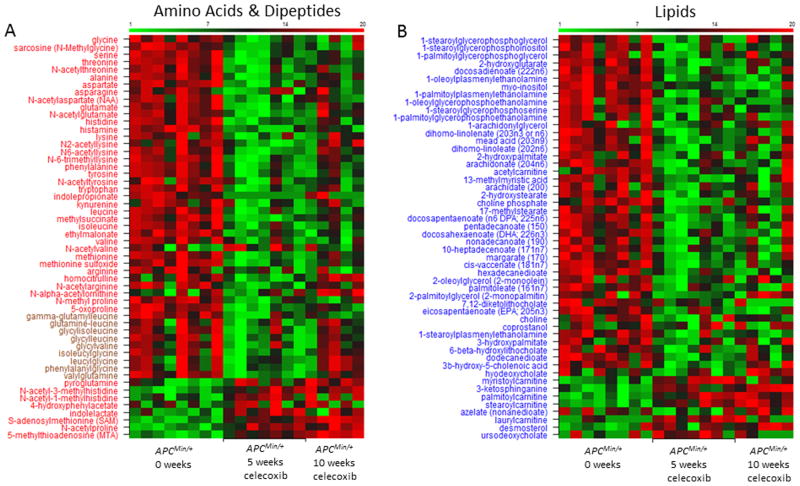
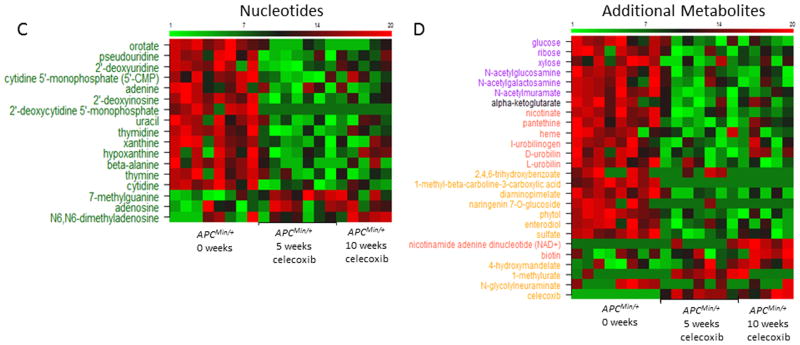
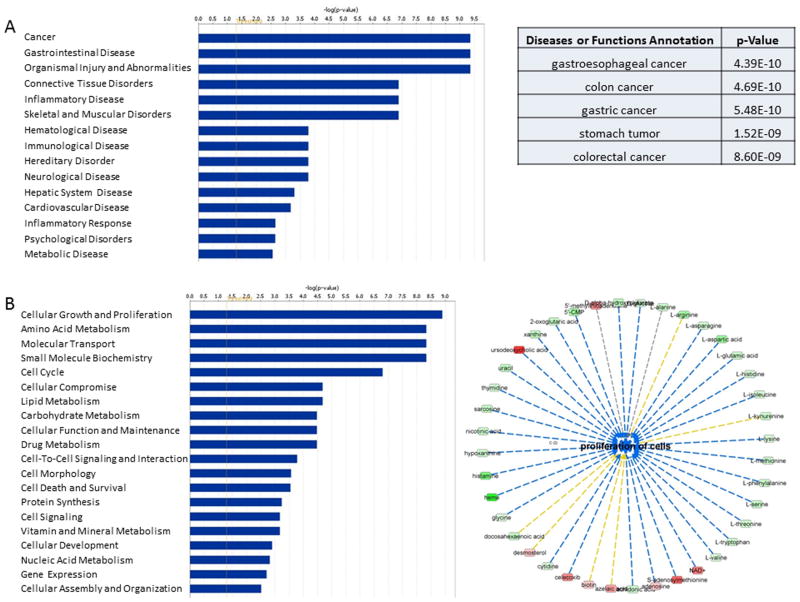
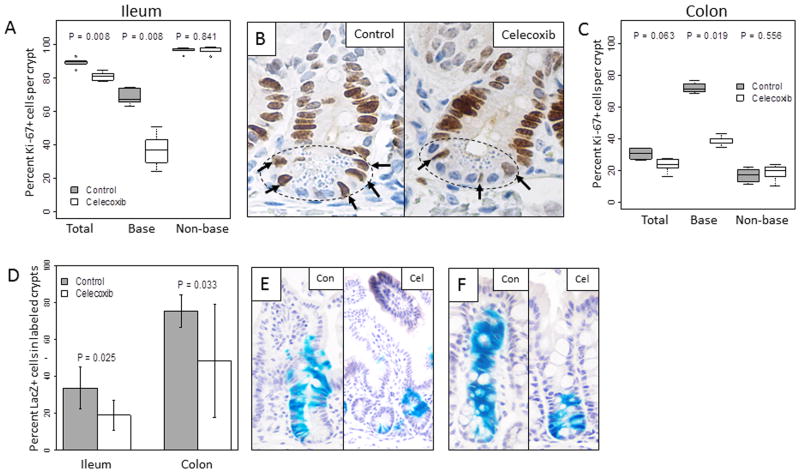
Treatment with celecoxib, a selective COX-2 inhibitor, reduces formation of premalignant adenomatous polyps in the gastrointestinal tracts of humans and mice. In addition to its chemopreventive activity, celecoxib can exhibit antimicrobial activity. Differing bacterial profiles have been found in feces from colon cancer patients compared with those of normal subjects. Moreover, preclinical studies suggest that bacteria can modulate intestinal tumorigenesis by secreting specific metabolites. In the current study, we determined whether celecoxib treatment altered the luminal microbiota and metabolome in association with reducing intestinal polyp burden in mice. Administration of celecoxib for 10 weeks markedly reduced intestinal polyp burden in APC(Min/+) mice. Treatment with celecoxib also altered select luminal bacterial populations in both APC(Min/+) and wild-type mice, including decreased Lactobacillaceae and Bifidobacteriaceae as well as increased Coriobacteriaceae Metabolomic analysis demonstrated that celecoxib caused a strong reduction in many fecal metabolites linked to carcinogenesis, including glucose, amino acids, nucleotides, and lipids. Ingenuity Pathway Analysis suggested that these changes in metabolites may contribute to reduced cell proliferation. To this end, we showed that celecoxib reduced cell proliferation in the base of normal appearing ileal and colonic crypts of APC(Min/+) mice. Consistent with this finding, lineage tracing indicated that celecoxib treatment reduced the rate at which Lgr5-positive stem cells gave rise to differentiated cell types in the crypts. Taken together, these results demonstrate that celecoxib alters the luminal microbiota and metabolome along with reducing epithelial cell proliferation in mice. We hypothesize that these actions contribute to its chemopreventive activity. Cancer Prev Res; 9(9); 721-31. ©2016 AACR.
©2016 American Association for Cancer Research.
Conflict of interest statement
Edward D. Karoly is an employee of Metabolon, Inc. The other authors disclosed no potential conflicts of interest.
Figures
Similar articles
-
Microbes Contribute to Chemopreventive Efficacy, Intestinal Tumorigenesis, and the Metabolome.Cancer Prev Res (Phila). 2022 Dec 1;15(12):803-814. doi: 10.1158/1940-6207.CAPR-22-0244. Cancer Prev Res (Phila). 2022. PMID: 36049217
-
Chemoprevention of familial adenomatous polyposis by low doses of atorvastatin and celecoxib given individually and in combination to APCMin mice.Cancer Res. 2006 Jul 15;66(14):7370-7. doi: 10.1158/0008-5472.CAN-05-4619. Cancer Res. 2006. PMID: 16849589
-
Acute changes in colonic PGE2 levels as a biomarker of efficacy after treatment of the Pirc (F344/NTac-Apc am1137) rat with celecoxib.Inflamm Res. 2020 Jan;69(1):131-137. doi: 10.1007/s00011-019-01300-5. Epub 2019 Dec 3. Inflamm Res. 2020. PMID: 31797003
-
Chemoprevention of intestinal polyposis in the Apcdelta716 mouse by rofecoxib, a specific cyclooxygenase-2 inhibitor.Cancer Res. 2001 Feb 15;61(4):1733-40. Cancer Res. 2001. PMID: 11245490
-
Chemoprevention of colon cancer by Korean food plant components.Mutat Res. 2003 Feb-Mar;523-524:99-107. doi: 10.1016/s0027-5107(02)00325-1. Mutat Res. 2003. PMID: 12628507 Review.
Cited by
-
Drugging cancer metabolism: Expectations vs. reality.Int Rev Cell Mol Biol. 2019;347:1-26. doi: 10.1016/bs.ircmb.2019.07.007. Epub 2019 Jul 29. Int Rev Cell Mol Biol. 2019. PMID: 31451211 Free PMC article. Review.
-
Serine Supports Epithelial and Immune Cell Function in Colitis.Am J Pathol. 2024 Jun;194(6):927-940. doi: 10.1016/j.ajpath.2024.01.021. Epub 2024 Feb 28. Am J Pathol. 2024. PMID: 38417696 Free PMC article.
-
Randomised clinical study: oral aspirin 325 mg daily vs placebo alters gut microbial composition and bacterial taxa associated with colorectal cancer risk.Aliment Pharmacol Ther. 2020 Sep;52(6):976-987. doi: 10.1111/apt.16013. Epub 2020 Aug 8. Aliment Pharmacol Ther. 2020. PMID: 32770859 Free PMC article. Clinical Trial.
-
NSAID-Gut Microbiota Interactions.Front Pharmacol. 2020 Aug 7;11:1153. doi: 10.3389/fphar.2020.01153. eCollection 2020. Front Pharmacol. 2020. PMID: 32848762 Free PMC article. Review.
-
Characteristics of the intestinal microbiome in ankylosing spondylitis.Exp Ther Med. 2021 Jul;22(1):676. doi: 10.3892/etm.2021.10108. Epub 2021 Apr 24. Exp Ther Med. 2021. PMID: 33986841 Free PMC article.
References
MeSH terms
Substances
Grants and funding
LinkOut - more resources
Full Text Sources
Other Literature Sources
Research Materials
