

Quantitative mass spectrometry-based multiplexing compares the abundance of 5000 S. cerevisiae proteins across 10 carbon sources
- PMID: 27432472
- PMCID: PMC5035620
- DOI: 10.1016/j.jprot.2016.07.005
Quantitative mass spectrometry-based multiplexing compares the abundance of 5000 S. cerevisiae proteins across 10 carbon sources
Abstract
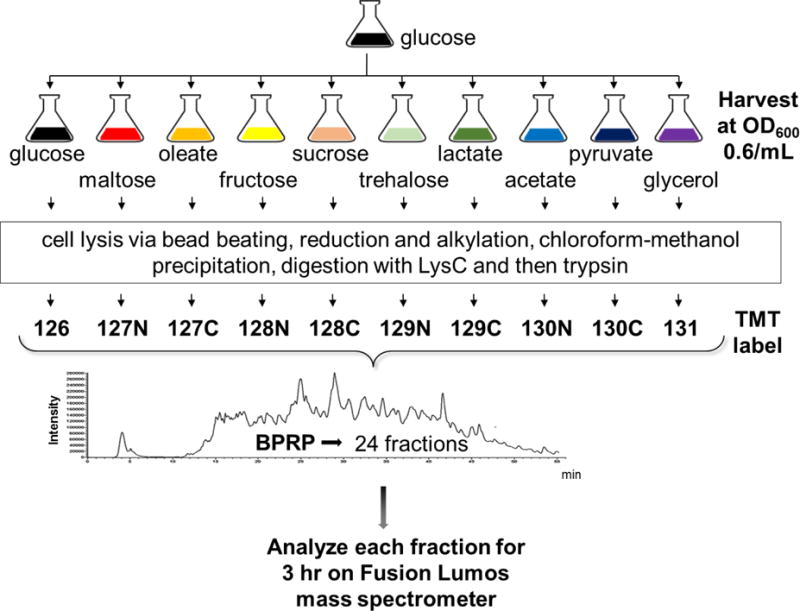
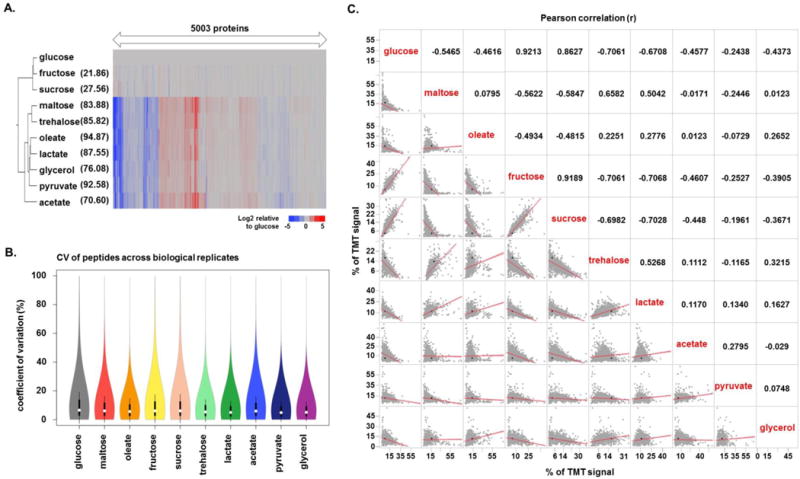
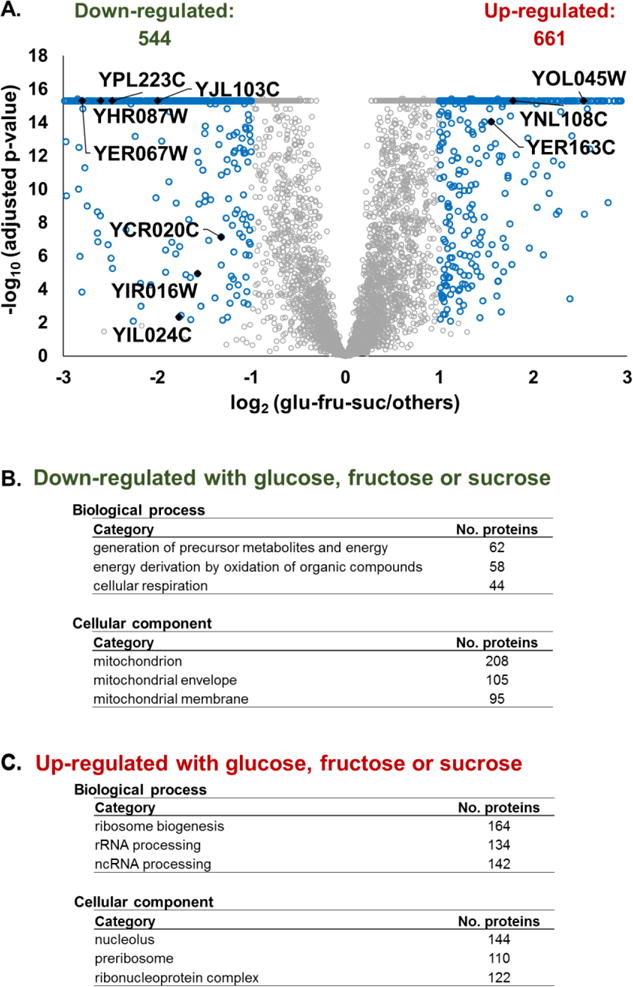
The budding yeast Saccharomyces cerevisiae is a model system for investigating biological processes. Cellular events are known to be dysregulated due to shifts in carbon sources. However, the comprehensive proteomic alterations thereof have not been fully investigated. Here we examined proteomic alterations in S. cerevisiae due to the adaptation of yeast from glucose to nine different carbon sources - maltose, trehalose, fructose, sucrose, glycerol, acetate, pyruvate, lactic acid, and oleate. Isobaric tag-based mass spectrometry techniques are at the forefront of global proteomic investigations. As such, we used a TMT10-plex strategy to study multiple growth conditions in a single experiment. The SPS-MS3 method on an Orbitrap Fusion Lumos mass spectrometer enabled the quantification of over 5000 yeast proteins across ten carbon sources at a 1% protein-level FDR. On average, the proteomes of yeast cultured in fructose and sucrose deviated the least from those cultured in glucose. As expected, gene ontology classification revealed the major alteration in protein abundances occurred in metabolic pathways and mitochondrial proteins. Our protocol lays the groundwork for further investigation of carbon source-induced protein alterations. Additionally, these data offer a hypothesis-generating resource for future studies aiming to investigate both characterized and uncharacterized genes.
Biological significance: We investigate the proteomic alterations in S. cerevisiae resulting from adaptation of yeast from glucose to nine different carbon sources - maltose, trehalose, fructose, sucrose, glycerol, acetate, pyruvate, lactic acid, and oleate. SPS-MS3 TMT10plex analysis is used for quantitative proteomic analysis. We showcase a technique that allows the quantification of over 5000 yeast proteins, the highest number to date in S. cerevisiae, across 10 growth conditions in a single experiment. As expected, gene ontology classification of proteins with the major alterations in abundances occurred in metabolic pathways and mitochondrial proteins, reflecting the degree of metabolic stress when cellular machinery shifts from growth on glucose to an alternative carbon source. Our protocol lays the groundwork for further investigation of carbon source-induced protein alterations. Improving depth of coverage - measuring abundance changes of over 5000 proteins - increases our understanding of difficult-to-study genes in the model system S. cerevisiae and by homology human cell biology. We submit this highly comprehensive dataset as a hypothesis generating resource for targeted studies on uncharacterized genes.
Keywords: Carbon sources; Metabolism; Orbitrap Fusion Lumos; SPS-MS3; TMT; Yeast.
Copyright © 2016 Elsevier B.V. All rights reserved.
Conflict of interest statement
The authors acknowledge no conflict of interest.
Figures

References
-
- Raghavulu SV, Goud RK, Sarma PN, Mohan SV. Saccharomyces cerevisiae as anodic biocatalyst for power generation in biofuel cell: influence of redox condition and substrate load. Bioresour Technol. 2011;102:2751–7. - PubMed
-
- Granot D, Snyder M. Carbon source induces growth of stationary phase yeast cells, independent of carbon source metabolism. Yeast. 1993;9:465–79. - PubMed
MeSH terms
Substances
Grants and funding
LinkOut - more resources
Full Text Sources
Other Literature Sources
Molecular Biology Databases
Research Materials
