. 2016 Aug 15;5(8):1061-71.
doi: 10.1242/bio.017640.

Two types of dominant male cichlid fish: behavioral and hormonal characteristics

Affiliations

Two types of dominant male cichlid fish: behavioral and hormonal characteristics

Rosa M Alcazar et al. Biol Open. .

Abstract

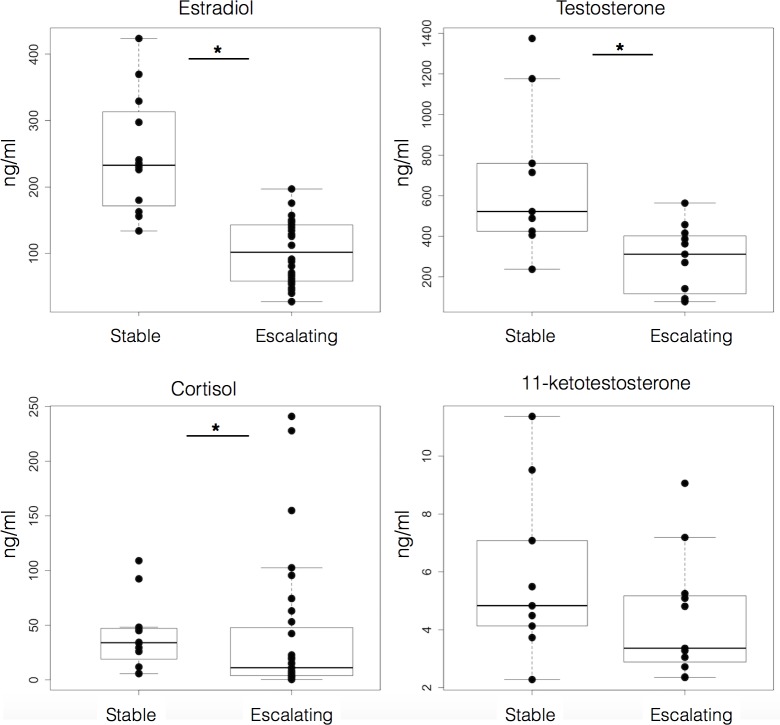
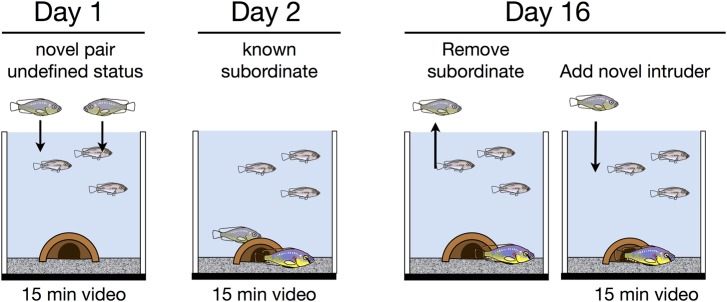
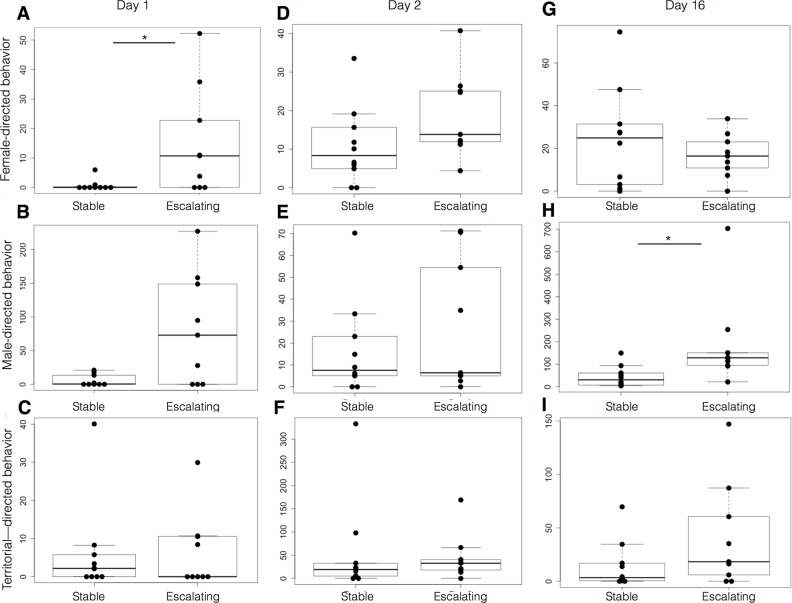
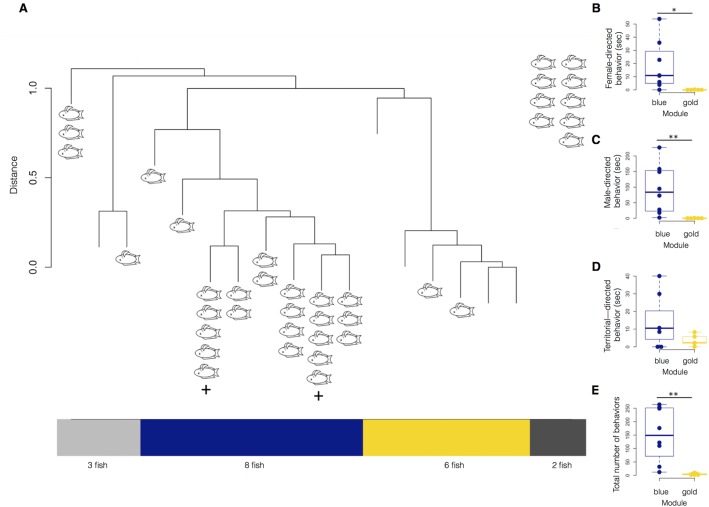
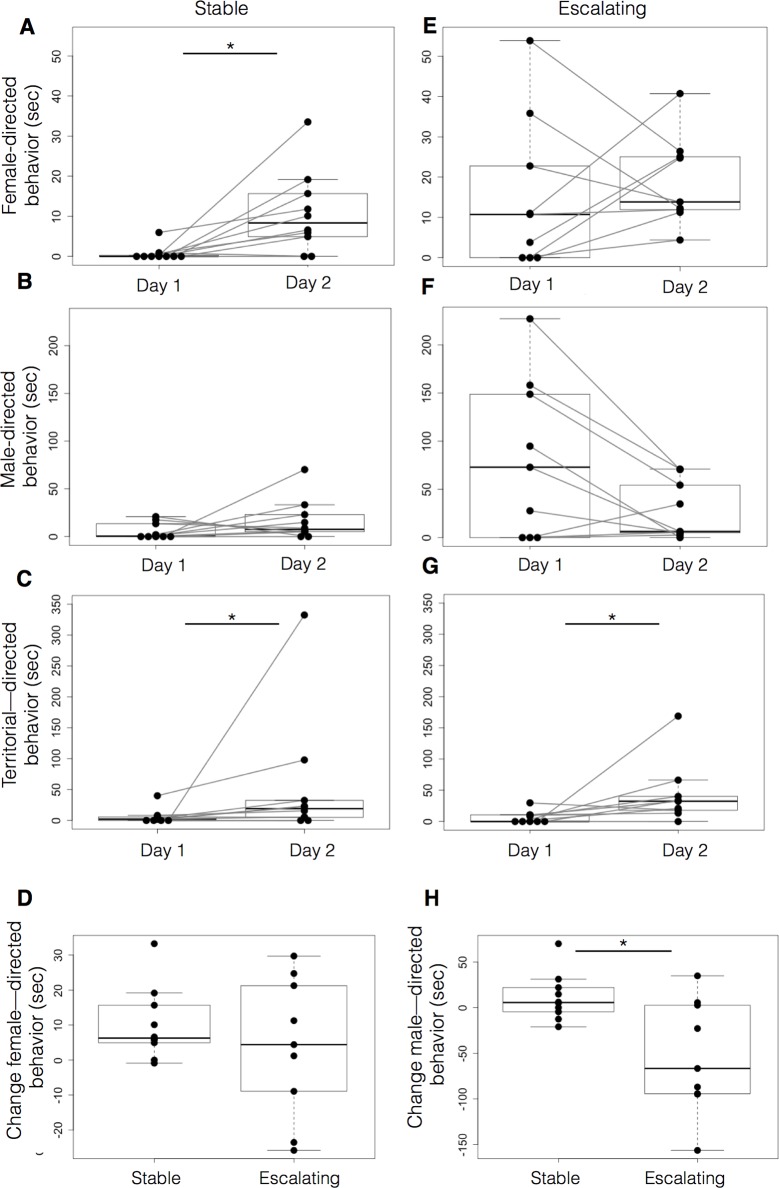
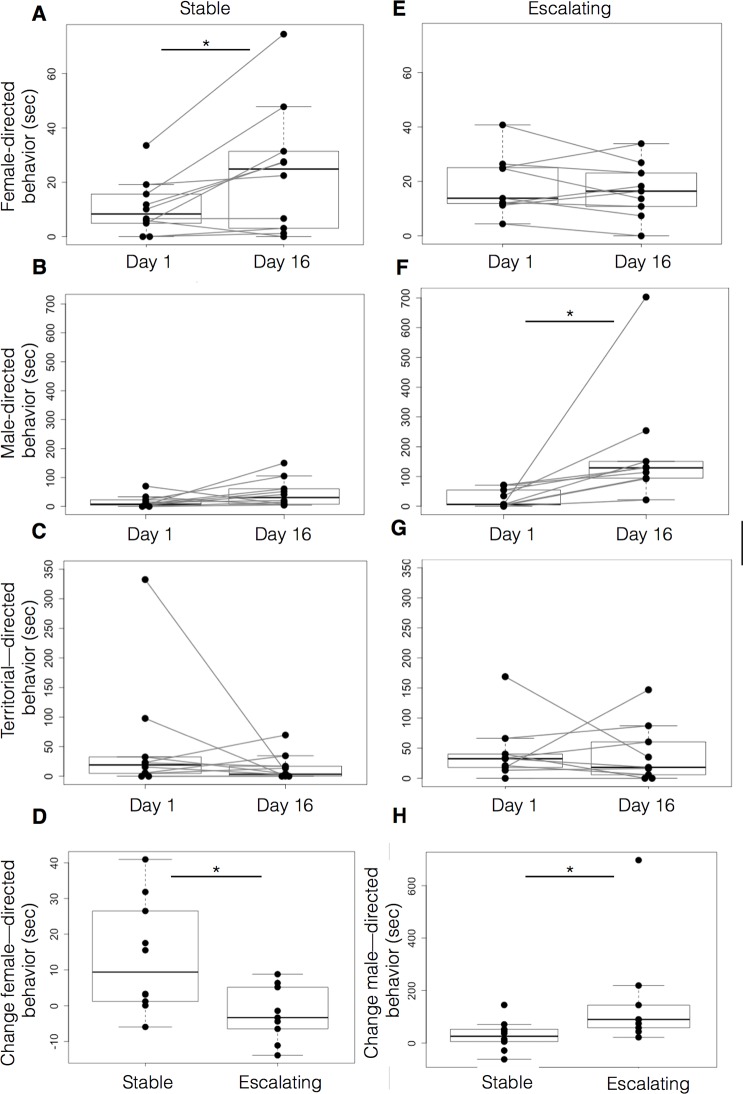
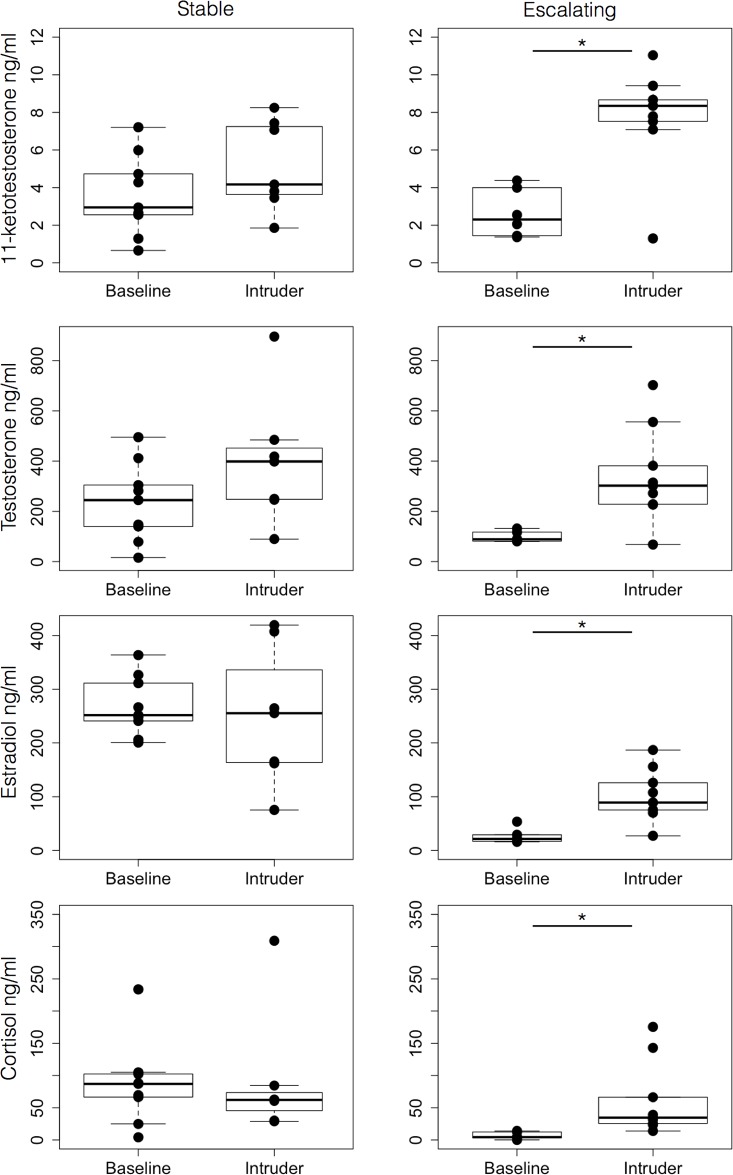
Male African cichlid fish, Astatotilapia burtoni, have been classified as dominant or subordinate, each with unique behavioral and endocrine profiles. Here we characterize two distinct subclasses of dominant males based on types of aggressive behavior: (1) males that display escalating levels of aggression and court females while they establish a territory, and (2) males that display a stable level of aggression and delay courting females until they have established a territory. To profile differences in their approach to a challenge, we used an intruder assay. In every case, there was a male-male confrontation between the resident dominant male and the intruder, with the intruder quickly taking a subordinate role. However, we found that dominant males with escalating aggression spent measurably more time attacking subordinates than did dominant males with stable aggression that instead increased their attention toward the females in their tank. There was no difference in the behavior of intruders exposed to either type of dominant male, suggesting that escalating aggression is an intrinsic characteristic of some dominant males and is not elicited by the behavior of their challengers. Male behavior during the first 15 min of establishing a territory predicts their aggressive class. These two types of dominant males also showed distinctive physiological characteristics. After the intruder assay, males with escalating aggression had elevated levels of 11-ketotestosterone (11-KT), testosterone, estradiol, and cortisol, while those with stable aggression did not. These observations show that the same stimulus can elicit different behavioral and endocrine responses among A. burtoni dominant males that characterize them as either escalating or stable aggressive types. Our ability to identify which individuals within a population have escalating levels of aggressive responses versus those which have stable levels of aggressive responses when exposed to the same stimulus, offers a potentially powerful model for investigating the underlying molecular mechanisms that modulate aggressive behavior.

Keywords: Aggression; Behavior; Cichlids; Endocrine responses; HPI/A axis; Stress.


Conflict of interest statement

The authors declare no competing or financial interests.

Figures

Fig. 1.
Fig. 1.
Males classified as escalating aggressive had lower levels of circulating steroids than stable aggressive types. Circulating steroid hormones titers after the dyad show males in the escalating aggression category had lower levels of estradiol, cortisol, testosterone but not 11-ketotestosterone. Data are plotted as concentration (ng/ml). Top and bottom of boxes represent the first and third quartiles, respectively; whiskers extend to the most extreme data points no more than 1.5 times the interquartile range from the box; and horizontal lines within the boxes represent group medians. Asterisks indicate a statistically significant difference (*P<0.05, Mann–Whitney).
Fig. 2.
Fig. 2.
Social manipulations used to characterize differences in behavior and physiology as a function of aggression. Animals were moved to test tanks where we recorded the first 15-min of behavior at three time-points (Day 1, Day 2, Day 16). In the first observation period (Day 1) two males were moved to a test tank containing three females. We were agnostic as to which male would become dominant and scored behavior of both males. Twenty-four hours later (Day 2), we scored the behavior of the dominant and subordinate male in each tank. On Day 16 we introduced a novel intruder. To classify dominant males as stable or escalating aggressive, we counted the number of fish damaged in the interval between Day 2 and Day 16.
Fig. 3.
Fig. 3.
Males that ultimately display escalating aggression behave differently when placed in different social contexts. The behavior quantified for 15 min of observation in Days 1, 2 and 16 shows differences between males that were later classified as escalating versus stable aggressive. On Day 1, when males are in a novel territory facing a novel opponent, escalating aggressive males are significantly more proactive: showing more female-directed behaviors prior to establishing a territory (A), a trend in more male-directed behavior (B), and no difference in non-social territorial behaviors (C). On Day 2 the dominant male was familiar with his territory and his opponent. We saw no significant differences in behaviors on this day (D-F). On Day 16, when we introduced a novel intruder, the escalating aggressive type performed more aggressive male-directed behavior toward the challenger (H) but showed no change in female (G) or non-social territorial behavior (I). Behaviors are expressed as time spent (s) engaged in male-directed, female-directed or non-social territorial behaviors. Data are plotted as mean time spent (s). Top and bottom of boxes represent the first and third quartiles, respectively; whiskers extend to the most extreme data points no more than 1.5 times the interquartile range from the box; and horizontal lines within the boxes represent group medians. Asterisks indicate a statistically significant difference (*P<0.05, Mann–Whitney).
Fig. 4.
Fig. 4.
Results of unsupervised clustering of the fish by the number of incidents of each behavior performed during the first 15 min of Day 1. (A) The fish cluster into two proper modules, ‘dark blue’ (n=8, six escalating aggressive, two stable aggressive) and ‘gold’ (n=6, all stable aggressive). Each branch represents one fish (n=19). Distance between any two animals is defined as 1 minus the correlations between all their behaviors. Two fish performed 0 behaviors on Day 1, preventing correlations from being computed (both escalating aggressive, shown in dark gray to right), while three fish were unassigned to a module (two stable, one escalating, shown in light gray). Module assignments were significantly similar to later stable/escalating aggressive classification (P=0.017, chi squared). (B-E) There are significant differences between the ‘dark blue’ and ‘gold’ module in time spent performing female-directed behaviors (P=0.0072, Mann–Whitney) and male-directed behaviors (P=0.0019), as well as in the total number of behaviors (P=0.0025). There was no significant difference in time spent performing neutral/territorial behaviors (P=0.19), although it is worth noting that fish in the ‘gold’ module tended to spend more time performing these behaviors than performing social behaviors.
Fig. 5.
Fig. 5.
Behavioral changes in stable and escalating aggressive males in a novel environment and one day later. The behavior quantified for 15 min of observation on Day 1 and Day 2 shows the behavior of dominant males changes between Day 1 and Day 2 of the assay. On Day 1, escalating aggressive males displayed more male- and female-directed behaviors compared to the stable group (A). On Day 2 the behavior of the dominant male, clearly identified in each dyad, does not differ between the groups. We compared the female- and male-directed behaviors of each dominant fish on Day 2. Behaviors are expressed as time spent (s) engaged in either male- or female-directed behaviors. Data are plotted as mean time spent (s). Top and bottom of boxes represent the first and third quartiles, respectively; whiskers extend to the most extreme data points no more than 1.5 times the interquartile range from the box; and horizontal lines within the boxes represent group medians. Asterisks indicate a statistically significant difference (*P<0.05, Mann–Whitney).
Fig. 6.
Fig. 6.
Behavioral differences across social contexts between stable and escalating dominant males. The behavior quantified for 15 min on Day 2 and Day 16 shows differences in behavior between dominant males. On Day 2 the dominant male, clearly identified in each dyad, directed its behavior towards females, opponent or territory. We compared the female- and male-directed behaviors of each dominant fish on Day 2 with the same behaviors on Day 16. When faced with an intruder, the stable subtype showed greater female-directed behaviors on Day 16 (C). In contrast, the escalating subtype performed more male-directed behaviors (E). We compared the relative magnitude of behavioral changes, expressed as the difference in seconds of total duration of behaviors, from Day 2 to Day 16 for the male types. There was no difference in non-social territorial behaviors. Differences in both female-directed behaviors of stable males, and male-directed in escalating males were significant (D,H). Behaviors are expressed as time spent (s) engaged in either male- or female-directed behaviors. Data are plotted as mean time spent (s). Top and bottom of boxes represent the first and third quartiles, respectively; whiskers extend to the most extreme data points no more than 1.5 times the interquartile range from the box; and horizontal lines within the boxes represent group medians. Asterisks indicate a statistically significant difference (*P<0.05, Mann–Whitney).
Fig. 7.
Fig. 7.
Effect of an intruder male on circulating hormone levels of resident dominant males. Circulating levels of 11-ketotestosterone, testosterone, estradiol and cortisol (rows) from a control group and a group exposed to an intruder challenge are shown for stable males (left column) and escalating males (right column). 11-ketotestosterone, testosterone, estradiol and cortisol levels increased significantly in escalating males when faced with an intruder, but no effect was observed in stable males. Data are plotted as concentration (ng/ml). Top and bottom of boxes represent the first and third quartiles, respectively; whiskers extend to the most extreme data points no more than 1.5 times the interquartile range from the box; and horizontal lines within the boxes represent group medians. Asterisks indicate a statistically significant difference (*P<0.05, Mann–Whitney).

References

    1. Alcazar R. M., Hilliard A. T., Becker L. Bernaba M. and Fernald R. D. (2014). Brains over brawn: experience overcomes a size disadvantage in fish social hierarchies. J. Exp. Biol. 217, 1462-1468. 10.1242/jeb.097527 - DOI - PMC - PubMed
    1. Bell A. M. (2007). Future directions in behavioural syndromes research. Proc. R. Soc. B Biol. Sci. 274, 755-761. 10.1098/rspb.2006.0199 - DOI - PMC - PubMed
    1. Brawand D., Wagner C. E., Li Y. I., Malinsky M., Keller I., Fan S., Simakov O., Ng A. Y., Lim Z. W., Bezault E. et al. (2014). The genomic substrate for adaptive radiation in African cichlid fish. Nature 513, 375-381. 10.1038/nature13726 - DOI - PMC - PubMed
    1. Cote J. and Clobert J. (2007). Social personalities influence natal dispersal in a lizard. Proc. R. Soc. B Biol. Sci. 274, 384-390. 10.1098/rspb.2006.3734 - DOI - PMC - PubMed
    1. Dall S. R. X., Houston A. I. and McNamara J. M. (2004). The behavioural ecology of personality: consistent individual differences from an adaptive perspective. Ecol. Lett. 7, 734-739. 10.1111/j.1461-0248.2004.00618.x - DOI

LinkOut - more resources