. 2016 Jul 19:6:29852.
doi: 10.1038/srep29852.

Thymocyte development in the absence of matrix metalloproteinase-9/gelatinase B

Affiliations

Thymocyte development in the absence of matrix metalloproteinase-9/gelatinase B

Natalia V Gounko et al. Sci Rep. .

Abstract

Matrix metalloproteinases (MMP) play critical roles in a variety of immune reactions by facilitating cell migration, and affect cell communication by processing both cytokines and cell surface receptors. Based on published data indicating that MMP-9 is upregulated upon T cell activation and also in the thymus upon the induction of negative selection, we investigated the contribution of MMP-9 into mouse T cell development and differentiation in the thymus. Our data suggest that MMP-9 deficiency does not result in major abnormalities in the development of any conventionally selected or agonist selected subsets and does not interfere with thymocyte apoptosis and clearance, and that MMP-9 expression is not induced in immature T cells at any stage of their thymic development.


Figures

Figure 1
Figure 1. Thymic morphology, cellularity and frequency of major cell subsets.
(a) Gross anatomy of thymi in wild-type (top) and MMP-9-deficient (bottom) mice. Photographic images show two 4-week old mice per genotype, dissected to expose the thymi. Representative of ten animals per genotype. (b) Thymus size and gross morphology in wild-type and MMP-9-deficient mice. Organs from three individual animals per genotype were extracted and photographed. Representative of ten animals per genotype. (c) Thymus weight in wild-type and MMP-9-deficient mice. Organs from ten individual animals per genotype were weighed immediately following extraction. p-value results from a two-tailed Mann-Whitney U-test. (d) Overall cellularity is slightly increased in MMP-9 deficient mice. Thymi were isolated and pressed through 70 um mesh into PBS. Cell counting was done in three replicates per thymus, and average counts plotted. Data indicative of twelve mice per genotype. p-value results from a two-tailed Mann-Whitney U-test. (e) Phenotype of early T cell precursors. Flow cytometry plots represent the distribution of double negative, lineage-negative (CD3, Ly-6G/Ly-6C, CD11b, CD45R, TER-119) thymocytes based on surface CD44 and CD25 staining. Data representative of eight mice per group in two independent experiments. (f) Major thymocyte subsets. Flow cytometry plots represent the distribution of all live, single thymocytes based on surface CD4 and CD8 staining. Data representative of twelve mice per group in three independent experiments.
Figure 2
Figure 2. Frequencies of agonist selected thymocytes.
(a) Thymic precursors of regulatory T cells. Flow cytometry plots represent the distribution of CD4 single-positive thymocytes based on surface CD25 and intracellular Foxp3 staining. Data representative of twelve mice per group in two independent experiments. (b) Thymic precursors of γδ T cells. Flow cytometry plots represent the distribution of double negative thymocytes based on surface γδTCR and TCRβ staining. Data representative of twelve mice per group in two independent experiments. (c) Thymic precursors of CD8αα intraepithelial lymphocytes. Flow cytometry plots represent the distribution of double-negative, NK1.1- and B220-negative thymocytes based on surface CD5 and TCRβ staining. Data representative of twelve mice per group in two independent experiments. (d) Statistical analysis of agonist selected T cell frequencies in the thymus. All significance labels and p-values are derived from two-tailed Mann-Whitney U-tests.
Figure 3
Figure 3. Analysis of negative selection.
(a) In vitro analysis of thymocyte apoptosis. Isolated thymocytes were incubated in vitro in complete RPMI in the absence or presence of CD3/CD28-coated magnetic beads, added at 1:1 ratio. Flow cytometry plots represent the distribution of all single thymocytes based on surface annexin V and intracellular active caspase 3 staining. Data representative of four technical replicates per group in four independent experiments (16 wells per group total). (b) In vivo analysis of thymocyte deletion. Mice were injected with PBS or CD3ε antibody as described in Materials and Methods. Thymi were excised 48 h post injection. Flow cytometry plots represent the distribution of all single thymocytes based on surface CD4 and CD8α staining. Data representative of 13–14 CD3ε-injected mice per group and four PBS injected mice per group in four independent experiments. (c) Statistical analysis of double positive thymocyte frequencies in the thymus. All significance labels and p-values are derived from pairwise, two-tailed Mann-Whitney U-tests. (d) Body weight loss after CD3ε antibody injection. Four mice per genotype were injected i.p. with CD3ε antibody, and their body weight was recorded over four days in 24-hour intervals. p-values are derived from grouped Kruskal–Wallis one-way analysis of variance between CD3ε-injected WT, MMP9 KO, and FasLpr MMP9 KO mice, at each time point. Gray symbols indicate PBS-injected mice (one per genotype, as in c). Representative of two independent experiments.
Figure 4
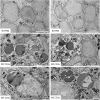
Figure 4. Morphological analysis of thymocyte apoptosis in situ.
Mice were injected i.p. with PBS (top panel) or CD3ε antibody (middle and bottom panels). Thymi were excised 48 h post injection and processed for electron microscopic analysis as described in Materials and Methods. Images representative of 40–50 individual microscopic images and two individual animals per condition. Bottom panels show engulfment of apoptotic thymocytes. Scale bars, as indicated.
Figure 5
Figure 5. Identification of MMP-9 producing cells in the thymus.
(a) Mice were injected i.p. with PBS or CD3ε antibody. Thymi were excised 20 h post injection and processed for zymography. Left, zymography data representative of two independent experiments with material from one mouse per condition in each experiment. Locations of MMP-9, MMP-2, and internal control (IC, see Materials and Methods) are indicated. A double arrowhead highlights the band shift characteristic of MMP-9 activation. Densitometry data reflecting band intensities of MMP-9 and MMP-2 relative to their internal controls were calculated using ImageJ (see Materials and Methods), and are indicated below. Right, changes of expression of MMP-9 and MMP-2 relative to wild-type PBS control, derived from densitometry analysis. (b) Isolated thymocytes were incubated in vitro in serum-free TexMACS medium in the absence or presence of CD3/CD28-coated magnetic beads, added at 1:1 ratio, for 4 h. Culture supernatants were processed for zymography. Data representative of four independent experiments with cells derived from one mouse per experiment. Labeling and densitometry as above. Right, changes of expression of MMP-9 and MMP-2 relative to untreated control sample, derived from densitometry analysis. (c) Mice were injected i.p. with PBS (left) or CD3ε antibody (right). Thymi were excised 48 h post injection, fixed in 4% paraformaldehyde, embedded in paraffin, sectioned, and processed for immunohistochemistry. (d) Specificity analysis of immunohistochemical staining. MMP-9 specificity control (left): CD3ε-injected sample from an MMP-9-deficient mouse shows non-specific staining of cells attached to the outside of the thymic capsule, and weak diffuse subcapsular staining, and no stained cells in the thymic tissue. Iba1 specificity control (right): PBS-injected sample stained using anti-rabbit secondary antibody without primary antibody shows negligible background staining. The highlighted area is duplicated in the inset after artificial enhancement of brightness and contrast to reveal biological structure.
Figure 6
Figure 6. Flow cytometry analysis of MMP-9 expressing populations.
(a) Specificity of intracellular MMP-9 staining. Plots represent the distribution of all single bone marrow-derived cells based on surface Gr.1 and intracellular MMP-9 staining. Cells were stained for Gr.1, fixed, permeabilized, and stained with MMP-9 antibody and then secondary antibody (top and bottom panels) or secondary antibody alone (middle panel). MMP-9 staining exceeding background level as defined by the signal in the knockout sample was exclusively present in Gr.1-high cells. Data representative of four mice per genotype in two independent experiments. (b) Expression of MMP-9 in the thymus. Plots represent the distribution of all single thymocytes based on surface CD4, CD8α, Gr.1, and F4/80 staining, and intracellular MMP-9 staining. Data representative of two mice per experiment and two independent experiments.
Figure 7
Figure 7. Morphological analysis of MMP-9 expression.
Thymi were excised and processed for immunoelectron microscopic analysis as described in Materials and Methods. Numbered areas of interest are enlarged in the higher magnification images on the right, and circles highlight the immunogold label. Images representative of 40–50 individual microscopic images and two individual animals. Scale bars, as indicated.

Similar articles

Cited by

References

    1. Vandooren J., Van den Steen P. E. & Opdenakker G. Biochemistry and molecular biology of gelatinase B or matrix metalloproteinase-9 (MMP-9): the next decade. Crit Rev Biochem Mol Biol 48, 222–272, 10.3109/10409238.2013.770819 (2013). - DOI - PubMed
    1. Opdenakker G., Van den Steen P. E. & Van Damme J. Gelatinase B: a tuner and amplifier of immune functions. Trends Immunol 22, 571–579 (2001). - PubMed
    1. Agrawal S. et al. Dystroglycan is selectively cleaved at the parenchymal basement membrane at sites of leukocyte extravasation in experimental autoimmune encephalomyelitis. J Exp Med 203, 1007–1019, 10.1084/jem.20051342 (2006). - DOI - PMC - PubMed
    1. Chou C. H. et al. MMP-9 from sublethally irradiated tumor promotes Lewis lung carcinoma cell invasiveness and pulmonary metastasis. Oncogene 31, 458–468, 10.1038/onc.2011.240 (2012). - DOI - PubMed
    1. Kluger M. A. et al. Leukocyte-derived MMP9 is crucial for the recruitment of proinflammatory macrophages in experimental glomerulonephritis. Kidney Int 83, 865–877, 10.1038/ki.2012.483 (2013). - DOI - PubMed

Publication types

MeSH terms

LinkOut - more resources