. 2016 Aug;108(2):64-77.
doi: 10.1016/j.ygeno.2016.07.003. Epub 2016 Jul 16.

RNA polymerase II promoter-proximal pausing in mammalian long non-coding genes

Affiliations

RNA polymerase II promoter-proximal pausing in mammalian long non-coding genes

Heeyoun Bunch et al. Genomics. 2016 Aug.

Abstract

Mammalian genomes encode a large number of non-coding RNAs (ncRNAs) that greatly exceed mRNA genes. While the physiological and pathological roles of ncRNAs have been increasingly understood, the mechanisms of regulation of ncRNA expression are less clear. Here, our genomic study has shown that a significant number of long non-coding RNAs (lncRNAs, >1000 nucleotides) harbor RNA polymerase II (Pol II) engaged with the transcriptional start site. A pausing and transcriptional elongation factor for protein-coding genes, tripartite motif-containing 28 (TRIM28) regulates the transcription of a subset of lncRNAs in mammalian cells. In addition, the majority of lncRNAs in human and murine cells regulated by Pol II promoter-proximal pausing appear to function in stimulus-inducible biological pathways. Our findings suggest an important role of Pol II pausing for the transcription of mammalian lncRNA genes.

Keywords: Long non-coding RNAs; RNA polymerase II promoter-proximal pausing; TRIM28.


Conflict of interest statement

Competing interests: The authors declare no conflict of interest.

Figures

Fig. 1.
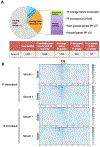
Fig. 1.. Mammalian lncRNAs are regulated by Pol II promoter-proximal pausing.
(A) Pausing indices of annotated lncRNAs (n= 1,535) in mouse embryonic stem (mES) cells. The graph was generated with pausing index calculable genes (non-zero gene body Pol II occupancy, n= 645). LncRNAs with pausing indices over 2 are 307 including 166 lncRNAs with pausing indices over 8. (B) Pol II metagene analysis comparing total (n= 1,535) versus paused lncRNAs (n= 307), displaying a significant accumulation of Pol II paused at TSSs in many lncRNAs in mES cells. (C) Pausing indices of lncRNAs (n= 2,482) in human embryonic kidney 293 cells, indicating a large number of human lncRNAs to harbor Pol II paused in the promoter-proximal region. (D) A metagene analysis of Pol II depicting prevalent Pol II pausing in lncRNAs (all, blue, n= 1,752; paused (PI >2), green, n= 839; paused (PI > 8), red, n= 316) in humans. An orange bracket with a star marks a region (−100 to +150) for a zoom-in view shown in the top right panel. A green bracket marks the gene body region (> +600 from the TSS) that displays diverse Pol II occupancies in the 3 gene groups described above, a zoom-in view shown in the bottom right panel. PI, pausing index. (E) A chromosome view of RBM26-AS1 showing accumulated Pol II occupancy in the promoter-proximal site.
Fig. 2.
Fig. 2.. TRIM28 KD regulates the expression of a number of lncRNAs in mES cells.
(A) LncRNAs categorized by pausing index change between WT and TRIM28 KD mES cells. Genes with pausing indices increased (PI increased, n= 24) or decreased (PI decreased, n= 69) over 2 fold, or changed less than 2 fold (PI change below threshold, n= 211) upon TRIM28 KD. (B) A metagene analysis of Pol II occupancy at lncRNAs with decreased pausing indices upon TRIM28 KD (n= 69, p = 6.009e-6). TRIM28 KD increased Pol II occupancy in the gene body (> +300 from TSS) at these genes. The p-value shown was calculated by a paired Wilcoxon signedrank test, using the sums of normalized, input-adjusted reads in the window between +300 and +999. (C) Heatmaps of Pol II occupancy at 1,535 lncRNAs in WT, TRIM28 KD (KD), and KD-WT, illustrating the overall change of Pol II occupancy at these genes upon TRIM28 KD (p-value for TSS to +999, 1.413e–05). (D) A chromosome view of Stamos (AK014986) depicting increased Pol II occupancy in the downstream of Pol II pausing site (marked with red box) upon TRIM28 KD. (E) Hierarchical clustering comparing gene expression profiles (n= 308; fold change > 1.5; P < 0.05) between TRIM28 KD (the first set of triplicates from the left) and WT (the second set of triplicates) mES cells. Red, increased expression; Green, decreased expression; Black, no change.
Fig. 3.
Fig. 3.. Stimulus-inducible long non-coding genes are regulated by Pol II promoter-proximal pausing in mammalian cells.
(A) Pausing index changes of human lncRNAs between control and serum induced HEK293 cells. Pausing index decreased genes tend to be more paused, suggesting that serum-induced lncRNAs are paused as in coding genes. PI, pausing index; S0, control, non-serum induced HEK293 cells; S15, serum-induced HEK293 cells. (B) Pol II heatmaps of pausing index (PI) decreased and increased long non-coding genes. Pausing index-decreased genes displayed a Pol II peak in a defined locus near TSS (Transcription Start Site) in control cells (Serum −). Pausing index increased genes showed weak Pol II TSS peaks in a broad area, implying less Pol II pausing. Upon serum induction (Serum +), Pol II occupancy was increased in TSS and downstream (toward gene body) in pausing index-decreased genes while the Pol II occupancy increase was observed in TSS and upstream (toward promoters) in pausing index-increased genes. (C) Box plots showing Pol II occupancy changes in TSSs and gene bodies in pausing index (PI) decreased and increased genes. TSS Pol II becomes slightly increased in both groups of genes while gene body Pol II is increased and decreased in pausing index decreased and increased genes, respectively. (D) A bootstrap resampling procedure. For each bootstrap sample (1e5 total), the effect size was computed as the difference between the median value of the samples in control and serum induced states (for both TSS and body regions). A positive value indicates an increase in pol-II occupancy. The normalized empirical distribution was plotted with horizontal bars indicating the 2.5% and 97.5% percentiles. (E) A chromosome view of SNHG8, representing increased Pol II occupancy in the gene body upon serum induction. Red and blue peaks are in control cells and serum-induced cells, respectively. (F) Correlation analysis between TRIM28 phosphorylation at S824 (pTRIM28) and Pol II occupancy, showing that a subset of long non-coding genes (n= 264) accumulated Pol II and pTRIM28 simultaneously upon serum induction. The long non-coding genes with increased pTRIM28 in serum-induced cells were collected and correlated with Pol II occupancy. The inset on right is a zoomed view for the boxed region in the main plot. Pearson's correlation coefficient = 0.95. (G) Pol II heatmaps of pTRIM28 increased or decreased genes upon serum induction (S15), showing a simultaneous increase of Pol II occupancy and pTRIM28 at some long noncoding genes (n= 20). For statistic values, normalized, mean Pol II occupancy was calculated for each gene in the window of interest (−2,000, +2,500 bp). Both pTRIM28 increased and decreased genes demonstrated a difference in Pol II occupancy (p< 0.001 by Wilcoxon signedrank test) and pTRIM28 increased genes showed greater changes in Pol II occupancy following induction (p= 0.01 by Mann-Whitney U test).
Fig. 4.
Fig. 4.. Paused lncRNA genes are involved in stimulus-inducible biological pathways.
(A) GO analysis of murine and human long non-coding genes, showing common and unique biological pathways. Stimulus-inducible pathways are in italic. (B) Radar graphs showing the major biological pathways for lncRNAs in human HEK293 cells (upper) and in mES cells (bottom), implying tissue-specific functions of lncRNAs. In spite of tissue-specific functions, paused long non-coding genes mainly regulate stimulus-inducible pathways. Metabolism appears to be regulated by many lncRNAs in both, especially in human HEK293 cells and a number of mES lncRNAs are involved in development/differentiation. (C) A model of RNA polymerase II promoter-proximal pausing in inducible lncRNA genes. In the uninduced state of transcription, Pol II is paused in the promoter-proximal site of lncRNA genes. TRIM28 stabilizes Pol II pausing in a subset of these lncRNA genes. Upon transcriptional activation, Pol II is released from the pausing site, which involves phosphorylation of TRIM28 at S824 (marked with a purple star).

Similar articles

Cited by

References

    1. Bierhoff H, Dammert MA, Brocks D, Dambacher S, Schotta G, Grummt I: Quiescence-induced LncRNAs trigger H4K20 trimethylation and transcriptional silencing. Mol Cell 2014, 54:675–682. - PubMed
    1. Lee JT, Bartolomei MS: X-inactivation, imprinting, and long noncoding RNAs in health and disease. Cell 2013, 152:1308–1323. - PubMed
    1. Sarachana T, Dahiya N, Simhadri VL, Pandey GS, Saini S, Guelcher C, Guerrera MF, Kimchi-Sarfaty C, Sauna ZE, Atreya CD: Small ncRNA Expression-Profiling of Blood from Hemophilia A Patients Identifies miR-1246 as a Potential Regulator of Factor 8 Gene. PLoS One 2015, 10:e0132433. - PMC - PubMed
    1. Yin QF, Yang L, Zhang Y, Xiang JF, Wu YW, Carmichael GG, Chen LL: Long noncoding RNAs with snoRNA ends. Mol Cell 2012, 48:219–230. - PubMed
    1. Carpenter S, Ricci EP, Mercier BC, Moore MJ, Fitzgerald KA: Post-transcriptional regulation of gene expression in innate immunity. Nat Rev Immunol 2014, 14:361–376. - PubMed