. 2016 Sep;12(35):4837-4848.
doi: 10.1002/smll.201600925. Epub 2016 Jul 19.

Mixed Nanosized Polymeric Micelles as Promoter of Doxorubicin and miRNA-34a Co-Delivery Triggered by Dual Stimuli in Tumor Tissue

Affiliations

Mixed Nanosized Polymeric Micelles as Promoter of Doxorubicin and miRNA-34a Co-Delivery Triggered by Dual Stimuli in Tumor Tissue

Giuseppina Salzano et al. Small. 2016 Sep.

Abstract

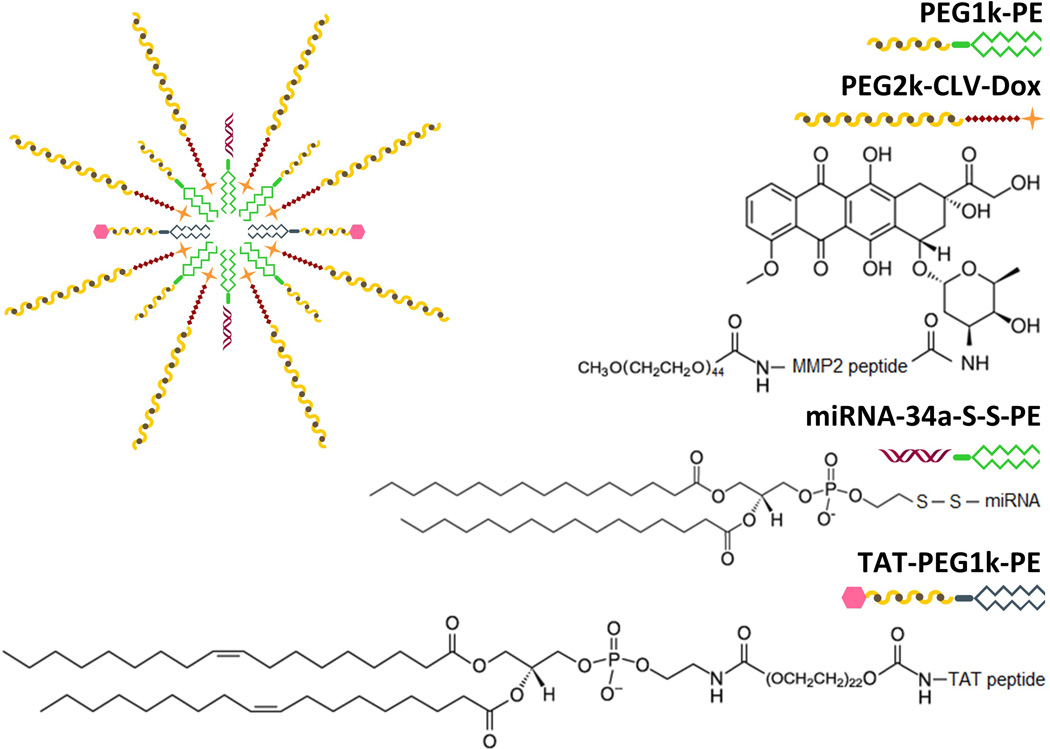
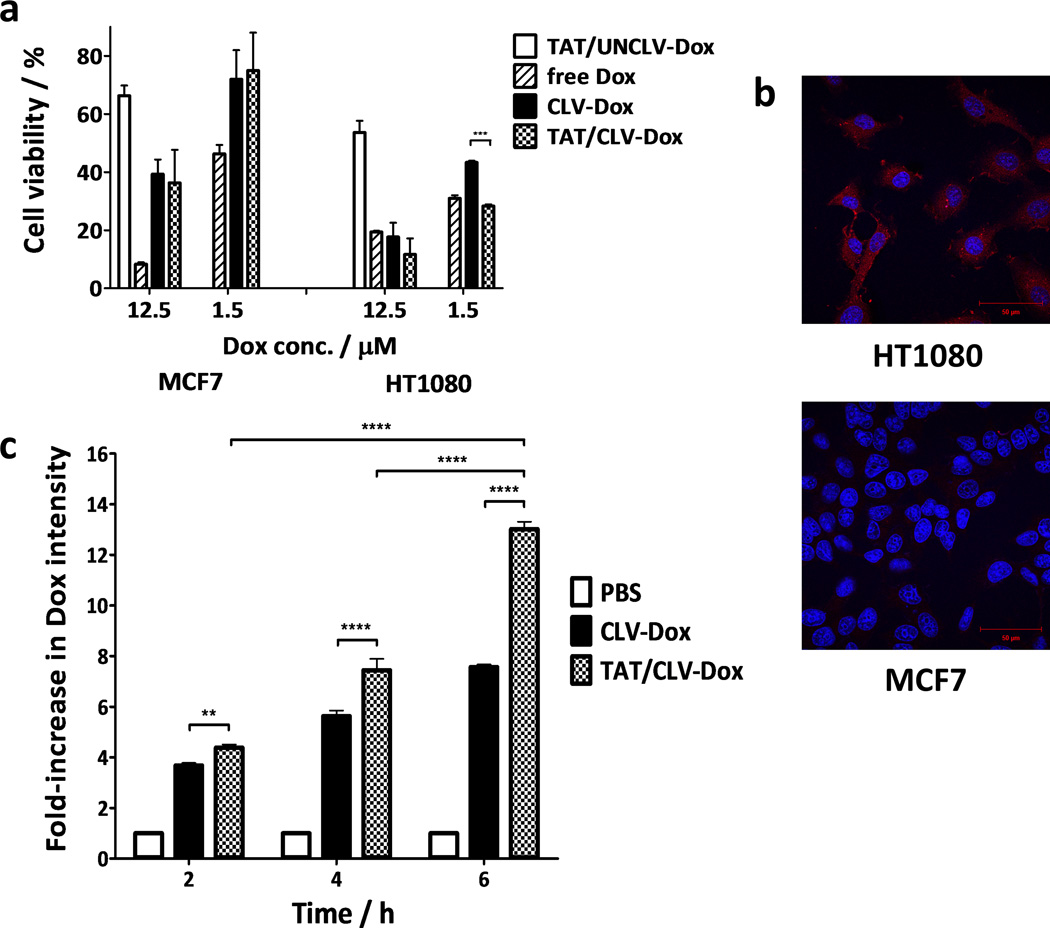
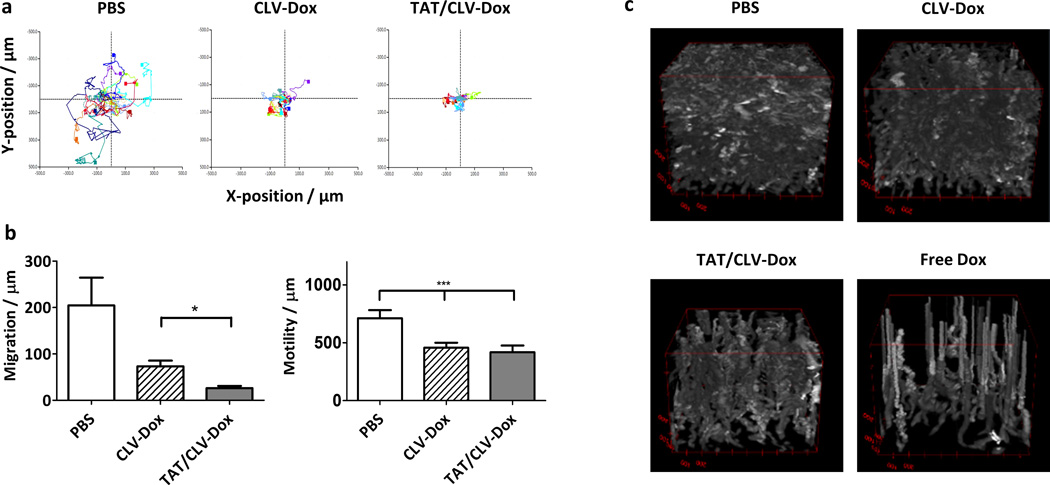
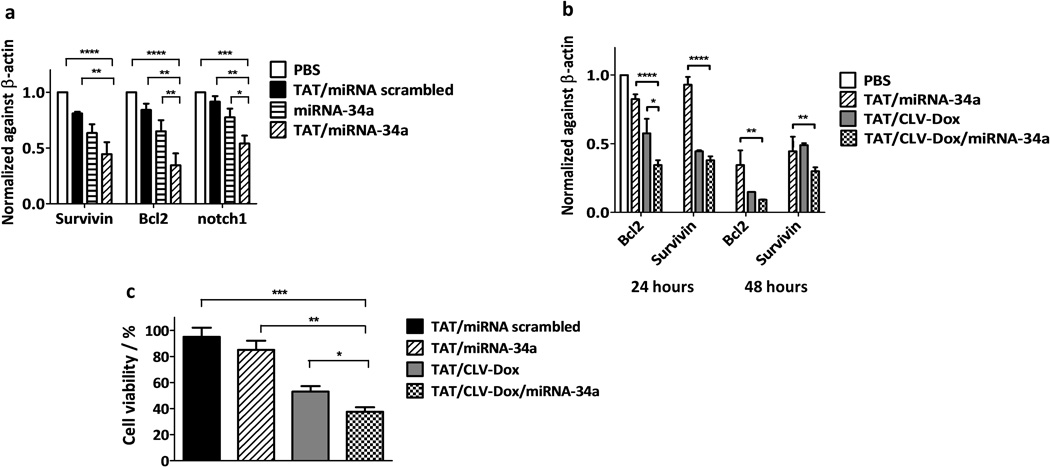
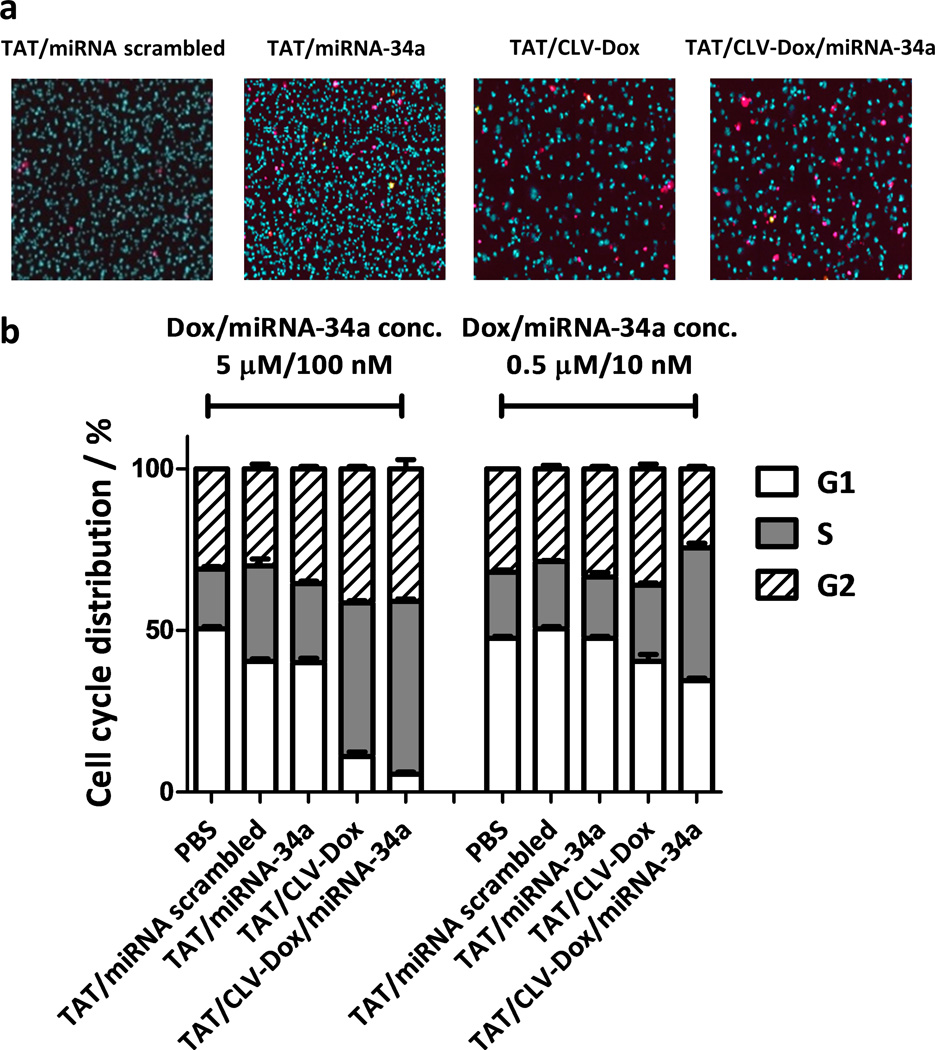
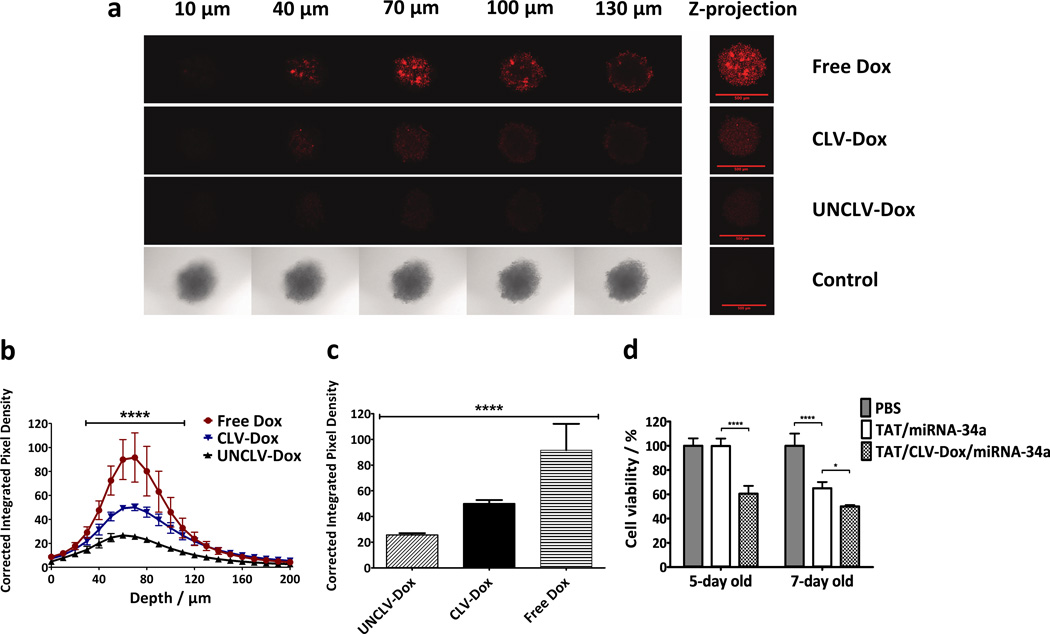
Dual stimuli-sensitive mixed polymeric micelles (MM) are developed for co-delivery of the endogenous tumor suppressor miRNA-34a and the chemotherapeutic agent doxorubicin (Dox) into cancer cells. The novelty of the system resides in two stimuli-sensitive prodrugs, a matrix metalloproteinase 2 (MMP2)-sensitive Dox conjugate and a reducing agent (glutathione, GSH)-sensitive miRNA-34a conjugate, self-assembled in a single particle decorated with a polyethylene glycol corona for longevity, and a cell-penetrating peptide (TATp) for enhanced intracellular delivery. The MMP2-sensitivity of the system results in threefold higher cytotoxicity in MMP2-overexpressing HT1080 cells compared to low MMP2-expressing MCF7 cells. Cellular internalization of Dox increases by more than 70% after inclusion of TATp to the formulation. MMP2-sensitive MM also inhibits proliferation and migration of HT1080 cells. Moreover, GSH-sensitive MM allows for an efficient downregulation of Bcl2, survivin, and notch1 (65%, 55%, and 46%, respectively) in HT1080 cells. Combination of both conjugates in dual sensitive MM reduces HT1080 cell viability to 40% and expression of Bcl2 and survivin. Finally, 50% cell death is observed in 3D models of tumor mass. The results confirm the potential of the MM to codeliver miRNA-34a and doxorubicin triggered by dual stimuli inherent of tumor tissues.

Keywords: doxorubicin; miRNA-34a; mixed micelles; spheroid; stimuli-sensitive, cancer therapy.


Figures

Figure 1
Figure 1
Schematic representation of the drug delivery strategy and proposed chemical structures of the synthesized conjugates.
Figure 2
Figure 2
Characterization of the conjugates. a, Tracking of Dox conjugate synthesis by TLC analysis. (1) Free Dox (red spot), (2) PEG2k-CLV-Dox (red spot) and (3) PEG2k-CLV-Dox stained with Dragendorff’s reagent (orange spots are related to PEG moiety). b, RP-HPLC chromatograms of (1) Free Dox, (2) PEG2k-CLV-Dox immediately after synthesis and (3) PEG2k-CLV-Dox purified by dialysis. c, RP-HPLC chromatograms of (1) PEG2k-CLV-Dox after 1h and (2) 3h of exposition to MMP2 enzyme; (3) PEG2k-UNCLV-Dox after incubation overnight with MMP2 enzyme. d, MALDI-TOF mass spectra of free miRNAs and miRNA conjugates before and after cleavage by GSH.
Figure 3
Figure 3
In vitro effect of MMP2-sensitive MM in HT1080 cells. a–b, Cell viability after treatment with MMP2-sensitive MM (n = 9 treatments). c–d, Apoptosis and cell cycle distribution, respectively, after treatment with MMP2-sensitive MM (n = 3 treatments). p-values were obtained by comparison of groups indicated. ****p ≤ 0.0001, ***p ≤ 0.001 and **p ≤ 0.01. Error bars represent mean ± SD.
Figure 4
Figure 4
Cell-specific effect of MMP2-sensitive MM. a, Cell viability of HT1080 and MCF7 cells treated with MMP2-sensitive MM (n = 9 treatments). b, Confocal images of HT1080 and MCF7 cells treated with TAT/CLV-Dox MM. In the image, red is associated to Dox fluorescence and blue to the cell nuclei stained with Hoechst. Magnification = 63×. Scale bar = 50 µm. c, Quantitative analysis of Dox uptake in HT1080 cells treated with MMP2-sensitive MM (n = 3 treatments). p-values were obtained by comparison of groups indicated. ****p ≤ 0.0001, ***p ≤ 0.001, **p ≤ 0.01 and *p ≤ 0.05. Error bars represent mean ± SD.
Figure 5
Figure 5
Time-lapse cytometry analysis of HT1080 cells after treatment with MMP2-sensitive MM. a, Cell trajectory plot. b, Quantitative assessment of cell motility and migration. c, 4D plots of cell proliferation over the time of analysis. p-values were obtained by comparison of groups indicated. ***p ≤ 0.001 and *p ≤ 0.05. Error bars represent mean ± SD (n = 10 individual cells per treatment).
Figure 6
Figure 6
Effect of MM in gene expression and cell viability of HT1080 cells. a, mRNA levels of Bcl2, survivin and notch1 after treatment with GSH-sensitive MM at miRNA-34a concentration of 100 nM (n = 3 treatments). b, mRNA levels of Bcl2 and survivin after treatment with dual sensitive MM at miRNA-34a/Dox concentration of 100 nM and 5 µM, respectively (n = 3 treatments). c, Cell viability in 2D monolayer model after treatment with dual sensitive MM at miRNA-34a/Dox concentration of 100 nM and 5 µM, respectively (n = 3 treatments). p-values were obtained by comparison of groups indicated. ****p ≤ 0.0001, ***p ≤ 0.001, **p ≤ 0.01 and *p ≤ 0.05. Error bars represent mean ± SD.
Figure 7
Figure 7
Effect of MM in apoptosis and cell cycle distribution of HT1080 cells. a, Laser scanning cytometry images after treatment with dual sensitive MM at miRNA-34a/Dox concentration of 50 nM and 2.5 mM, respectively. Magnification = 40×. Dead cells are stained in magenta and nuclei of live cells are stained in blue. b, Cell cycle distribution after treatment with dual sensitive MM at high and low concentrations of miRNA-34a and Dox. Error bars represent mean ± SD (n = 3 treatments).
Figure 8
Figure 8
Effect of MMP2-sensitive Dox conjugate and MM in HT1080 spheroid model. a, Dox distribution throughout the spheroids at different layers of depth. Maximum pixel intensity of Z-projection images represent the total Dox fluorescence in each layer of the spheroids. Scale bar = 500 µm. b, Corrected integrated pixel densities as an indicator of Dox intensity in the core area of each optical slice of the spheroids. The difference between all groups were significant from 40 to 110 µm (n = 5, ****p ≤ 0.0001, Two-way ANOVA with Tukey’s multiple comparisons test). c, Dox fluorescence signal at 70 µm depth of the spheroids in B (n = 5 spheroids). d, Cell viability in 3D spheroid model after treatment with dual sensitive MM at miRNA-34a/Dox concentration of 100 nM and 10 µM, respectively (n = 5 spheroids per treatment). p-values were obtained by comparison of groups indicated. ****p ≤ 0.0001, ***p ≤ 0.001, **p ≤ 0.01 and *p ≤ 0.05. Error bars represent mean ± SD.

Similar articles

Cited by

References

    1. Stefani G, Slack FJ. Nat. Rev. Mol. Cell Biol. 2008;9:219–230. - PubMed
    1. Tong AW, Nemunaitis J. Cancer Gene Ther. 2008;15:341–355. - PubMed
    1. Hammond SM. Cancer Chemother. Pharmacol. 2006;58:s63–s68. - PubMed
    1. Bader AG, Brown D, Winkler M. Cancer Res. 2010;70:7027–7030. - PMC - PubMed
    1. Siemens H, Jackstadt R, Kaller M, Hermeking H. Oncotarget. 2013;4:1399–1415. - PMC - PubMed

MeSH terms

LinkOut - more resources