

Kidney Transplantation Outcomes across GN Subtypes in the United States
- PMID: 27432742
- PMCID: PMC5280017
- DOI: 10.1681/ASN.2016020126
Kidney Transplantation Outcomes across GN Subtypes in the United States
Abstract
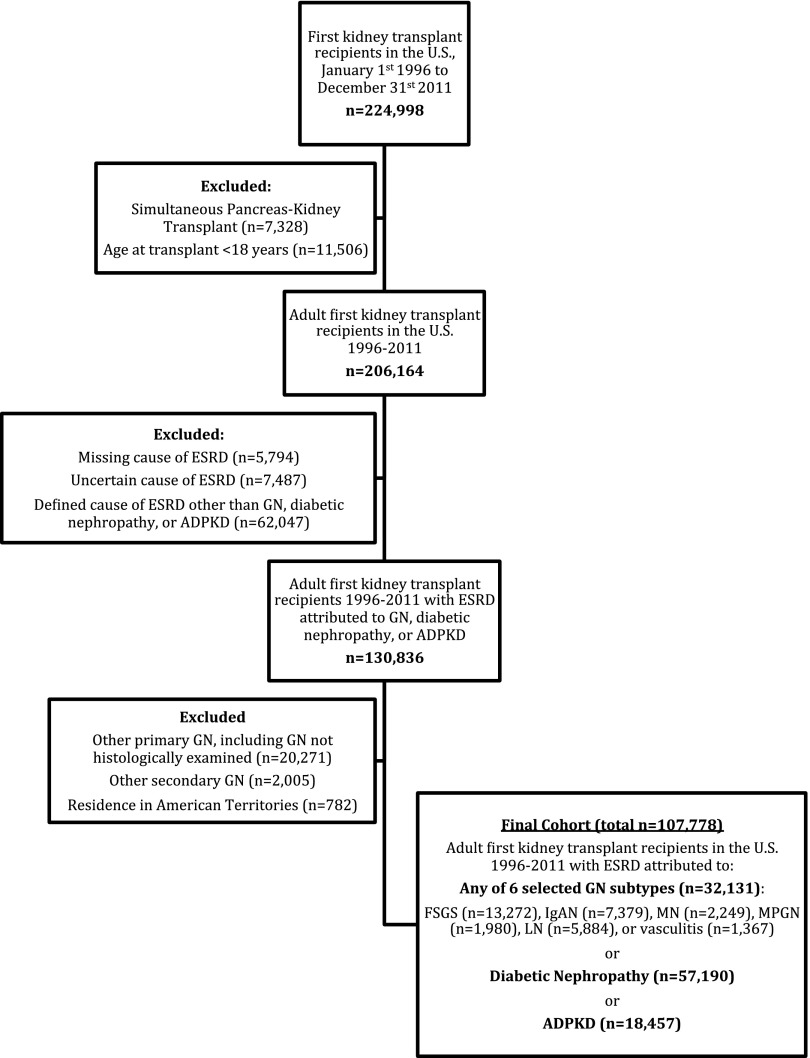
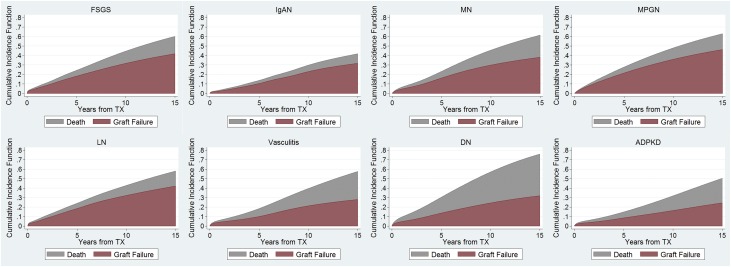
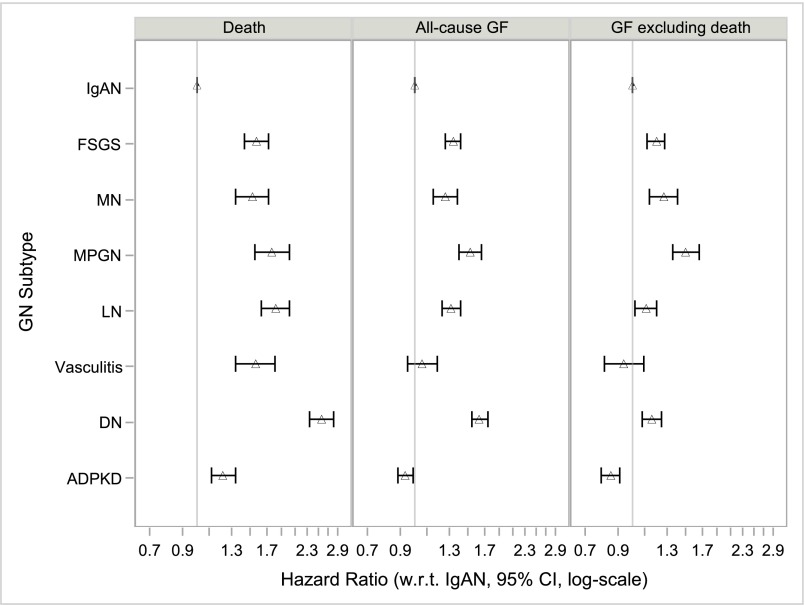
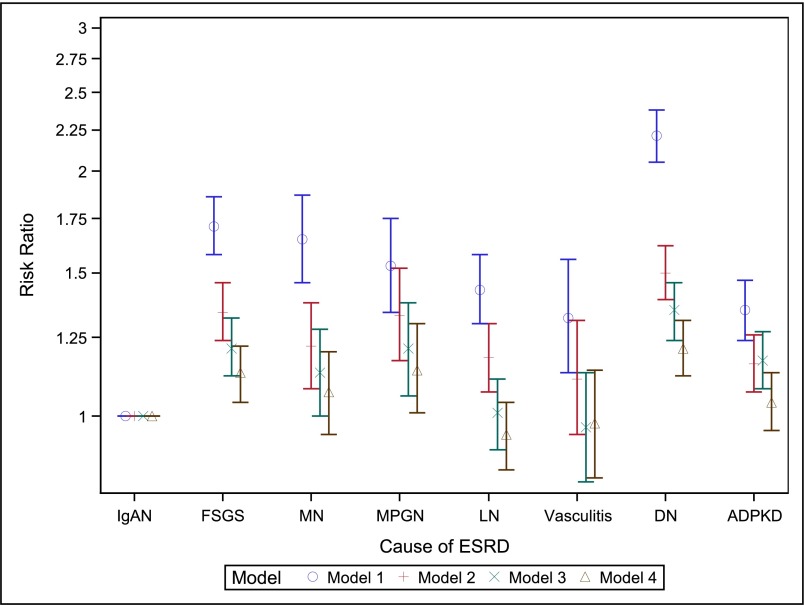
Differences in kidney transplantation outcomes across GN subtypes have rarely been studied. From the US Renal Data System, we identified all adult (≥18 years) first kidney transplant recipients (1996-2011) with ESRD attributed to one of six GN subtypes or two comparator kidney diseases. We computed hazard ratios (HRs) for death, all-cause allograft failure, and allograft failure excluding death as a cause (competing risks framework) using Cox proportional hazards regression. Among the 32,131 patients with GN studied, patients with IgA nephropathy (IgAN) had the lowest mortality rates and patients with IgAN or vasculitis had the lowest allograft failure rates. After adjusting for patient- and transplant-related factors, compared with IgAN (referent), FSGS, membranous nephropathy, membranoproliferative GN, lupus nephritis, and vasculitis associated with HRs (95% confidence intervals) for death of 1.57 (1.43 to 1.72), 1.52 (1.34 to 1.72), 1.76 (1.55 to 2.01), 1.82 (1.63 to 2.02), and 1.56 (1.34 to 1.81), respectively, and with HRs for allograft failure excluding death as a cause of 1.20 (1.12 to 1.28), 1.27 (1.14 to 1.41), 1.50 (1.36 to 1.66), 1.11 (1.02 to 1.20), and 0.94 (0.81 to 1.09), respectively. Considering external comparator groups, and comparing with IgAN, autosomal dominant polycystic kidney disease (ADPKD) and diabetic nephropathy associated with higher HRs for mortality [1.22 (1.12 to 1.34) and 2.57 (2.35 to 2.82), respectively], but ADPKD associated with a lower HR for allograft failure excluding death as a cause [0.85 (0.79 to 0.91)]. Reasons for differential outcomes by GN subtype and cause of ESRD should be examined in future research.
Keywords: chronic allograft failure; clinical epidemiology; glomerulonephritis; kidney transplantation; mortality.
Copyright © 2017 by the American Society of Nephrology.
Figures
Similar articles
-
Recurrent and de novo Glomerulonephritis After Kidney Transplantation.Front Immunol. 2019 Aug 14;10:1944. doi: 10.3389/fimmu.2019.01944. eCollection 2019. Front Immunol. 2019. PMID: 31475005 Free PMC article. Review.
-
Kidney Transplantation Rates Across Glomerulonephritis Subtypes in the United States.Transplantation. 2017 Oct;101(10):2636-2647. doi: 10.1097/TP.0000000000001657. Transplantation. 2017. PMID: 28207635
-
Patient characteristics and outcomes by GN subtype in ESRD.Clin J Am Soc Nephrol. 2015 Jul 7;10(7):1170-8. doi: 10.2215/CJN.11261114. Epub 2015 Jun 19. Clin J Am Soc Nephrol. 2015. PMID: 26092830 Free PMC article.
-
Differences in initial treatment modality for end-stage renal disease among glomerulonephritis subtypes in the USA.Nephrol Dial Transplant. 2016 Feb;31(2):290-8. doi: 10.1093/ndt/gfv386. Epub 2015 Nov 25. Nephrol Dial Transplant. 2016. PMID: 26610594 Free PMC article.
-
Recent advances in our understanding of recurrent primary glomerulonephritis after kidney transplantation.Kidney Int. 2017 Feb;91(2):304-314. doi: 10.1016/j.kint.2016.08.030. Epub 2016 Nov 10. Kidney Int. 2017. PMID: 27837947 Review.
Cited by
-
IgA nephropathy.Nat Rev Dis Primers. 2023 Nov 30;9(1):67. doi: 10.1038/s41572-023-00476-9. Nat Rev Dis Primers. 2023. PMID: 38036542 Review.
-
II Brazilian Society of Rheumatology consensus for lupus nephritis diagnosis and treatment.Adv Rheumatol. 2024 Jun 18;64(1):48. doi: 10.1186/s42358-024-00386-8. Adv Rheumatol. 2024. PMID: 38890752
-
Epidemiological profile of kidney transplant patients with lupus nephritis.J Bras Nefrol. 2025 Apr-Jun;47(2):e20240061. doi: 10.1590/2175-8239-JBN-2024-0061en. J Bras Nefrol. 2025. PMID: 39671453 Free PMC article.
-
Recurrent Glomerulonephritis after Renal Transplantation: The Clinical Problem.Int J Mol Sci. 2020 Aug 19;21(17):5954. doi: 10.3390/ijms21175954. Int J Mol Sci. 2020. PMID: 32824988 Free PMC article. Review.
-
Recurrent and de novo Glomerulonephritis After Kidney Transplantation.Front Immunol. 2019 Aug 14;10:1944. doi: 10.3389/fimmu.2019.01944. eCollection 2019. Front Immunol. 2019. PMID: 31475005 Free PMC article. Review.
References
-
- Rabbat CG, Thorpe KE, Russell JD, Churchill DN: Comparison of mortality risk for dialysis patients and cadaveric first renal transplant recipients in Ontario, Canada. J Am Soc Nephrol 11: 917–922, 2000 - PubMed
-
- Wolfe RA, Ashby VB, Milford EL, Ojo AO, Ettenger RE, Agodoa LY, Held PJ, Port FK: Comparison of mortality in all patients on dialysis, patients on dialysis awaiting transplantation, and recipients of a first cadaveric transplant. N Engl J Med 341: 1725–1730, 1999 - PubMed
-
- Cameron JI, Whiteside C, Katz J, Devins GM: Differences in quality of life across renal replacement therapies: a meta-analytic comparison. Am J Kidney Dis 35: 629–637, 2000 - PubMed
-
- United States Renal Data System: 2014 USRDS annual data report: Epidemiology of Kidney Disease in the United States. National Institutes of Health, National Institute of Diabetes and Digestive and Kidney Diseases, Bethesda, MD, 2014
-
- Meier-Kriesche HU, Schold JD, Srinivas TR, Kaplan B. Lack of improvement in renal allograft survival despite a marked decrease in acute rejection rates over the most recent era. Am J Transplant 4: 378–383, 2004 - PubMed
Publication types
MeSH terms
Grants and funding
LinkOut - more resources
Full Text Sources
Other Literature Sources
Medical
Miscellaneous
