

Oxidative stress-mediated intrinsic apoptosis in human promyelocytic leukemia HL-60 cells induced by organic arsenicals
- PMID: 27432798
- PMCID: PMC4949440
- DOI: 10.1038/srep29865
Oxidative stress-mediated intrinsic apoptosis in human promyelocytic leukemia HL-60 cells induced by organic arsenicals
Abstract
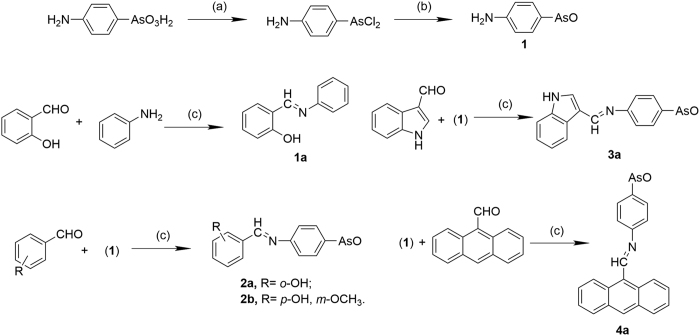
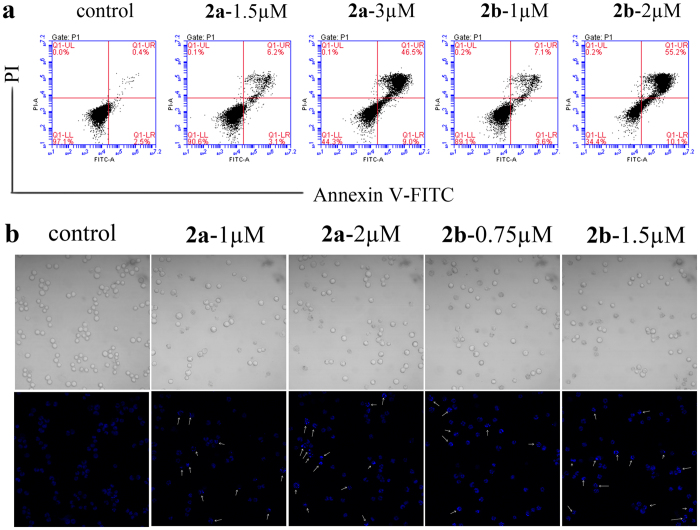
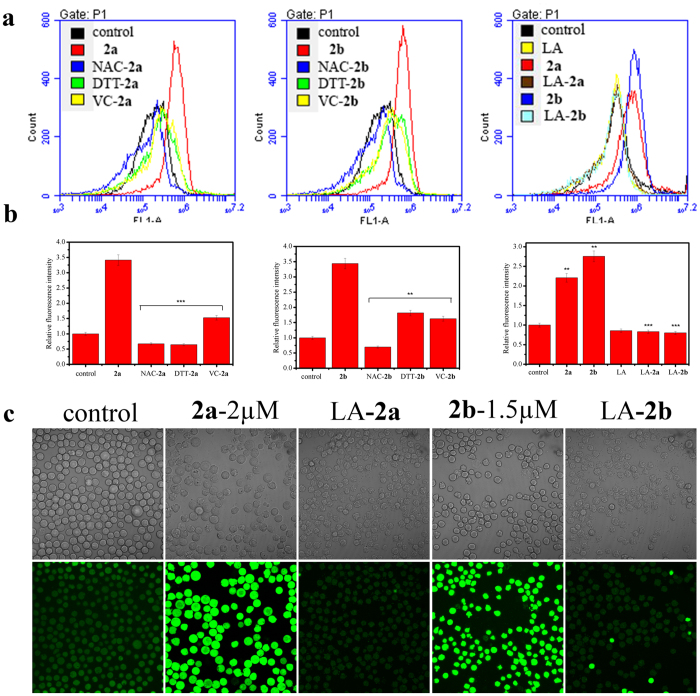
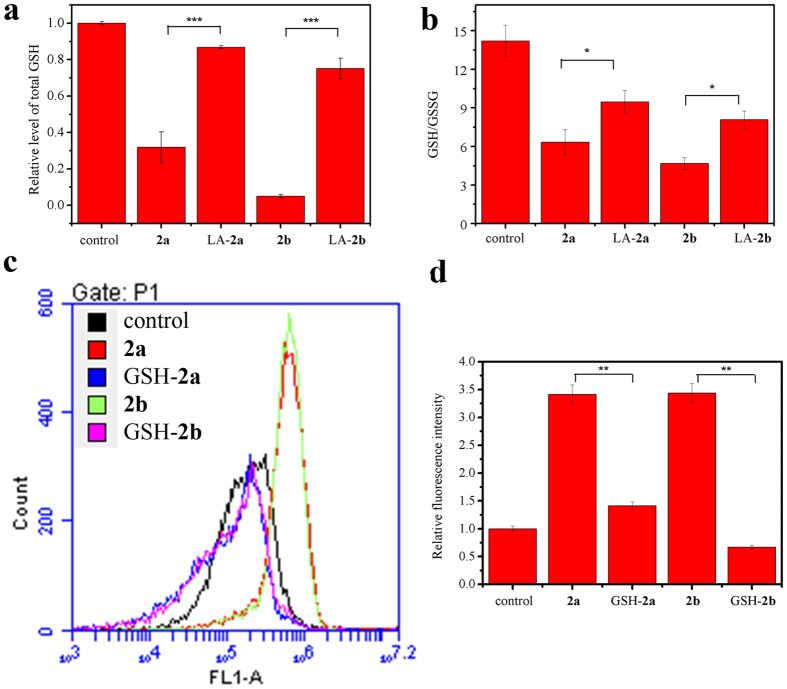
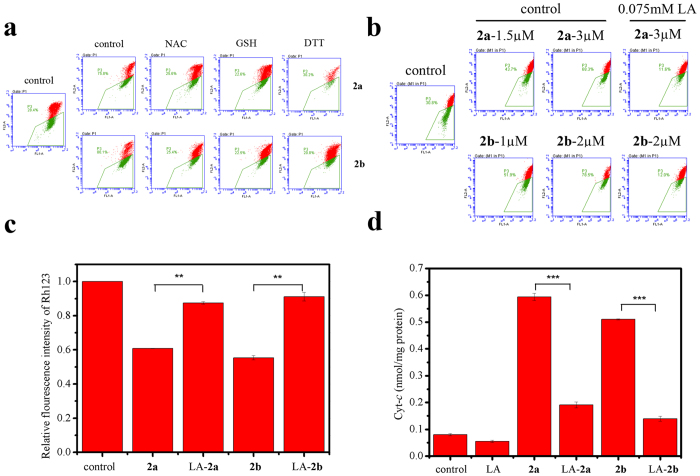
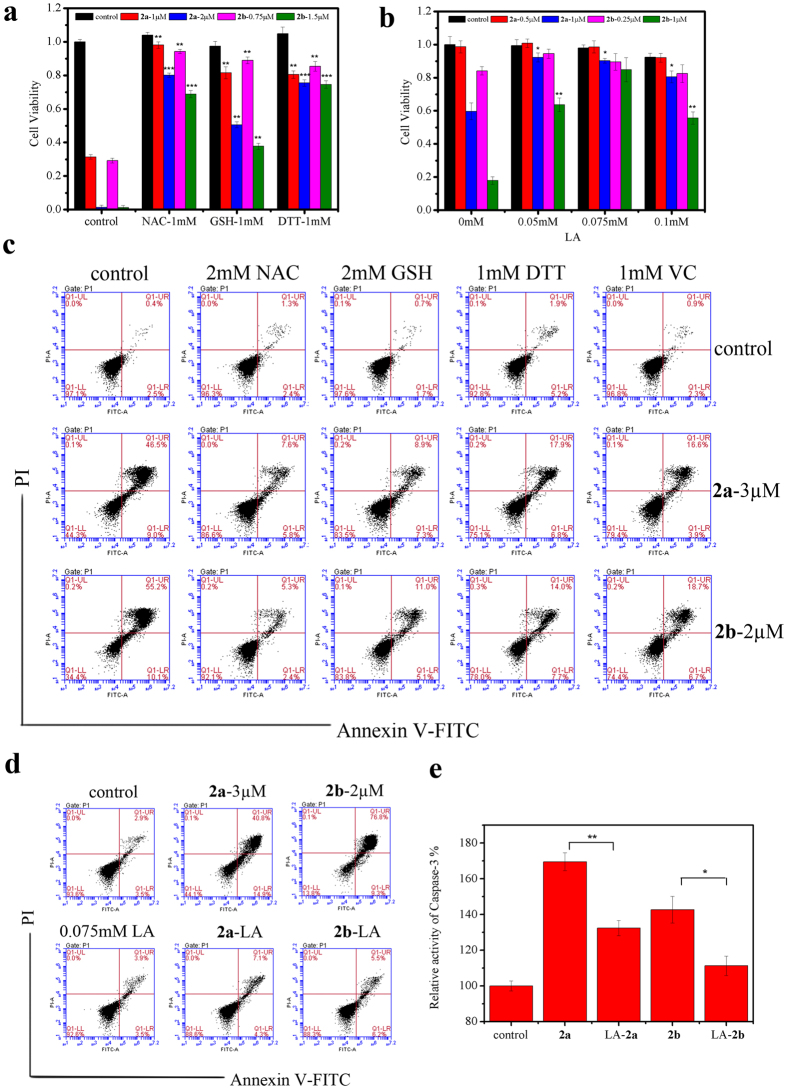
Arsenic trioxide has shown the excellent therapeutic efficiency for acute promyelocytic leukemia. Nowadays, more and more research focuses on the design of the arsenic drugs, especially organic arsenicals, and on the mechanism of the inducing cell death. Here we have synthesized some organic arsenicals with Schiff base structure, which showed a better antitumor activity for three different kinds of cancer cell lines, namely HL-60, SGC 7901 and MCF-7. Compound 2a (2-(((4-(oxoarsanyl)phenyl)imino)methyl)phenol) and 2b (2-methoxy-4-(((4-(oxoarsanyl)phenyl)imino)methyl)phenol) were chosen for further mechanism study due to their best inhibitory activities for HL-60 cells, of which the half inhibitory concentration (IC50) were 0.77 μM and 0.51 μM, respectively. It was illustrated that 2a or 2b primarily induced the elevation of reactive oxygen species, decrease of glutathione level, collapse of mitochondrial membrane potential, release of cytochrome c, activation of Caspase-3 and apoptosis, whereas all of the phenomena can be eliminated by the addition of antioxidants. Therefore, we concluded that compound 2a and 2b can induce the oxidative stress-mediated intrinsic apoptosis in HL-60 cells. Both the simplicity of structure with Schiff base group and the better anticancer efficiency demonstrate that organic arsenicals are worthy of further exploration as a class of potent antitumor drugs.
Figures
Similar articles
-
Effects of arsenic compounds on growth, cell-cycle distribution and apoptosis of tretinoin-resistant human promyelocytic leukemia cells.Anticancer Res. 2014 Nov;34(11):6489-94. Anticancer Res. 2014. PMID: 25368250
-
Arsenic trioxide induces oxidative stress, DNA damage, and mitochondrial pathway of apoptosis in human leukemia (HL-60) cells.J Exp Clin Cancer Res. 2014 May 16;33(1):42. doi: 10.1186/1756-9966-33-42. J Exp Clin Cancer Res. 2014. PMID: 24887205 Free PMC article.
-
Association of oxidative stress with realgar-induced differentiation in human leukemia HL-60 cells.Chemotherapy. 2009;55(6):460-7. doi: 10.1159/000265528. Epub 2009 Dec 9. Chemotherapy. 2009. PMID: 19996592
-
Signal transduction pathways and transcription factors triggered by arsenic trioxide in leukemia cells.Toxicol Appl Pharmacol. 2010 May 1;244(3):385-92. doi: 10.1016/j.taap.2010.02.012. Epub 2010 Mar 1. Toxicol Appl Pharmacol. 2010. PMID: 20193703 Review.
-
Arsenic trioxide mechanisms of action--looking beyond acute promyelocytic leukemia.Leuk Lymphoma. 2008 Oct;49(10):1846-51. doi: 10.1080/10428190802464745. Leuk Lymphoma. 2008. PMID: 18949607 Review. No abstract available.
Cited by
-
Design and Synthesis of Thiourea-Conjugating Organic Arsenic D-Glucose with Anticancer Activities.Molecules. 2024 Jun 14;29(12):2850. doi: 10.3390/molecules29122850. Molecules. 2024. PMID: 38930915 Free PMC article.
-
Toxicity of Pb2+ on rat liver mitochondria induced by oxidative stress and mitochondrial permeability transition.Toxicol Res (Camb). 2017 Sep 25;6(6):822-830. doi: 10.1039/c7tx00204a. eCollection 2017 Nov 1. Toxicol Res (Camb). 2017. PMID: 30090545 Free PMC article.
-
Carbohydrate-conjugated 4-(1,3,2-dithiarsolan-2-yl)aniline as a cytotoxic agent against colorectal cancer.RSC Adv. 2018 Dec 5;8(71):40760-40764. doi: 10.1039/c8ra07860b. eCollection 2018 Dec 4. RSC Adv. 2018. PMID: 35557891 Free PMC article.
-
A novel organic arsenic derivative MZ2 remodels metabolism and triggers mtROS-mediated apoptosis in acute myeloid leukemia.J Cancer Res Clin Oncol. 2023 Jul;149(8):4225-4242. doi: 10.1007/s00432-022-04333-2. Epub 2022 Sep 3. J Cancer Res Clin Oncol. 2023. PMID: 36056952 Free PMC article.
-
In vitro modulation of mercury-induced rat liver mitochondria dysfunction.Toxicol Res (Camb). 2018 Jul 10;7(6):1135-1143. doi: 10.1039/c8tx00060c. eCollection 2018 Nov 1. Toxicol Res (Camb). 2018. PMID: 30510683 Free PMC article.
References
-
- Jomova K. et al.. Arsenic: toxicity, oxidative stress and human disease. J Appl Toxicol 31, 95–107 (2011). - PubMed
-
- Chatterjee S., Sarkar S. & Bhattacharya S. Toxic Metals and Autophagy. Chem Res Toxicol 27, 1887–1900 (2014). - PubMed
-
- Ngu T. T. & Stillman M. J. Arsenic binding to human metallothionein. J Am Chem Soc 128, 12473–12483 (2006). - PubMed
-
- Liu S. et al.. Arsenic Induced Overexpression of Inflammatory Cytokines Based on the Human Urothelial Cell Model in Vitro and Urinary Secretion of Individuals Chronically Exposed to Arsenic. Chem Res Toxicol 27, 1934–1942 (2014). - PubMed
Publication types
MeSH terms
Substances
LinkOut - more resources
Full Text Sources
Other Literature Sources
Research Materials
