. 2017 Mar;13(3):225-235.
doi: 10.1016/j.jalz.2016.06.2358. Epub 2016 Jul 16.

Tract-specific white matter hyperintensities disrupt neural network function in Alzheimer's disease

Affiliations

Tract-specific white matter hyperintensities disrupt neural network function in Alzheimer's disease

Alexander N W Taylor et al. Alzheimers Dement. 2017 Mar.

Abstract

Introduction: White matter hyperintensities (WMHs) increase the risk of Alzheimer's disease (AD). Whether WMHs are associated with the decline of functional neural networks in AD is debated.

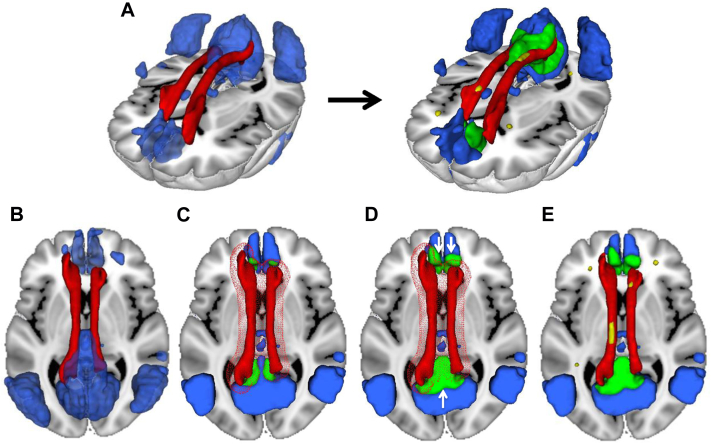
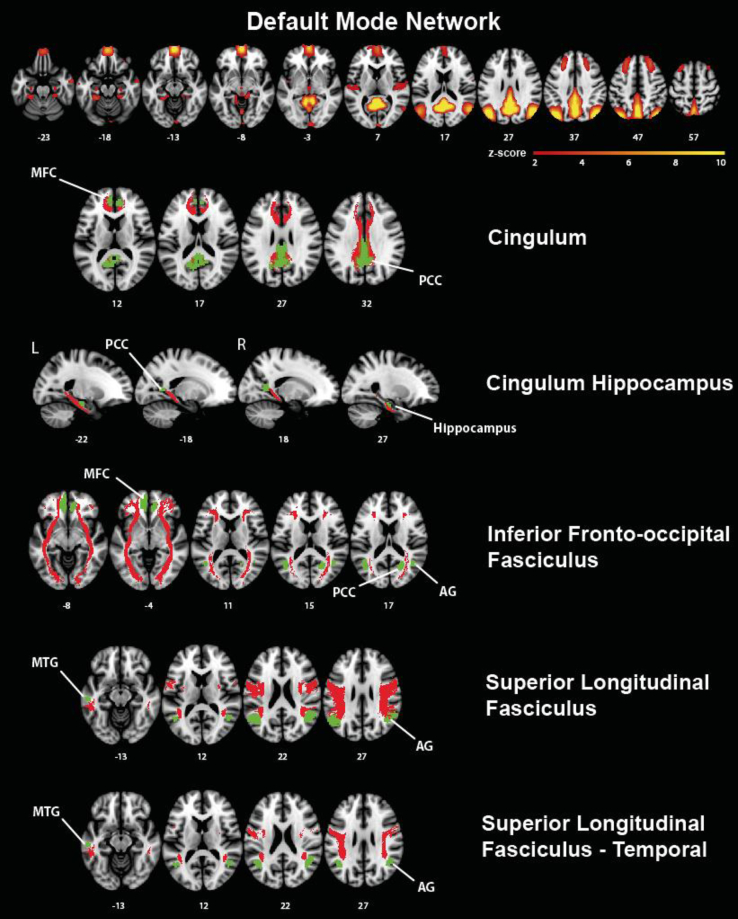
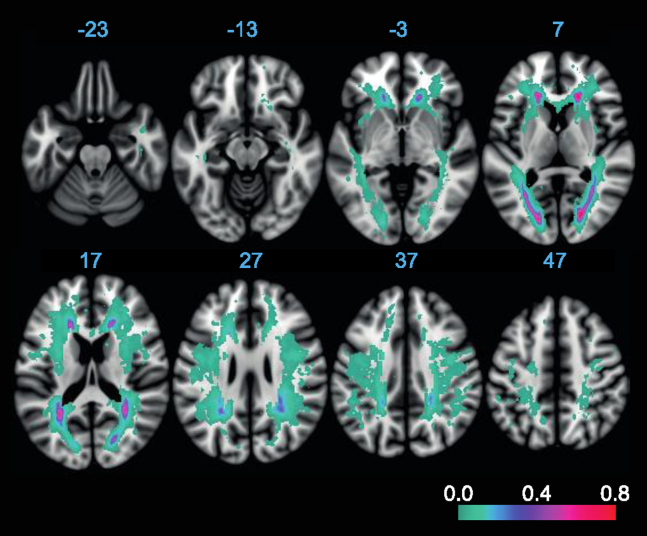
Method: Resting-state functional magnetic resonance imaging and WMH were assessed in 78 subjects with increased amyloid levels on AV-45 positron emission tomography (PET) in different clinical stages of AD. We tested the association between WMH volume in major atlas-based fiber tract regions of interest (ROIs) and changes in functional connectivity (FC) between the tracts' projection areas within the default mode network (DMN).

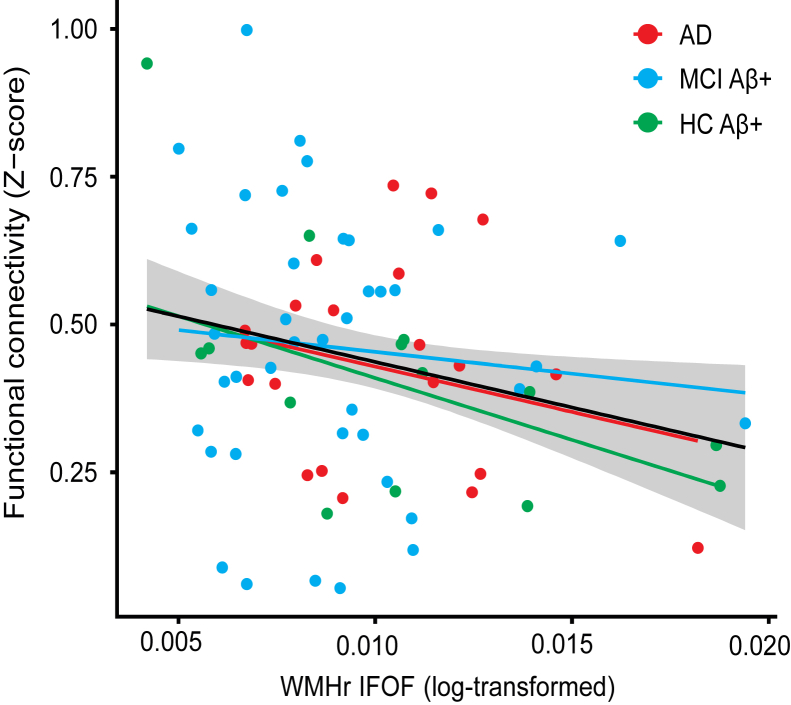
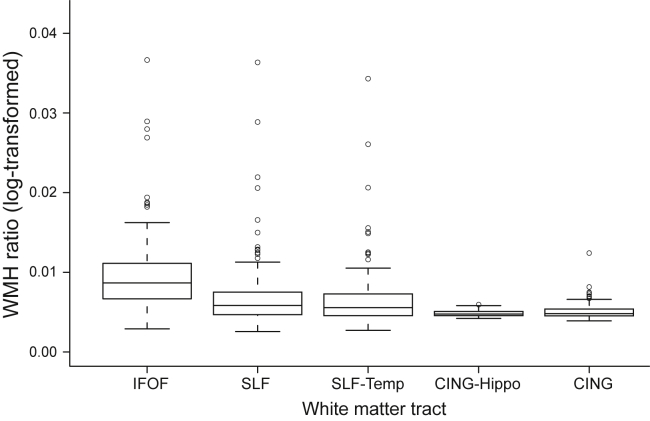
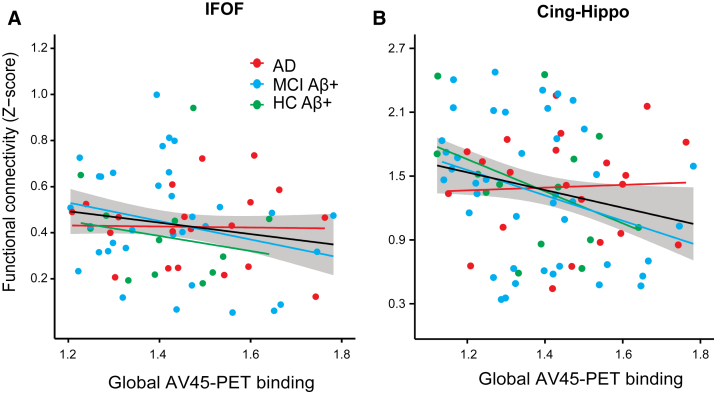
Results: WMH volume within the inferior fronto-occipital fasciculus (IFOF) was the highest among all tract ROIs and associated with reduced FC in IFOF-connected DMN areas, independently of global AV-45 PET. Higher AV-45 PET contributed to reduced FC in IFOF-connected, temporal, and parietal DMN areas.

Conclusions: High fiber tract WMH burden is associated with reduced FC in connected areas, thus adding to the effects of amyloid pathology on neuronal network function.

Keywords: Alzheimer's disease; Amyloid-beta; Fiber tract; Functional connectivity; Resting-state fMRI; Vascular; White matter hyperintensities.


Figures

Fig. 1
Fig. 1
Schema of successive steps involved in generating the default mode network (DMN) regions of interest (ROI) connected by a tract (here, the cingulum) and the WMH located in that tract. A three-dimensional rendering of the location of the cingulum (red) and the DMN (blue) is shown (A, left panel), where after different processing steps, the final cingulum-connected ROI of the DMN (green) and the WMH (yellow) located in that fiber tract ROI are yielded (A, right panel). (B–E) Illustrate the different processing steps to produce those final ROIs. In the first step, the DMN mask (blue) obtained from a previously published DMN template and the fiber tract mask (red) obtained from the probabilistic JHU fiber tract atlas are fused in MNI space (B). Next, the fiber tract was dilated by 6 mm (meshed red) to determine the area of spatial overlap between the tract and the DMN mask (green, [C]). The green area was dilated in another iteration by 6 mm within the boundaries of the DMN, thus yielding a larger projection area of the fiber tract within the DMN (white arrows pointing to extended green area outside the red meshed sphere, D). This was done to ensure sufficient coverage of the DMN for a representative sampling of DMN FC values within the projection area of the tract. Finally, the spatially normalized WMH map (yellow) was superimposed onto the fiber tract, and the WMH volume within the fiber tract was calculated (E).
Fig. 2
Fig. 2
Major fiber tracts (red) and connected cortical regions of interest (green) of the DMN. The DMN mask was based on the a priori DMN map published by Smith et al. as shown in axial view in the upper row. Abbreviations: AG, angular gyrus; L, left; MFC, medial frontal cortex; MTG, middle temporal gyrus; PCC, posterior cingulate cortex; R, right.
Fig. 3
Fig. 3
Regression plots showing functional connectivity in the inferior fronto-occipital fasciculus (IFOF)–connected regions of interest of the DMN as a function of WMHr in the IFOF. The regression lines for each group (colored) and the whole sample (solid black line) and the standard error of the estimate (shaded area) are shown. Higher WMHr in the IFOF was associated with lower FC in the gray matter projection area of the IFOF. Statistical outliers (>3 standard deviation from group mean) have been removed for purposes of the current graph (robust regression model accounted for outliers in the regression analysis). Abbreviation: WMHr, ratio between the WMH volume and total white matter.
Fig. 4
Fig. 4
The box-whisker plot of WMHr in each selected fiber tract region of interest. Statistical outliers are shown as circles. The IFOF showed a significantly higher WMHr compared with each of the other fiber tract regions of interest. Abbreviations: IFOF, inferior fronto-occipital fasciculus; WMHr, ratio between the WMH volume and total white matter.
Fig. 5
Fig. 5
Lesion probability map of WMH including the voxel-wise mapping of the proportion of subjects showing a WMH in a particular voxel. The proportion of WMH occurrence is color-coded in each voxel, with low values shown in green–blue colors and high values in red colors.
Fig. 6
Fig. 6
Regression plots showing functional connectivity (FC) in gray matter ROIs as a function of levels of gAV-45 PET. The regression lines for each group (colored) and the whole sample (solid black line) and the standard error of the estimate (shaded area) are shown. Higher global AV-45 PET was associated with lower FC in the gray matter regions of interest connected by the IFOF (A) and hippocampus–cingulum tract (B). Statistical outliers (>3 standard deviation from group mean) have been removed for purposes of the current graph (robust regression model accounted for outliers in the statistical analysis). Abbreviation: IFOF, inferior fronto-occipital fasciculus.

Similar articles

Cited by

References

    1. Debette S., Markus H.S. The clinical importance of white matter hyperintensities on brain magnetic resonance imaging: systematic review and meta-analysis. BMJ. 2010;341:c3666. - PMC - PubMed
    1. Marchant N.L., Reed B.R., DeCarli C.S., Madison C.M., Weiner M.W., Chui H.C. Cerebrovascular disease, beta-amyloid, and cognition in aging. Neurobiol Aging. 2012;33:e25–e36. - PMC - PubMed
    1. Kochunov P., Ramage A.E., Lancaster J.L., Robin D.A., Narayana S., Coyle T. Loss of cerebral white matter structural integrity tracks the gray matter metabolic decline in normal aging. Neuroimage. 2009;45:17–28. - PMC - PubMed
    1. Lo R.Y., Jagust W.J., Alzheimer's Disease Neuroimaging Initiative Vascular burden and Alzheimer disease pathologic progression. Neurology. 2012;79:1349–1355. - PMC - PubMed
    1. Reed B.R., Eberling J.L., Mungas D., Weiner M., Kramer J.H., Jagust W.J. Effects of white matter lesions and lacunes on cortical function. Arch Neurol. 2004;61:1545–1550. - PubMed