SHORT-ROOT Deficiency Alleviates the Cell Death Phenotype of the Arabidopsis catalase2 Mutant under Photorespiration-Promoting Conditions
- PMID: 27432873
- PMCID: PMC5006698
- DOI: 10.1105/tpc.16.00038
SHORT-ROOT Deficiency Alleviates the Cell Death Phenotype of the Arabidopsis catalase2 Mutant under Photorespiration-Promoting Conditions
Erratum in
-
CORRECTION.Plant Cell. 2020 Jan;32(1):285. doi: 10.1105/tpc.19.00811. Epub 2019 Nov 6. Plant Cell. 2020. PMID: 31694873 Free PMC article. No abstract available.
Abstract
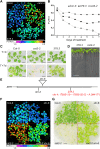
Hydrogen peroxide (H2O2) can act as a signaling molecule that influences various aspects of plant growth and development, including stress signaling and cell death. To analyze molecular mechanisms that regulate the response to increased H2O2 levels in plant cells, we focused on the photorespiration-dependent peroxisomal H2O2 production in Arabidopsis thaliana mutants lacking CATALASE2 (CAT2) activity (cat2-2). By screening for second-site mutations that attenuate the PSII maximum efficiency (Fv'/Fm') decrease and lesion formation linked to the cat2-2 phenotype, we discovered that a mutation in SHORT-ROOT (SHR) rescued the cell death phenotype of cat2-2 plants under photorespiration-promoting conditions. SHR deficiency attenuated H2O2-dependent gene expression, oxidation of the glutathione pool, and ascorbate depletion in a cat2-2 genetic background upon exposure to photorespiratory stress. Decreased glycolate oxidase and catalase activities together with accumulation of glycolate further implied that SHR deficiency impacts the cellular redox homeostasis by limiting peroxisomal H2O2 production. The photorespiratory phenotype of cat2-2 mutants did not depend on the SHR functional interactor SCARECROW and the sugar signaling component ABSCISIC ACID INSENSITIVE4, despite the requirement for exogenous sucrose for cell death attenuation in cat2-2 shr-6 double mutants. Our findings reveal a link between SHR and photorespiratory H2O2 production that has implications for the integration of developmental and stress responses.
© 2016 American Society of Plant Biologists. All rights reserved.
Figures


Similar articles
-
Conditional oxidative stress responses in the Arabidopsis photorespiratory mutant cat2 demonstrate that redox state is a key modulator of daylength-dependent gene expression, and define photoperiod as a crucial factor in the regulation of H2O2-induced cell death.Plant J. 2007 Nov;52(4):640-57. doi: 10.1111/j.1365-313X.2007.03263.x. Epub 2007 Sep 17. Plant J. 2007. PMID: 17877712
-
Functional comparison of catalase genes in the elimination of photorespiratory H2O2 using promoter- and 3'-untranslated region exchange experiments in the Arabidopsis cat2 photorespiratory mutant.Plant Cell Environ. 2010 Oct;33(10):1656-70. doi: 10.1111/j.1365-3040.2010.02171.x. Plant Cell Environ. 2010. PMID: 20492555
-
Activation of auxin signalling counteracts photorespiratory H2O2-dependent cell death.Plant Cell Environ. 2015 Feb;38(2):253-65. doi: 10.1111/pce.12250. Plant Cell Environ. 2015. PMID: 26317137
-
Measurement of Transcripts Associated with Photorespiration and Related Redox Signaling.Methods Mol Biol. 2017;1653:17-29. doi: 10.1007/978-1-4939-7225-8_2. Methods Mol Biol. 2017. PMID: 28822123 Review.
-
Metabolite modification in oxidative stress responses: A case study of two defense hormones.Free Radic Biol Med. 2023 Feb 20;196:145-155. doi: 10.1016/j.freeradbiomed.2023.01.007. Epub 2023 Jan 10. Free Radic Biol Med. 2023. PMID: 36634883 Review.
Cited by
-
Lack of GLYCOLATE OXIDASE1, but Not GLYCOLATE OXIDASE2, Attenuates the Photorespiratory Phenotype of CATALASE2-Deficient Arabidopsis.Plant Physiol. 2016 Jul;171(3):1704-19. doi: 10.1104/pp.16.00359. Epub 2016 May 25. Plant Physiol. 2016. PMID: 27225899 Free PMC article.
-
Two glyoxylate reductase isoforms are functionally redundant but required under high photorespiration conditions in rice.BMC Plant Biol. 2020 Jul 29;20(1):357. doi: 10.1186/s12870-020-02568-0. BMC Plant Biol. 2020. PMID: 32727356 Free PMC article.
-
Investigations on the phytotoxicity of perfluorooctanoic acid in Arabidopsis thaliana.Environ Sci Pollut Res Int. 2020 Jan;27(1):1131-1143. doi: 10.1007/s11356-019-07018-5. Epub 2019 Dec 9. Environ Sci Pollut Res Int. 2020. PMID: 31820230
-
Arabidopsis glutamate:glyoxylate aminotransferase 1 (Ler) mutants generated by CRISPR/Cas9 and their characteristics.Transgenic Res. 2018 Feb;27(1):61-74. doi: 10.1007/s11248-017-0052-z. Epub 2018 Feb 1. Transgenic Res. 2018. PMID: 29392632
-
Exposure to High-Intensity Light Systemically Induces Micro-Transcriptomic Changes in Arabidopsis thaliana Roots.Int J Mol Sci. 2019 Oct 16;20(20):5131. doi: 10.3390/ijms20205131. Int J Mol Sci. 2019. PMID: 31623174 Free PMC article.
References
-
- Baena-González E., Rolland F., Thevelein J.M., Sheen J. (2007). A central integrator of transcription networks in plant stress and energy signalling. Nature 448: 938–942. - PubMed
-
- Benfey P.N., Linstead P.J., Roberts K., Schiefelbein J.W., Hauser M.T., Aeschbacher R.A. (1993). Root development in Arabidopsis: four mutants with dramatically altered root morphogenesis. Development 119: 57–70. - PubMed
-
- Benjamini Y., Hochberg Y. (1995). Controlling the false discovery rate: a practical and powerful approach to multiple testing. J. R. Stat. Soc. Ser. B Stat. Methodol. 57: 289–300.
-
- Bienert G.P., Møller A.L.B., Kristiansen K.A., Schulz A., Møller I.M., Schjoerring J.K., Jahn T.P. (2007). Specific aquaporins facilitate the diffusion of hydrogen peroxide across membranes. J. Biol. Chem. 282: 1183–1192. - PubMed
-
- Chaouch S., Queval G., Vanderauwera S., Mhamdi A., Vandorpe M., Langlois-Meurinne M., Van Breusegem F., Saindrenan P., Noctor G. (2010). Peroxisomal hydrogen peroxide is coupled to biotic defense responses by ISOCHORISMATE SYNTHASE1 in a daylength-related manner. Plant Physiol. 153: 1692–1705. - PMC - PubMed
Publication types
MeSH terms
Substances
LinkOut - more resources
Full Text Sources
Other Literature Sources
Molecular Biology Databases

