. 2016 Sep 2;291(36):19031-41.
doi: 10.1074/jbc.M116.742262. Epub 2016 Jul 18.

An Oral Load of [13C3]Glycerol and Blood NMR Analysis Detect Fatty Acid Esterification, Pentose Phosphate Pathway, and Glycerol Metabolism through the Tricarboxylic Acid Cycle in Human Liver

Affiliations

An Oral Load of [13C3]Glycerol and Blood NMR Analysis Detect Fatty Acid Esterification, Pentose Phosphate Pathway, and Glycerol Metabolism through the Tricarboxylic Acid Cycle in Human Liver

Eunsook S Jin et al. J Biol Chem. .

Abstract

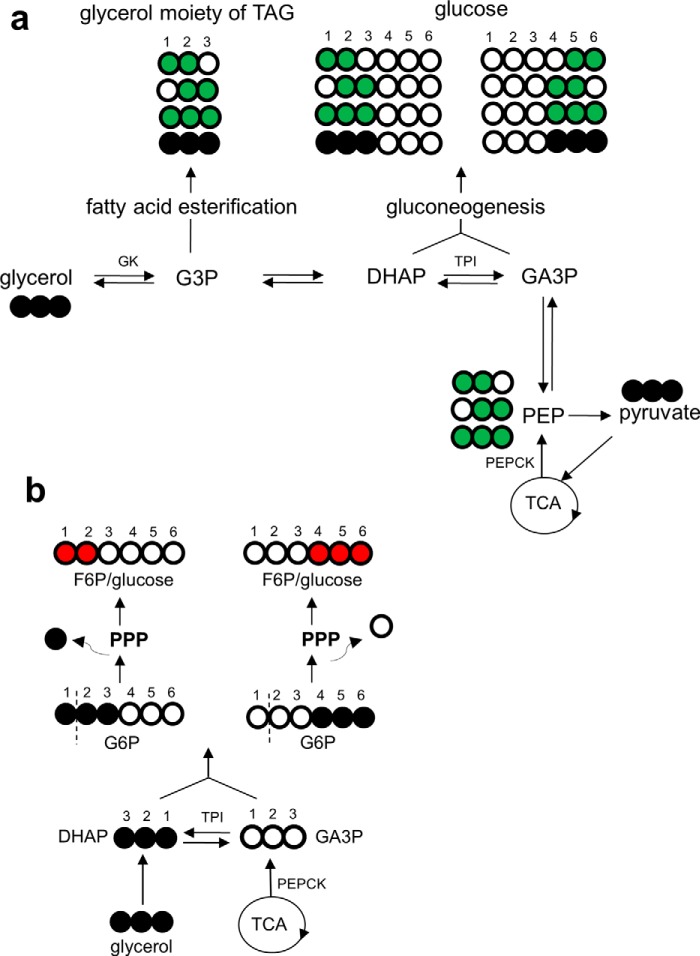
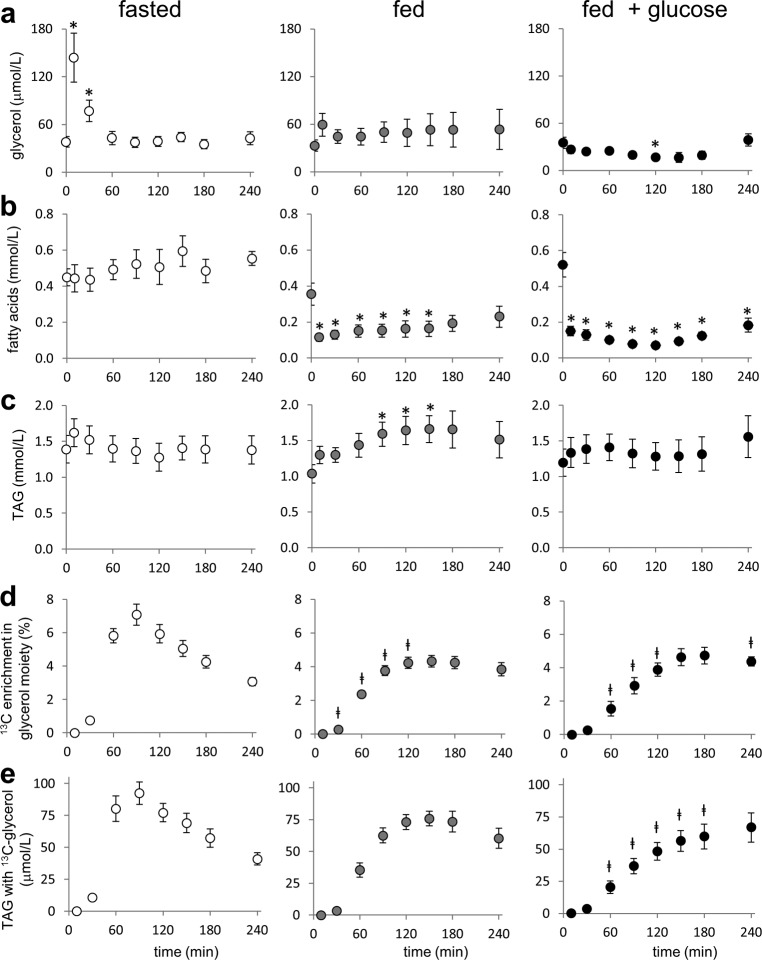
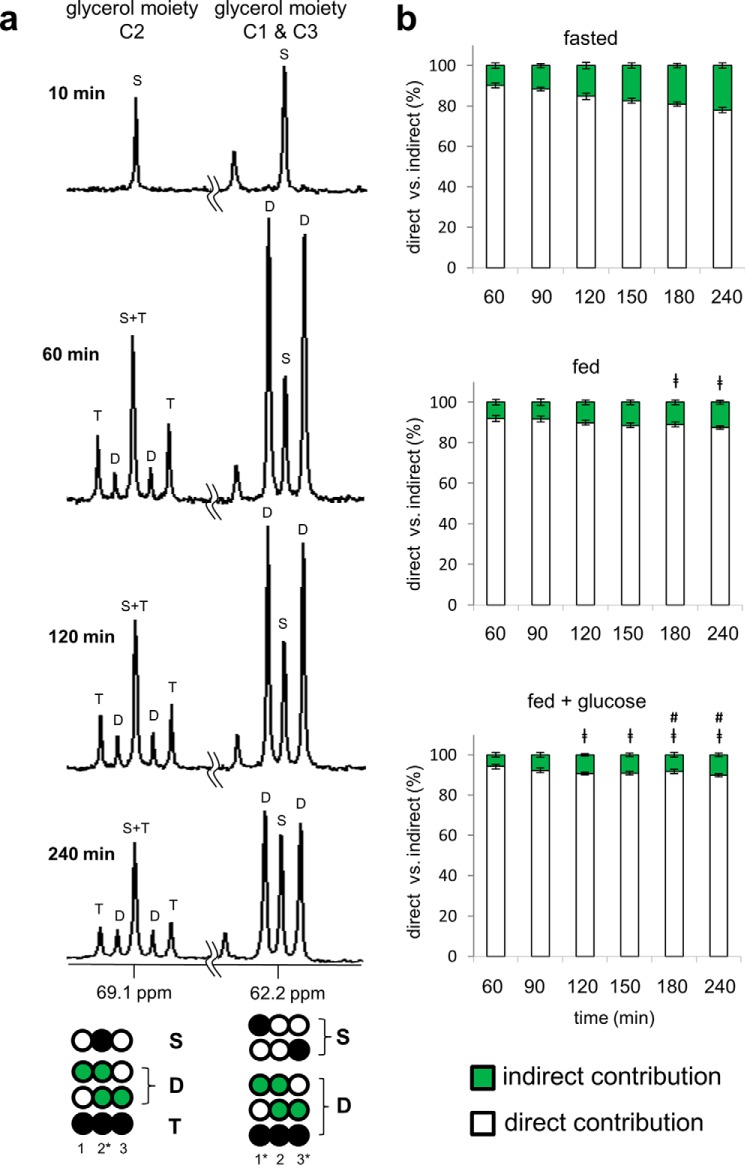
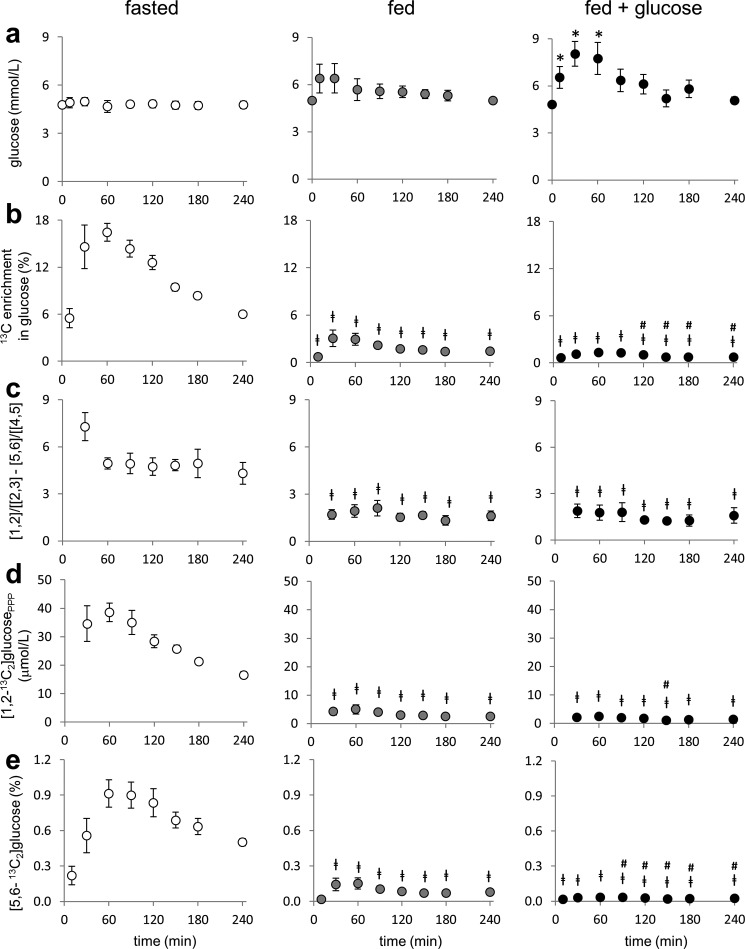
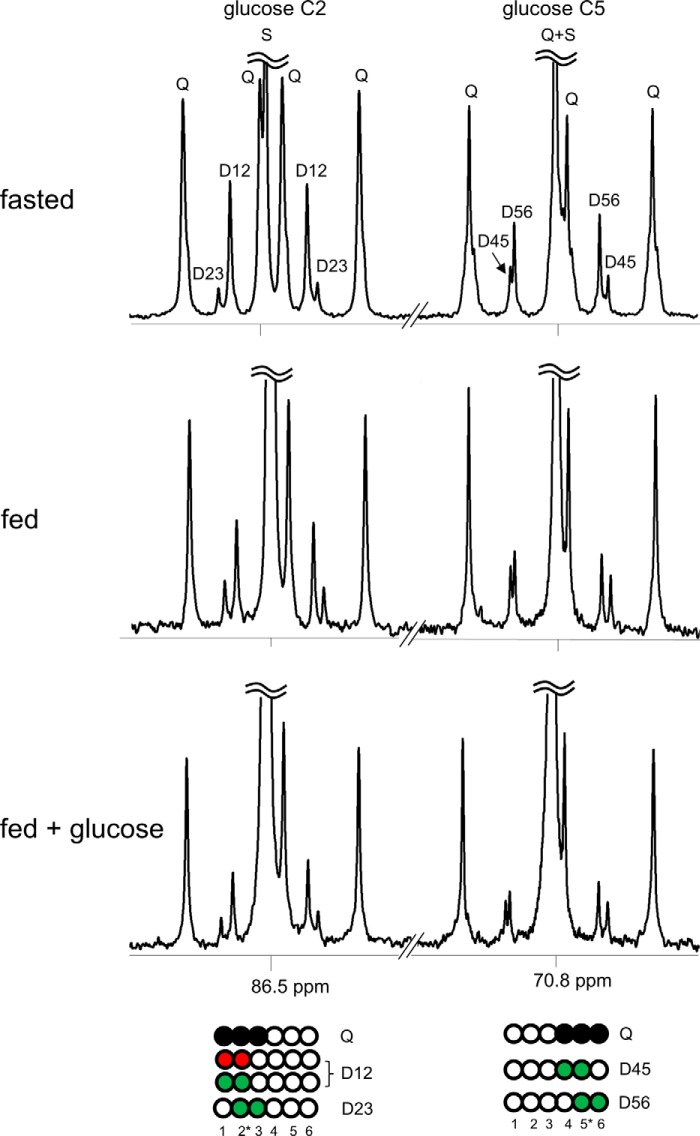
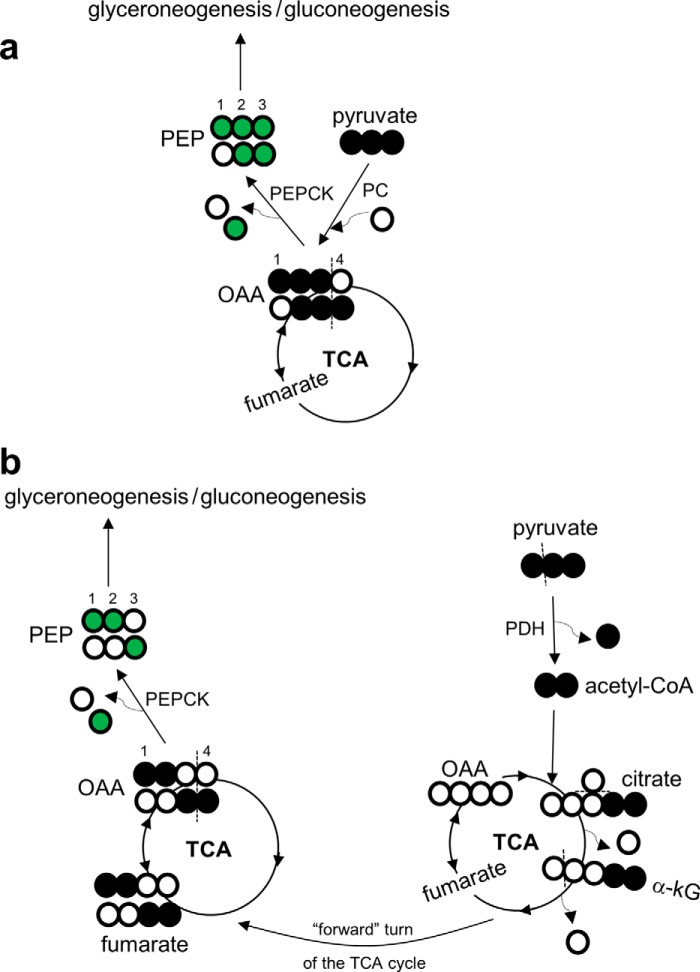
Drugs and other interventions for high impact hepatic diseases often target biochemical pathways such as gluconeogenesis, lipogenesis, or the metabolic response to oxidative stress. However, traditional liver function tests do not provide quantitative data about these pathways. In this study, we developed a simple method to evaluate these processes by NMR analysis of plasma metabolites. Healthy subjects ingested [U-(13)C3]glycerol, and blood was drawn at multiple times. Each subject completed three visits under differing nutritional states. High resolution (13)C NMR spectra of plasma triacylglycerols and glucose provided new insights into a number of hepatic processes including fatty acid esterification, the pentose phosphate pathway, and gluconeogenesis through the tricarboxylic acid cycle. Fasting stimulated pentose phosphate pathway activity and metabolism of [U-(13)C3]glycerol in the tricarboxylic acid cycle prior to gluconeogenesis or glyceroneogenesis. Fatty acid esterification was transient in the fasted state but continuous under fed conditions. We conclude that a simple NMR analysis of blood metabolites provides an important biomarker of pentose phosphate pathway activity, triacylglycerol synthesis, and flux through anaplerotic pathways in mitochondria of human liver.

Keywords: anaplerosis; biomarker; gluconeogenesis; glycerol; liver metabolism; mitochondria; pentose phosphate pathway (PPP); tricarboxylic acid cycle (TCA cycle) (Krebs cycle); triglyceride.


Figures

FIGURE 1.
FIGURE 1.
13C labeling patterns in TAGs and glucose produced in liver after oral [U-13C3]glycerol. a, [U-13C3]glycerol may be used immediately as backbones for fatty acid esterification or in gluconeogenesis after phosphorylation (“direct” contribution). A fraction of [U-13C3]glycerol may be further converted to other trioses and [U-13C3]pyruvate entering the TCA cycle prior to glyceroneogenesis or gluconeogenesis (“indirect” contribution). The TCA cycle scrambles 13C extensively, labeling all the cycle intermediates, including oxaloacetate, that may exit the cycle producing double- or triple-labeled trioses. These trioses may be either glyceroneogenic or gluconeogenic. Because PEP is a common intermediate for DHAP (becoming glucose carbons 1–3) and GA3P (becoming glucose carbons 4–6), an equivalent 13C-labeling pattern is expected between glucose carbons 1–3 and carbons 4–6. Thus, the ratio [1,2-13C2]/[2,3-13C2] in glucose must be equal to the ratio [5,6-13C2]/[4,5-13C2] in glucose. b, however, PPP activity increases the ratio of [1,2-13C2]/[2,3-13C2], but not [5,6-13C2]/[4,5-13C2], by producing [1,2-13C2]hexose. Gluconeogenesis directly from [U-13C3]glycerol produces [1,2,3-13C3]- or [4,5,6-13C3]hexose. The entry of [1,2,3-13C3]glucose 6-phosphate to PPP produces mainly [1,2-13C2]fructose 6-phosphate through decarboxylation in the oxidative PPP followed by carbon rearrangement in the non-oxidative PPP. In contrast, 13C 3-unit (13C-13C-13C) in [4,5,6-13C3]hexose remains the same even after passing through the PPP. Consequently, the 13C-labeling pattern in glucose carbons 1–3 is sensitive to PPP activity, but the pattern in glucose carbons 4–6 is not. Open circles, 12C; black circles, 13C; green circles, 13C after metabolism through the TCA cycle; red circles, 13C after metabolism through the PPP. F6P, fructose 6-phosphate; G3P, glycerol 3-phosphate; G6P, glucose 6-phosphate; GK, glycerol kinase; PEPCK, PEP carboxykinase; TPI, triose phosphate isomerase.
FIGURE 2.
FIGURE 2.
Glycerol, fatty acids, TAGs, and 13C incorporation to TAGs in plasma from subjects receiving [U-13C3]glycerol. a, the concentration of free glycerol in plasma increased immediately after [U-13C3]glycerol ingestion under a fast but remained constant under fed conditions. b, the concentration of fatty acids was high under a fast but decreased by food intake. c, the concentration of TAGs was not significantly changed under a fasted state and a fed plus glucose condition but was higher at 90–150 min after [U-13C3]glycerol ingestion under a fed condition compared with the level after a fast (t = 0). d, after a fast, [U-13C3]glycerol ingestion led to rapid 13C enrichment in the glycerol moiety and reached a maximum at 90 min. Under fed conditions, the fractional enrichment increased gradually reaching a plateau at ∼150 min. e, the concentration of TAGs with excess 13C-labeled glycerol backbones (i.e. newly synthesized TAGs) was greatest at 90 min under a fast and at 150 min under a fed state but steadily increased up to 240 min under a fed plus glucose condition. In each graph, the value at the zero time point (t = 0) was from an overnight fast prior to the administration of [U-13C3]glycerol, meal, or glucose. *, p < 0.05 compared with t = 0 in each graph; , p < 0.05 compared with the corresponding time point under a fasted state (n = 5–6).
FIGURE 3.
FIGURE 3.
13C NMR spectra of the glycerol moiety of TAGs reflect direct and indirect contributions from [U-13C3]glycerol. Healthy subjects ingested [U-13C3]glycerol under differing nutritional states, and blood was drawn at multiple times. a, 13C NMR spectra of lipid extracts from a fasted subject show the resonances of the glycerol backbones of TAGs. The spectrum from 10 min shows natural abundance 13C only, but the spectra from 60, 120, and 240 min show signals from excess 13C in the glycerol backbones. In the C1 and C3 region at 62.2 ppm, the doublet (D) reflects signals from [1,2-13C2]-, [2,3-13C2]-, and [U-13C3]glycerol moieties of TAGs. In the C2 region at 69.1 ppm, the doublet (D) reflects [1,2-13C2]- and [2,3-13C2]glycerol moieties, and the triplet (T) arises exclusively from [U-13C3]glycerol moiety. The presence of double-labeled glycerol demonstrates metabolism of [U-13C3]glycerol in the TCA cycle prior to glyceroneogenesis. b, the direct versus indirect contribution from [U-13C3]glycerol was estimated based on the analysis of the glycerol moiety C2 resonance. [U-13C3]Glycerol incorporation to TAGs occurred primarily via the direct pathway under all nutritional conditions. The indirect contribution through the TCA cycle was minor but increased gradually over time and was sensitive to nutritional states. The indirect contribution was 22% after a fast, 13% under a fed condition, and 10% under a fed plus glucose condition at 240 min of the ingestion. D, doublet from coupling of C1 with C2 or from coupling of C2 with C3; T, triplet arising from coupling of C2 with both C1 and C3; S, singlet. Open circles, 12C; black circles, 13C; green circles, 13C after metabolism through the TCA cycle. , p < 0.05 compared with the corresponding time point under a fasted state; #, p < 0.05 compared with the corresponding time point under a fed state (n = 6).
FIGURE 4.
FIGURE 4.
Assessment of hepatic PPP and gluconeogenesis by analysis of plasma glucose from subjects receiving [U-13C3]glycerol. a, plasma glucose remained the same under a fast and a fed condition but increased under a fed plus glucose condition. b, 13C enrichment in glucose (reflecting gluconeogenesis from [U-13C3]glycerol) was higher under a fast condition than under a fed condition. The enrichment under a fed condition was slightly higher than a fed plus glucose condition at 120–240 min. The 13C enrichment in glucose represents the sum of all glucose isotopomers with excess 13C. c, as an index of hepatic PPP activity, the ratio difference between [1,2-13C2]/[2,3-13C2] and [5,6-13C2]/[4,5-13C2] in glucose was higher under a fast condition than under a fed condition, indicating that fasting induced the PPP activity. d, plasma [1,2-13C2]glucose produced through hepatic PPP was much higher under a fast condition than under a fed condition. e, the fraction of [5,6-13C2]glucose was greatest under a fast condition followed by a fed condition and a fed plus glucose condition. [5,6-13C2]Glucose was produced by [U-13C3]glycerol metabolism through the TCA cycle prior to gluconeogenesis. [1,2], [1,2-13C2]glucose; [2,3], [2,3-13C2]glucose, etc.; [1,2-13C2]glucosePPP, [1,2-13C2]glucose produced through the PPP. *, p < 0.05 compared with t = 0 within each graph; , p < 0.05 compared with the corresponding time point under a fasted state; #, p < 0.05 compared with the corresponding time point under a fed state (n = 4–6).
FIGURE 5.
FIGURE 5.
13C NMR spectra of plasma glucose reflect hepatic gluconeogenesis and PPP activity. A subject ingested [U-13C3]glycerol under differing nutritional states, and blood was drawn at multiple times. Glucose was derivatized for 13C NMR acquisition, and the spectra are from blood drawn at 180 min after [U-13C3]glycerol ingestion. Gluconeogenesis directly from [U-13C3]glycerol produced [1,2,3-13C3]- and [4,5,6-13C3]glucose. [U-13C3]Glycerol metabolism through the TCA cycle prior to gluconeogenesis produced double-labeled glucose ([1,2-13C2], [2,3-13C2], [5,6-13C2], and [4,5-13C2]). Hepatic PPP activity produced additional [1,2-13C2]glucose, which was greatest under a fast. The ratio difference between D12/D23 versus D56/D45 (i.e. [1,2-13C2]/[2,3-13C2] versus [5,6-13C2]/[4,5-13C2] in glucose) reflects hepatic PPP activity, which was sensitive to nutritional states. D12, doublet from coupling of C1 with C2; D23, doublet from coupling of C2 with C3; Q, doublet of doublets, or quartet, arising from coupling of C2 with both C1 and C3 or from coupling of C5 with both C4 and C6; D45, doublet from coupling of C4 with C5; D56, doublet from coupling of C5 with C6; S, singlet. Open circles, 12C; black circles, 13C; green circles, 13C after metabolism through the TCA cycle; red circles, 13C after metabolism through the PPP.
FIGURE 6.
FIGURE 6.
Double-labeled trioses produced through the metabolism of [U-13C3]glycerol in the TCA cycle. After phosphorylation, [U-13C3]glycerol may be further metabolized to [U-13C3]pyruvate entering the TCA cycle. a, the entry of [U-13C3]pyruvate through pyruvate carboxylase produces [1,2,3-13C3]oxaloacetate, which equilibrates with the symmetric fumarate pool, producing both [1,2,3-13C3]- and [2,3,4-13C3]oxaloacetate. These oxaloacetate isotopomers may exit the TCA cycle through PEP carboxykinase generating [U-13C3]PEP and [2,3-13C2]PEP. b, the entry of [U-13C3]pyruvate through pyruvate dehydrogenase generates [U-13C2]acetyl-CoA. The condensation of [U-13C2]acetyl-CoA and oxaloacetate produces [4,5-13C2]citrate and [4,5-13C2]α-ketoglutarate. After decarboxylation and experiencing a symmetric fumarate pool, [1,2,-13C2]- and [3,4-13C2]oxaloacetate are produced. These isotopomers become [1,2-13C2]PEP and [3-13C1]PEP through PEP carboxykinase. Open circle, 12C; black circle, 13C; green circle, 13C after metabolism through the TCA cycle. kG, ketoglutarate; OAA, oxaloacetate; PC, pyruvate carboxylase; PDH, pyruvate dehydrogenase; PEPCK, phosphoenolpyruvate carboxykinase.

Similar articles

Cited by

References

    1. Li S., Tan H. Y., Wang N., Zhang Z. J., Lao L., Wong C. W., and Feng Y. (2015) The role of oxidative stress and antioxidants in liver diseases. Int. J. Mol. Sci. 16, 26087–26124 - PMC - PubMed
    1. Takahashi Y., Sugimoto K., Inui H., and Fukusato T. (2015) Current pharmacological therapies for nonalcoholic fatty liver disease/nonalcoholic steatohepatitis. World J. Gastroenterol. 21, 3777–3785 - PMC - PubMed
    1. Neuschwander-Tetri B. A., Loomba R., Sanyal A. J., Lavine J. E., Van Natta M. L., Abdelmalek M. F., Chalasani N., Dasarathy S., Diehl A. M., Hameed B., Kowdley K. V., McCullough A., Terrault N., Clark J. M., Tonascia J., Brunt E. M., Kleiner D. E., Doo E, and NASH Clinical Research Network (2015) Farnesoid X nuclear receptor ligand obeticholic acid for non-cirrhotic, non-alcoholic steatohepatitis (FLINT): a multicentre, randomised, placebo-controlled trial. Lancet 385, 956–965 - PMC - PubMed
    1. Federico A., Zulli C., de Sio I., Del Prete A., Dallio M., and Masarone M., and Loguercio C. (2014) Focus on emerging drugs for the treatment of patients with non-alcoholic fatty liver disease. World J. Gastroenterol. 20, 16841–16857 - PMC - PubMed
    1. Pawlyk A. C., Giacomini K. M., McKeon C., Shuldiner A. R., and Florez J. C. (2014) Metformin pharmacogenomics: current status and future directions. Diabetes 63, 2590–2599 - PMC - PubMed

Publication types

LinkOut - more resources