

Amphiregulin Confers Regulatory T Cell Suppressive Function and Tumor Invasion via the EGFR/GSK-3β/Foxp3 Axis
- PMID: 27432879
- PMCID: PMC5076518
- DOI: 10.1074/jbc.M116.717892
Amphiregulin Confers Regulatory T Cell Suppressive Function and Tumor Invasion via the EGFR/GSK-3β/Foxp3 Axis
Abstract
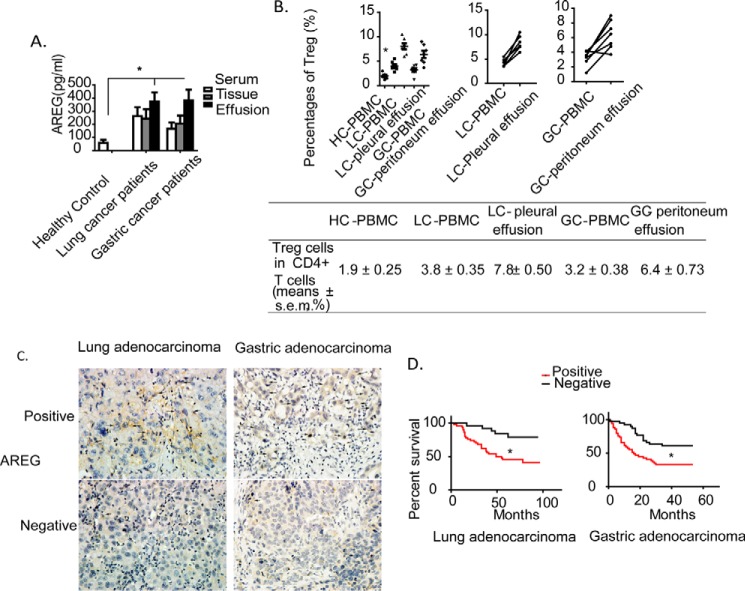
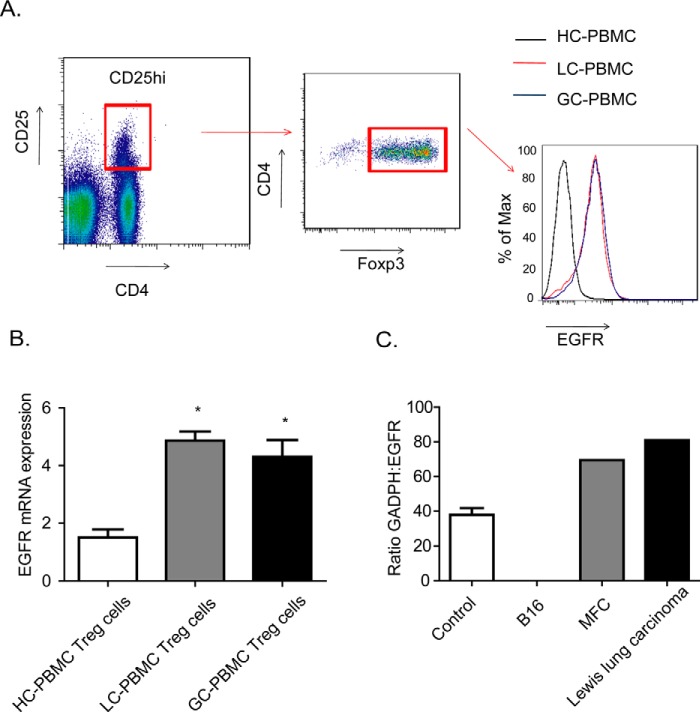
Previous studies mainly focused on the role of the epidermal growth factor receptor (EGFR) in tumor cells, whereas the effects of the EGFR on immune responses has not been determined. Our study shows that the EGFR signaling pathway play a role in the regulation of regulatory T cells (Treg cells) in cancer patients. The EGF-like growth factor Amphiregulin (AREG) protein was frequently up-regulated in a tissue microarray, which was associated with worse overall survival. Additionally, in sera, tissue specimens, and effusions of lung or gastric cancer patients, up-regulated AREG protein enhanced the suppressive function of Treg cells. AREG maintained the Treg cell suppressive function via the EGFR/GSK-3β/Foxp3 axis in vitro and in vivo Furthermore, inhibition of EGFR by the tyrosine kinase inhibitor gefitinib restored the activity of GSK-3β and attenuated Treg cell function. β-TrCP was involved in GSK-3β-mediated Foxp3 degradation, and mass spectrometry identified Lys356 as the ubiquitination site of Foxp3 by β-TrCP. These findings demonstrate the posttranslational regulation of Foxp3 expression by AREG in cancer patients through AREG/EGFR/GSK-3β signaling, which could lead to Foxp3 protein degradation in Treg cells and a potential therapeutic target for cancer treatment.
Keywords: GSK-3β; epidermal growth factor receptor (EGFR); forkhead box P3 (FOXP3); glycogen synthase kinase 3 (GSK-3); lung adenocarcinoma; phosphorylation; protein degradation; protein phosphorylation; regulatory T cells; ubiquitylation (ubiquitination).
© 2016 by The American Society for Biochemistry and Molecular Biology, Inc.
Figures


Similar articles
-
Amphiregulin enhances regulatory T cell-suppressive function via the epidermal growth factor receptor.Immunity. 2013 Feb 21;38(2):275-84. doi: 10.1016/j.immuni.2012.09.023. Epub 2013 Jan 17. Immunity. 2013. PMID: 23333074 Free PMC article.
-
Brain Foxp3+ regulatory T cells can be expanded by Interleukin-33 in mouse ischemic stroke.Int Immunopharmacol. 2020 Apr;81:106027. doi: 10.1016/j.intimp.2019.106027. Epub 2019 Nov 29. Int Immunopharmacol. 2020. PMID: 31791672
-
Amphiregulin promotes activated regulatory T cell-suppressive function via the AREG/EGFR pathway in laryngeal squamous cell carcinoma.Head Face Med. 2024 Oct 26;20(1):62. doi: 10.1186/s13005-024-00466-6. Head Face Med. 2024. PMID: 39456084 Free PMC article.
-
Glycogen synthase kinase 3β in tumorigenesis and oncotherapy (Review).Oncol Rep. 2020 Dec;44(6):2373-2385. doi: 10.3892/or.2020.7817. Epub 2020 Oct 20. Oncol Rep. 2020. PMID: 33125126 Free PMC article. Review.
-
An update of the mechanisms of resistance to EGFR-tyrosine kinase inhibitors in breast cancer: Gefitinib (Iressa) -induced changes in the expression and nucleo-cytoplasmic trafficking of HER-ligands (Review).Int J Mol Med. 2007 Jul;20(1):3-10. Int J Mol Med. 2007. PMID: 17549382 Review.
Cited by
-
Application of immune checkpoint inhibitors in EGFR-mutant non-small-cell lung cancer: from bed to bench.Ther Adv Med Oncol. 2020 Jun 9;12:1758835920930333. doi: 10.1177/1758835920930333. eCollection 2020. Ther Adv Med Oncol. 2020. PMID: 32565926 Free PMC article. Review.
-
Anti-PD-L1 and anti-CD73 combination therapy promotes T cell response to EGFR-mutated NSCLC.JCI Insight. 2022 Feb 8;7(3):e142843. doi: 10.1172/jci.insight.142843. JCI Insight. 2022. PMID: 35132961 Free PMC article.
-
Lupus susceptibility gene Esrrg modulates regulatory T cells through mitochondrial metabolism.JCI Insight. 2021 Jul 22;6(14):e143540. doi: 10.1172/jci.insight.143540. JCI Insight. 2021. PMID: 34156979 Free PMC article.
-
[Immunotherapy for Lung Cancer: Mechanisms of Resistance and Response Strategy].Zhongguo Fei Ai Za Zhi. 2021 Feb 20;24(2):112-123. doi: 10.3779/j.issn.1009-3419.2021.101.02. Zhongguo Fei Ai Za Zhi. 2021. PMID: 33626853 Free PMC article. Review. Chinese.
-
Bridging Chronic Inflammation and Digestive Cancer: The Critical Role of Innate Lymphoid Cells in Tumor Microenvironments.Int J Biol Sci. 2024 Sep 9;20(12):4799-4818. doi: 10.7150/ijbs.96338. eCollection 2024. Int J Biol Sci. 2024. PMID: 39309440 Free PMC article. Review.
References
-
- Ciardiello F., and Tortora G. (2008) EGFR antagonists in cancer treatment. N. Engl. J. Med. 358, 1160–1174 - PubMed
-
- Avraham R., and Yarden Y. (2011) Feedback regulation of EGFR signalling: decision making by early and delayed loops. Nat. Rev. Mol. Cell Biol. 12, 104–117 - PubMed
-
- Thienelt C. D., Bunn P. A. Jr, Hanna N., Rosenberg A., Needle M. N., Long M. E., Gustafson D. L., and Kelly K. (2005) Multicenter phase I/II study of cetuximab with paclitaxel and carboplatin in untreated patients with stage IV non-small-cell lung cancer. J. Clin. Oncol. 23, 8786–8793 - PubMed
-
- Bonner J. A., Harari P. M., Giralt J., Azarnia N., Shin D. M., Cohen R. B., Jones C. U., Sur R., Raben D., Jassem J., Ove R., Kies M. S., Baselga J., Youssoufian H., Amellal N., et al. (2006) Radiotherapy plus cetuximab for squamous-cell carcinoma of the head and neck. N. Engl. J. Med. 354, 567–578 - PubMed
-
- Cunningham D., Humblet Y., Siena S., Khayat D., Bleiberg H., Santoro A., Bets D., Mueser M., Harstrick A., Verslype C., Chau I., and Van Cutsem E. (2004) Cetuximab monotherapy and cetuximab plus irinotecan in irinotecan-refractory metastatic colorectal cancer. N. Engl. J. Med. 351, 337–345 - PubMed
MeSH terms
Substances
LinkOut - more resources
Full Text Sources
Other Literature Sources
Molecular Biology Databases
Research Materials
Miscellaneous
