. 2016 Aug;171(4):2499-515.
doi: 10.1104/pp.16.00421. Epub 2016 Jul 18.

Coordinate Regulation of Metabolite Glycosylation and Stress Hormone Biosynthesis by TT8 in Arabidopsis

Affiliations

Coordinate Regulation of Metabolite Glycosylation and Stress Hormone Biosynthesis by TT8 in Arabidopsis

Amit Rai et al. Plant Physiol. 2016 Aug.

Abstract

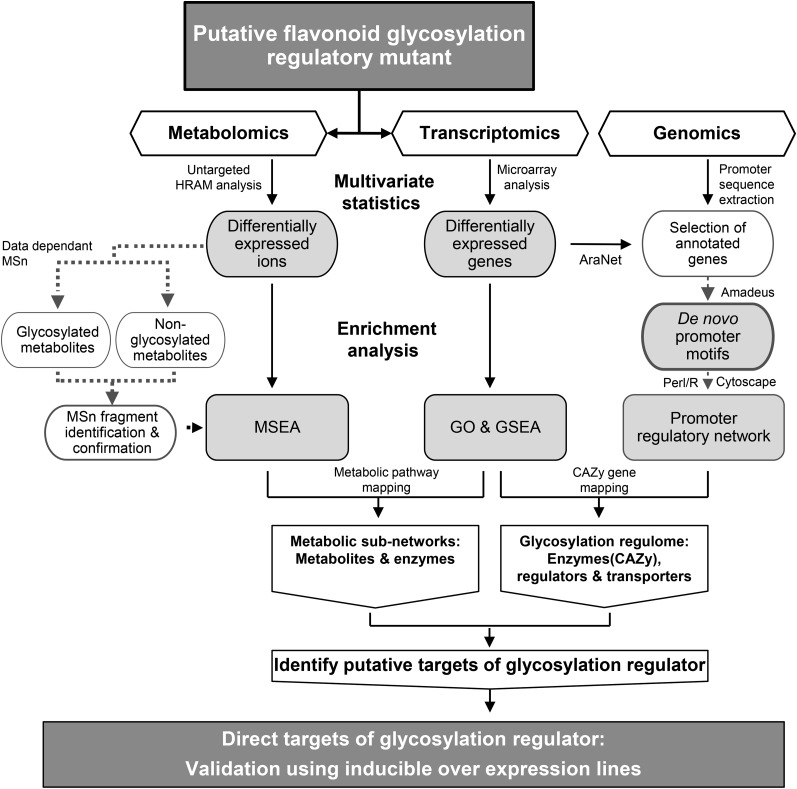
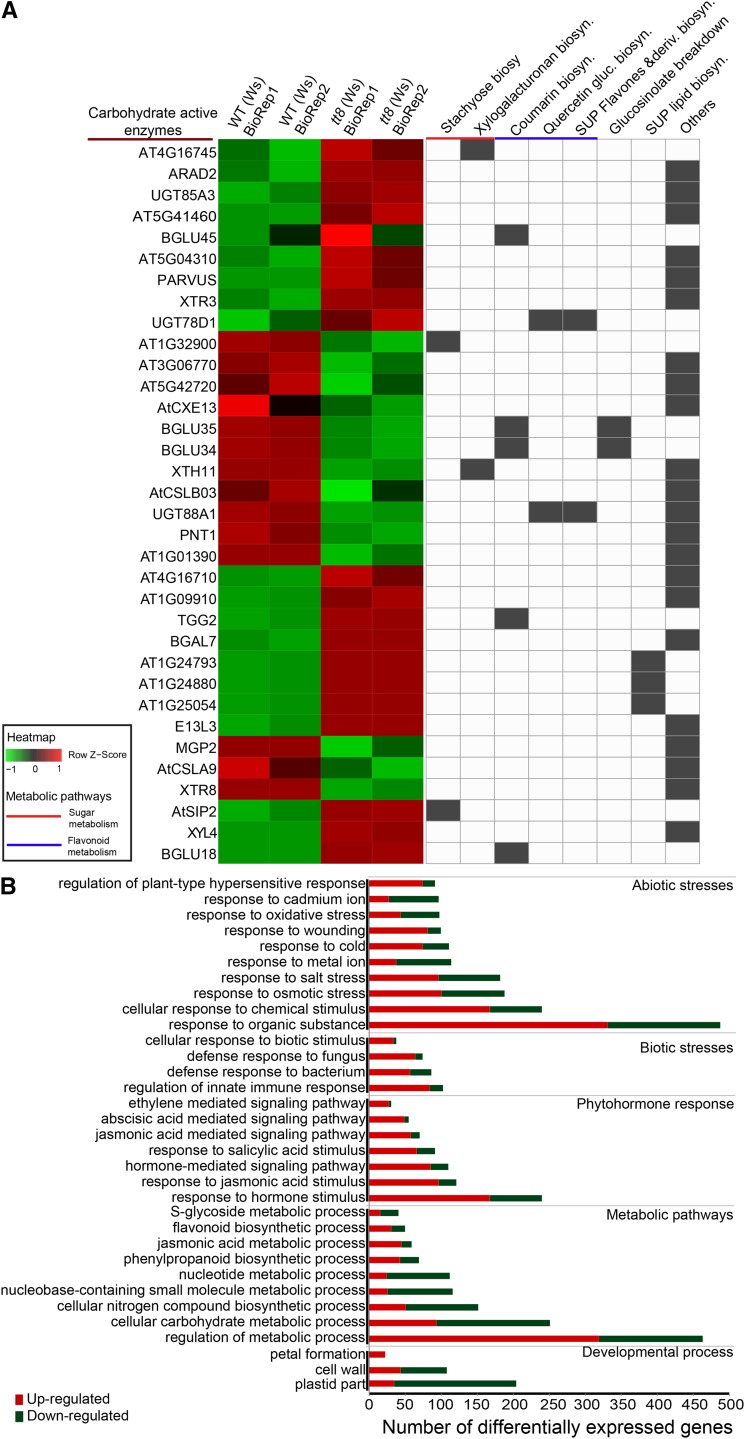
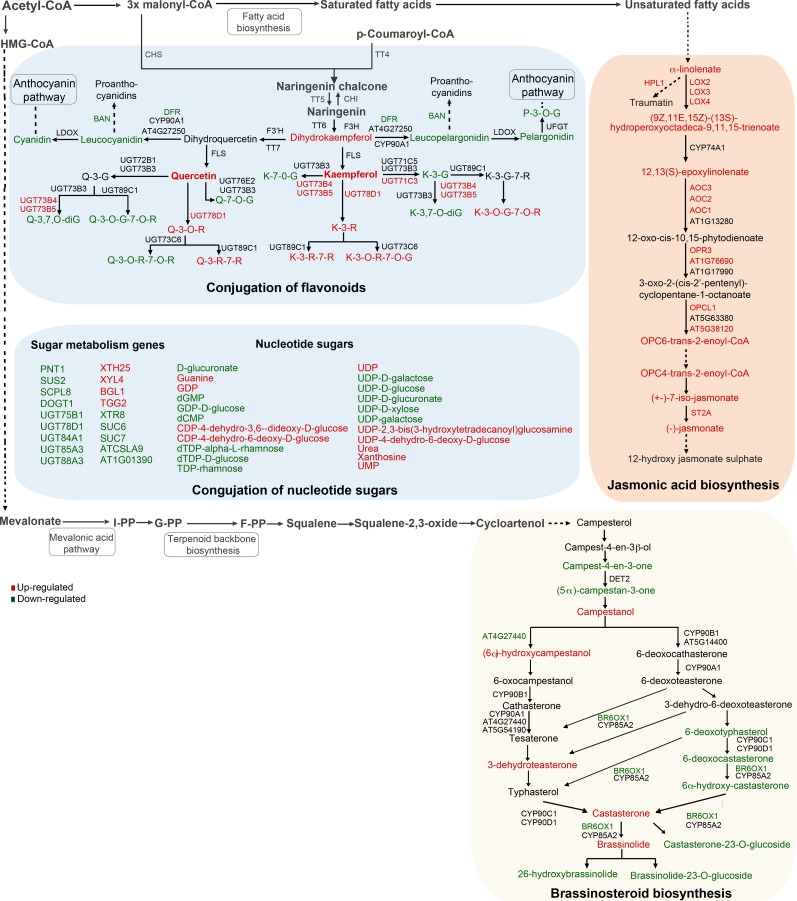
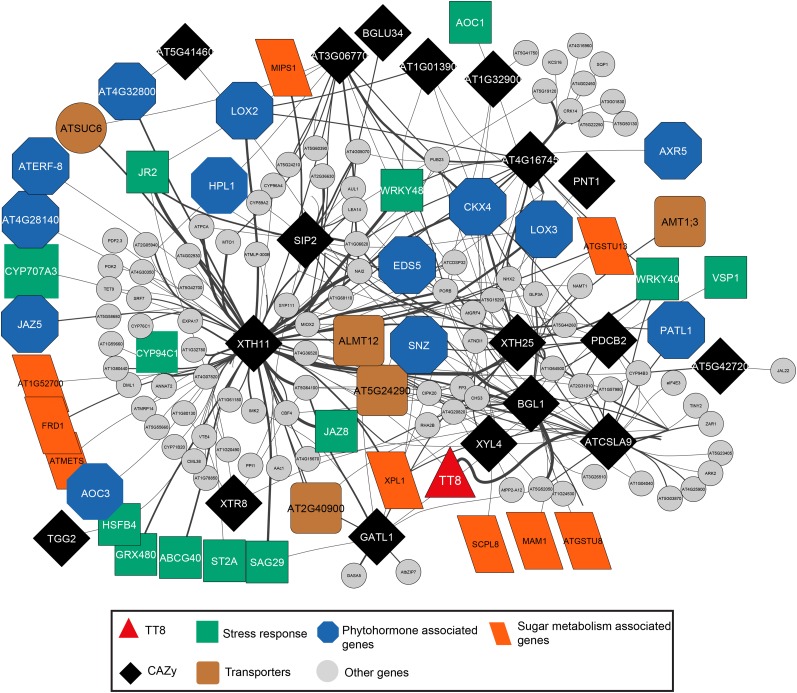
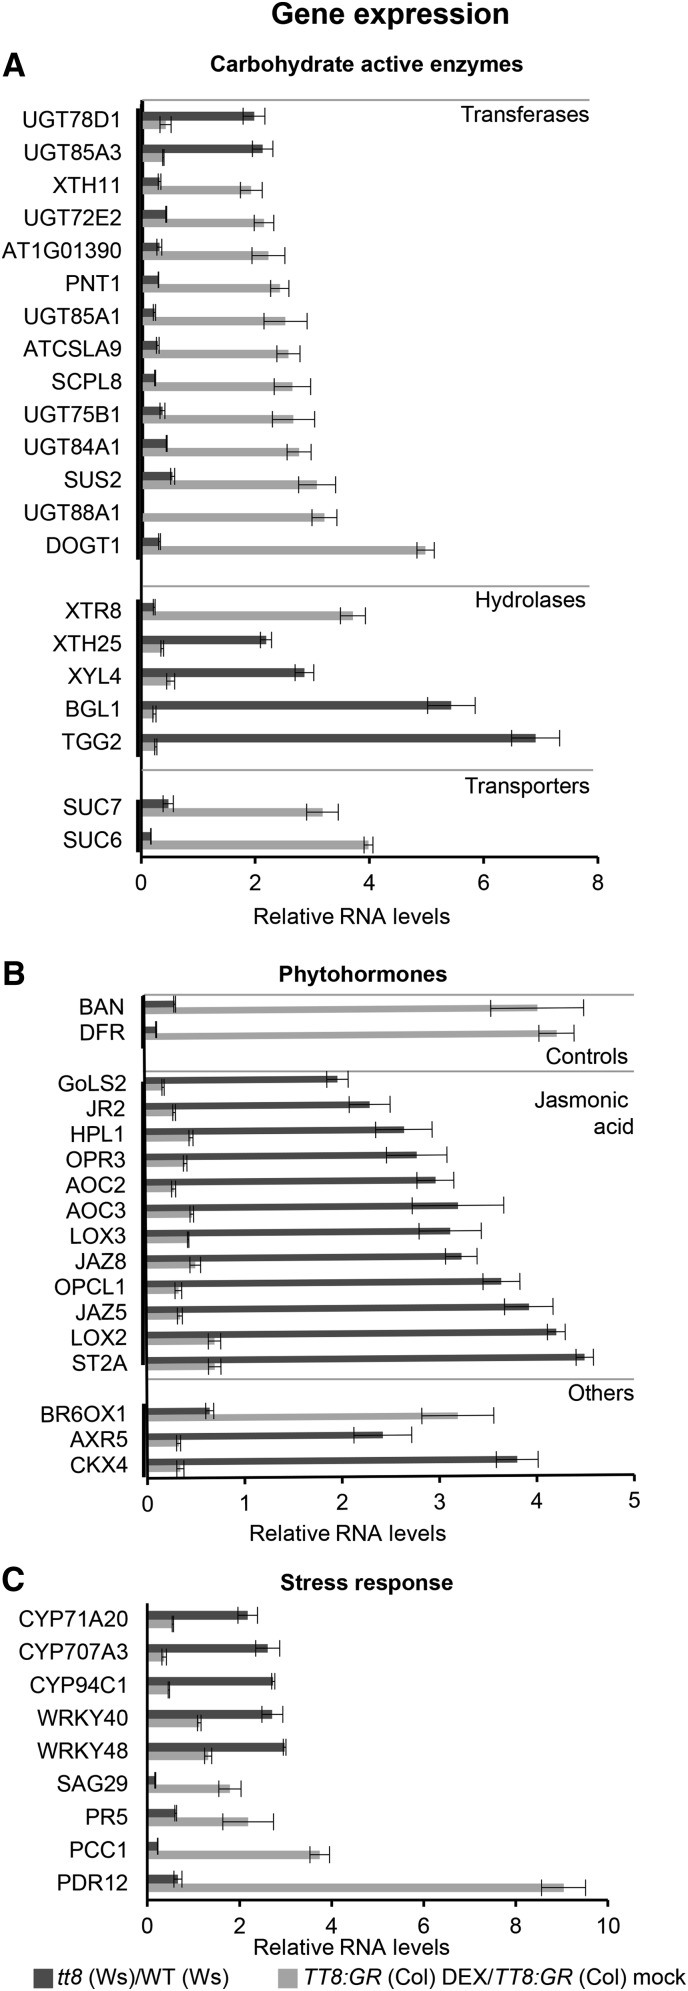
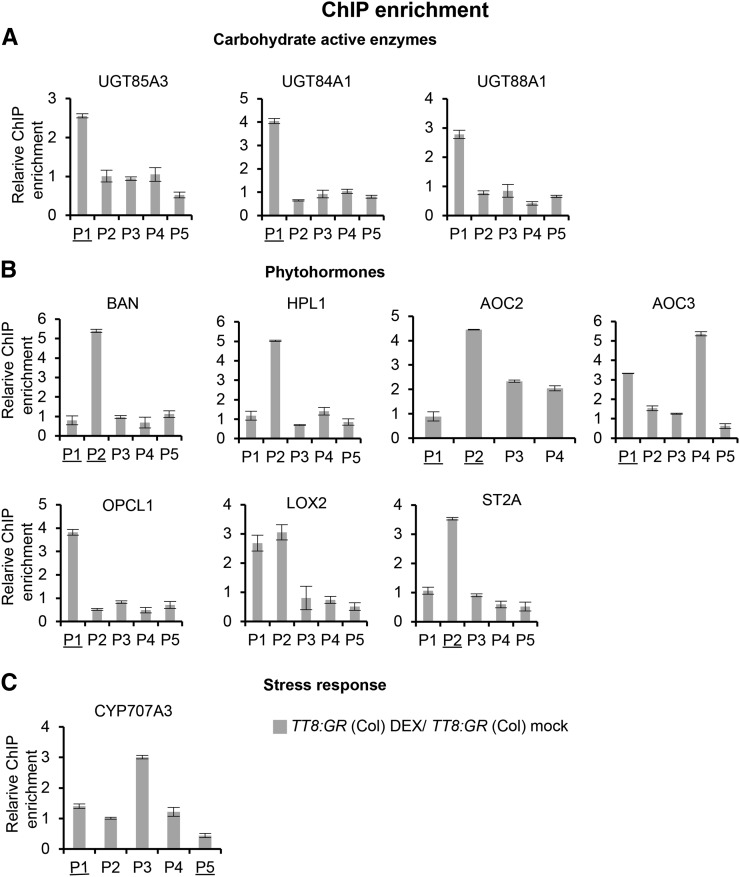
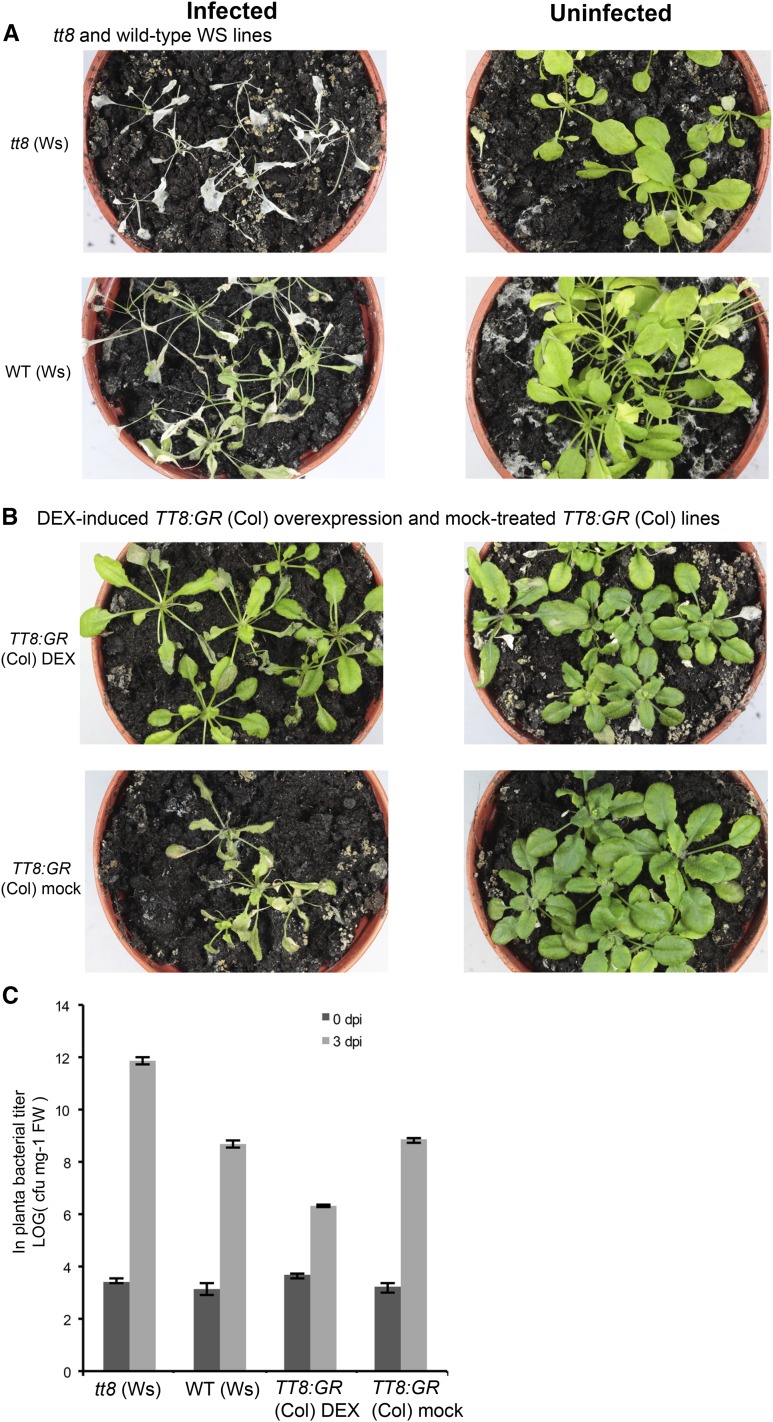
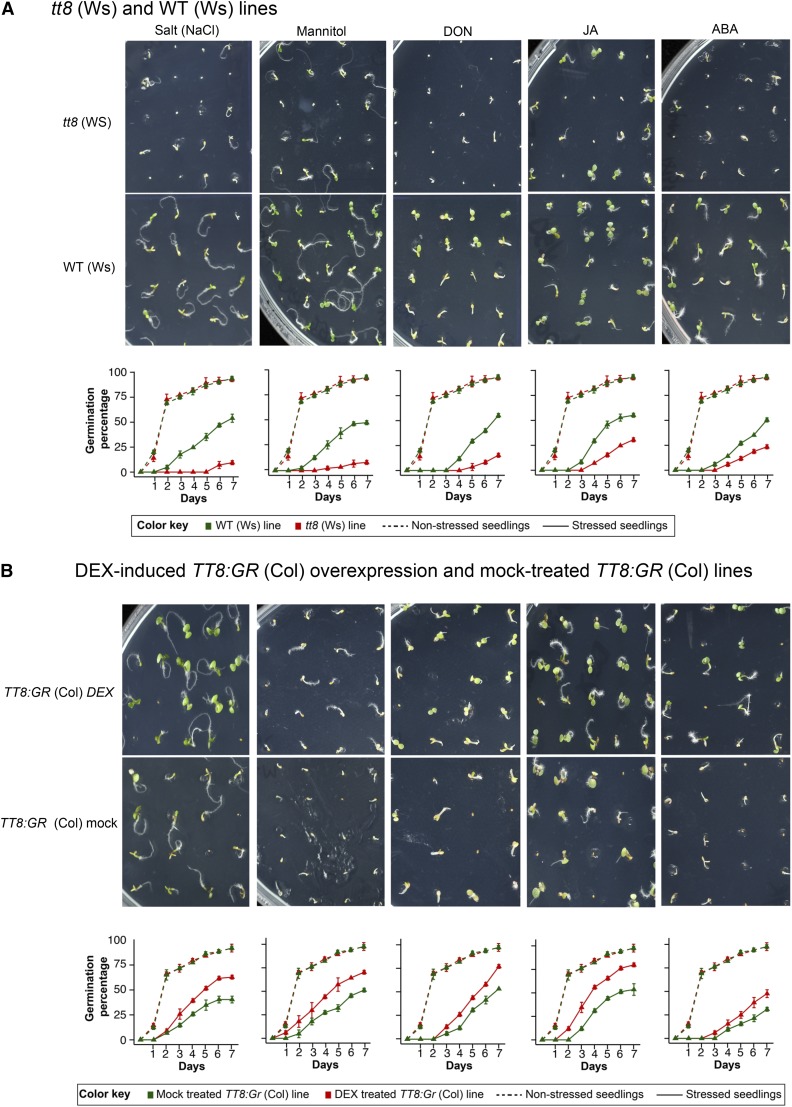
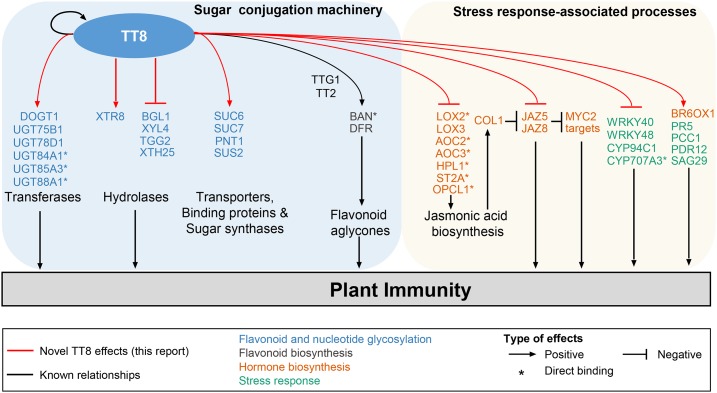
Secondary metabolites play a key role in coordinating ecology and defense strategies of plants. Diversity of these metabolites arises by conjugation of core structures with diverse chemical moieties, such as sugars in glycosylation. Active pools of phytohormones, including those involved in plant stress response, are also regulated by glycosylation. While much is known about the enzymes involved in glycosylation, we know little about their regulation or coordination with other processes. We characterized the flavonoid pathway transcription factor TRANSPARENT TESTA8 (TT8) in Arabidopsis (Arabidopsis thaliana) using an integrative omics strategy. This approach provides a systems-level understanding of the cellular machinery that is used to generate metabolite diversity by glycosylation. Metabolomics analysis of TT8 loss-of-function and inducible overexpression lines showed that TT8 coordinates glycosylation of not only flavonoids, but also nucleotides, thus implicating TT8 in regulating pools of activated nucleotide sugars. Transcriptome and promoter network analyses revealed that the TT8 regulome included sugar transporters, proteins involved in sugar binding and sequestration, and a number of carbohydrate-active enzymes. Importantly, TT8 affects stress response, along with brassinosteroid and jasmonic acid biosynthesis, by directly binding to the promoters of key genes of these processes. This combined effect on metabolite glycosylation and stress hormones by TT8 inducible overexpression led to significant increase in tolerance toward multiple abiotic and biotic stresses. Conversely, loss of TT8 leads to increased sensitivity to these stresses. Thus, the transcription factor TT8 is an integrator of secondary metabolism and stress response. These findings provide novel approaches to improve broad-spectrum stress tolerance.


Figures

Figure 1.
Figure 1.
Integrative omics strategy to identify metabolic targets and regulome of a flavonoid glycosylation regulator. Differential metabolites and transcripts were identified from untargeted metabolite and expression profiling of a putative glycosylation regulatory mutant, tt8 (Ws). Glycosylated metabolites affected in tt8 (Ws) were identified by mass fragmentation. Integration workflow consists of two stages: (1) mapping enriched metabolites and gene sets onto metabolic pathways; and (2) mapping of enriched genes onto regulatory network based on promoter motif similarity between differentially expressed genes. The metabolites and enzymes of the metabolic subnetworks obtained from the first stage are further mapped onto the glycosylation regulome from the second stage. Finally, the overlapping putative targets of the regulator are validated using inducible overexpression (in Col background) and mutant lines (in Ws background) based on their reciprocal patterns of accumulation. GO, Gene ontology; GSEA, gene set enrichment analysis; MSEA, metabolite set enrichment analysis; HRAM, high-resolution accurate mass.
Figure 2.
Figure 2.
CAZy and stress response-associated gene ontology categories enriched in tt8. A, Heatmap on the left shows relative levels of differential gene abundances classified under CAZy, with absolute fold change > 2 and FDR < 0.05, and computed as z-scores using heatmap2 function in R. Each row represents a gene and column an average of the two replicates each of tt8 (Ws) and WT (Ws) in each slide. In the matrix on the right, each column represents a pathway from AraCyc, with the presence of a gene in that pathway shown in gray. Fourteen out of 34 genes belong to sugar, flavonoid, or hormone biosynthesis. Genes not classified under these pathways were annotated as others. B, Gene set enrichment analysis was performed on 1,284 differentially expressed genes using the PlantGSEA tool. The top 33 enriched gene ontology categories (FDR < 0.05) with the number of differentially expressed genes affected in each category are shown here. Within each of the enriched gene ontology categories, the number of up- and down-regulated genes are shown in red and green, respectively.
Figure 3.
Figure 3.
TT8 loss affects flavonoid glycosylation, jasmonic acid, and brassinosteroid biosynthesis pathways. Differentially expressed metabolites and genes, with FDR < 0.05 and absolute fold change > 2, were mapped onto the top 3 enriched pathways, namely, biosynthesis of flavonoids and their conjugation, jasmonic acid, and brassinosteroids. In the conjugation of flavonoids section, the abbreviations are as follows: K, kaempferol; Q, quercetin; G, glucoside; and R, rhamnoside. Up- and down-regulated genes and metabolites are shown in red and green, respectively. Loss of TT8 leads to coordinated increase in transcript and metabolic levels of jasmonic acid pathways, whereas the other two pathways are down-regulated. TT8 loss also affected nucleotide sugar levels along with sugar metabolism enzymes, transporters, and sugar-binding proteins. Selected pathways shown here are based on AraCyc 8.0 and cross-validated with KEGG Arabidopsis metabolic maps.
Figure 4.
Figure 4.
CAZy coding genes share motif similarity with stress response and phytohormone-associated genes. Differentially expressed genes form the nodes, while the edges are based on sharing of promoter motifs. To identify relationships between sugar metabolism genes and those of other pathways in the regulome, a constraint was applied to connect nodes of sugar metabolism genes that share a minimum of 14 motifs (top 25 percentile) with other genes. This constrained regulatory network is shown here. The width of the edges corresponds to the number of shared motifs between the two nodes, with high similarity resulting in thicker edges. This glycosylation regulome consists of 18 enzymes (CAZy) connected mostly with stress response genes (13 genes) and phytohormone-associated genes (13 genes), followed by transporters (five genes) and and transferases, hydrolases, and oxidases (nine genes). Other genes in the glycosylation network but not directly annotated to any of the above functional processes are shown as gray circles.
Figure 5.
Figure 5.
Validation of TT8 glycosylation regulome members using mutant and inducible overexpression lines. From the glycosylation regulatory network, 18 CAZy with top 3 enriched processes, 13 phytohormone-associated genes, and nine stress response-associated genes showed reciprocal expression levels in tt8 (Ws) and its DEX-induced TT8:GR (Col) overexpression lines. Relative transcript levels of genes were quantified using real-time PCR normalized against tubulin2 as control. Shown are genes associated with CAZy (A), phytohormone biosynthesis (B), and stress response (C). Light and dark gray bars represent relative transcript levels in TT8:GR (Col) DEX/TT8:GR (Col) mock and tt8 (Ws)/WT (Ws), respectively. Results are shown as mean ± se based on three replications (P < 0.05).
Figure 6.
Figure 6.
TT8 directly binds to promoters of key genes. Using ChIP-PCR, enrichment of promoter fragments of target genes was quantified using real-time PCR normalized against actin2. Relative ChIP enrichment was calculated as TT8:GR (Col) DEX/TT8:GR (Col) mock. TT8:GR (Col) lines were treated with 30 µm DEX dissolved in ethanol, while mock was treated with equivalent volume of ethanol. Fold changes were calculated based on ΔΔCt values. Shown are genes associated with CAZy (A), phytohormone biosynthesis (B), and stress response (C). Results are shown as mean ± se based on three replications (P < 0.05). Direct binding of TT8 to promoter regions of these genes results in enriched expression of promoter fragments (P1–P5). The underlined enriched fragments indicate the presence of a known bHLH binding site in that region.
Figure 7.
Figure 7.
tt8 (Ws) leads to enhanced susceptibility, while DEX-induced TT8:GR (Col) overexpression increases resistance against Pst DC3000 infection. A, Disease symptoms in WT (Ws) and tt8 (Ws); B, DEX-induced overexpression of TT8:GR (Col) and mock-treated TT8:GR (Col) lines. Five-week-old Arabidopsis plants were spray-inoculated with a suspension of Pst DC3000 (108 cfu) or mock-treated. The images of plants showing disease symptom were taken 3 d after inoculation. C, Bacterial growth in leaves of WT (Ws), tt8 (Ws), DEX-induced TT8:GR (Col) overexpression, and mock-treated TT8:GR (Col) lines, 3 d after spray inoculation of Pst DC3000 suspension or mock treatment. Results are shown as mean ± se based on three replications (P < 0.05).
Figure 8.
Figure 8.
Under multiple stress conditions, germination of Arabidopsis improves in a TT8-dependent manner. WT (Ws) and tt8 (Ws) were sown directly on 1× MS (2% Suc and 0.6% phytoagar) agar plates. The conditions were as follows: 150 mm NaCl, 250 mm mannitol, 10 mg kg−1 DON, 1 µm ABA, and 100 µm MeJA. TT8:GR (Col) inducible lines were sown similarly for the same treatment conditions except with addition of 30 µm DEX or equivalent volume of ethanol as mock treatment. Number of seeds germinating (three biological replicates with 28 seeds sown for each replicate) each day was calculated under more severe stress conditions of 200 mm NaCl, 500 mm mannitol, 20 mg kg−1 DON, 200 µm MeJA, and 10 µm ABA. For induced overexpression the conditions were similar, except for 15 mg kg−1 DON. Images of 6-d-old seedlings were captured for both tt8 (Ws) and WT (Ws) (A), and DEX-induced TT8:GR (Col) overexpression and mock-treated TT8:GR (Col) lines (B). Germination rates are shown as mean ± sd.
Figure 9.
Figure 9.
Model showing mechanism through which TT8 regulates response to biotic and abiotic stress conditions in Arabidopsis. We show that the metabolite sugar conjugation machinery is coregulated with stress response. The model involves TT8 as a key transcription factor that directly binds to the promoters of genes involved in these two processes. TT8 positively regulates flavonoids and nucleotide glycosylation, and negatively regulates jasmonic acid biosynthesis. Apart from biosynthesis genes, TT8 also regulates expression of several genes associated with stress response. In addition, TT8 regulates the gene expression levels of members of sugar conjugation machinery, such as transferases, hydrolases, transporters, binding proteins, and sugar synthases, which results in increased metabolite diversity. This model shows that TT8 is an integrator of secondary metabolism and stress response.

Similar articles

Cited by

References

    1. Bajguz A. (2007) Metabolism of brassinosteroids in plants. Plant Physiol Biochem 45: 95–107 - PubMed
    1. Bajguz A, Piotrowska A (2009) Conjugates of auxin and cytokinin. Phytochemistry 70: 957–969 - PubMed
    1. Bari R, Jones JD (2009) Role of plant hormones in plant defence responses. Plant Mol Biol 69: 473–488 - PubMed
    1. Baudry A, Caboche M, Lepiniec L (2006) TT8 controls its own expression in a feedback regulation involving TTG1 and homologous MYB and bHLH factors, allowing a strong and cell-specific accumulation of flavonoids in Arabidopsis thaliana. Plant J 46: 768–779 - PubMed
    1. Baudry A, Heim MA, Dubreucq B, Caboche M, Weisshaar B, Lepiniec L (2004) TT2, TT8, and TTG1 synergistically specify the expression of BANYULS and proanthocyanidin biosynthesis in Arabidopsis thaliana. Plant J 39: 366–380 - PubMed

Publication types

MeSH terms