. 2016 Jul 25;213(8):1429-40.
doi: 10.1084/jem.20151618. Epub 2016 Jul 18.

Mutations in STN1 cause Coats plus syndrome and are associated with genomic and telomere defects

Affiliations

Mutations in STN1 cause Coats plus syndrome and are associated with genomic and telomere defects

Amos J Simon et al. J Exp Med. .

Abstract

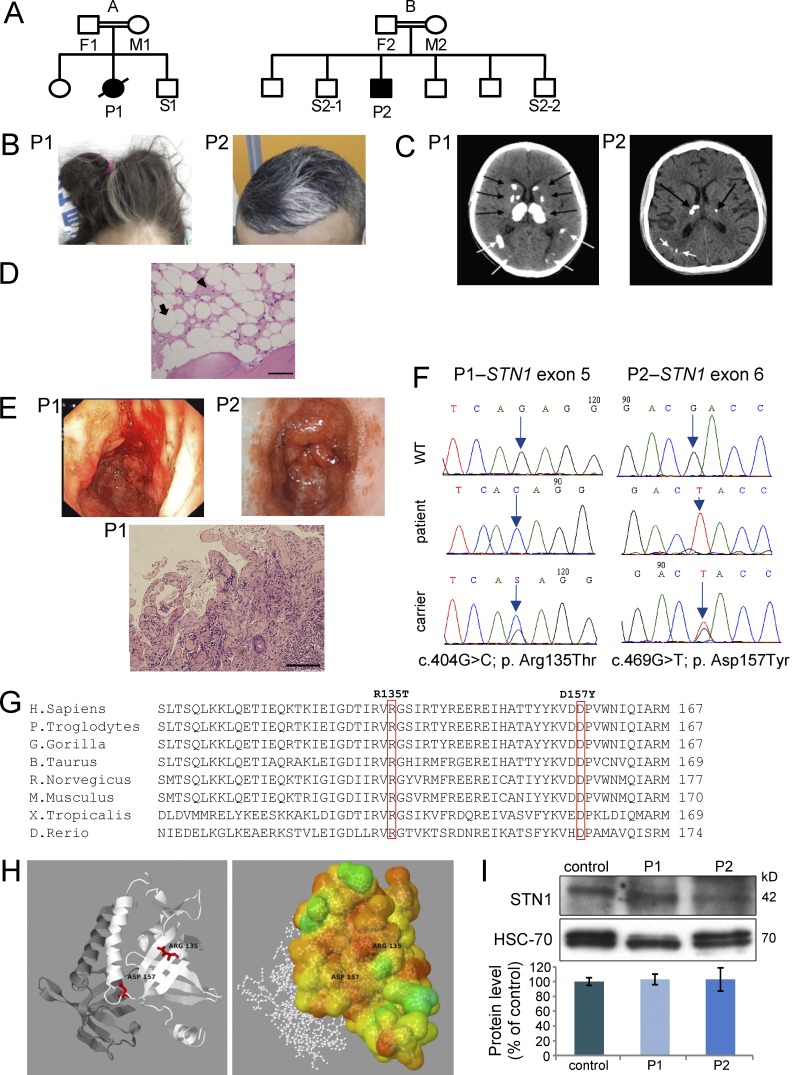
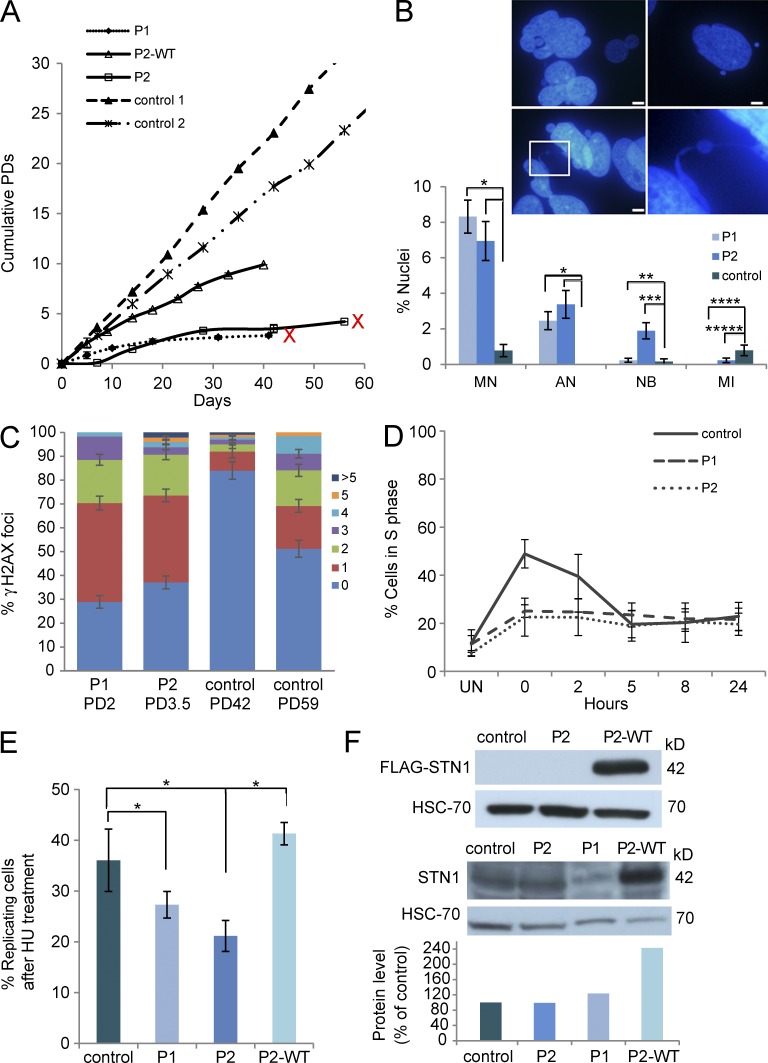
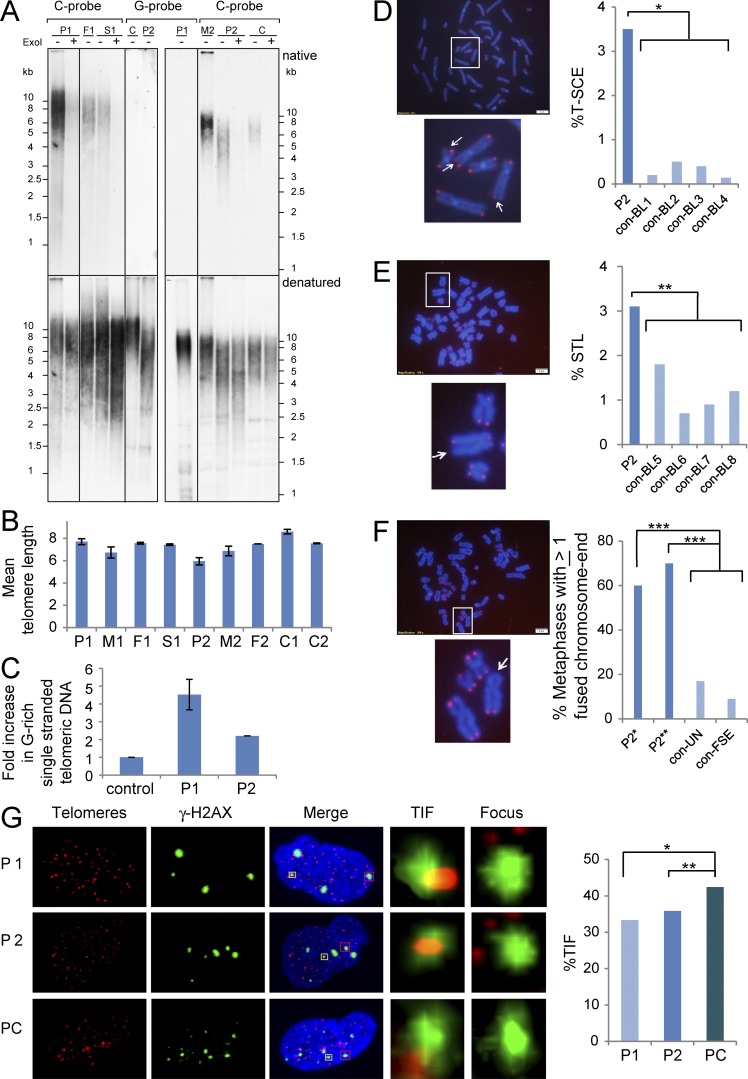
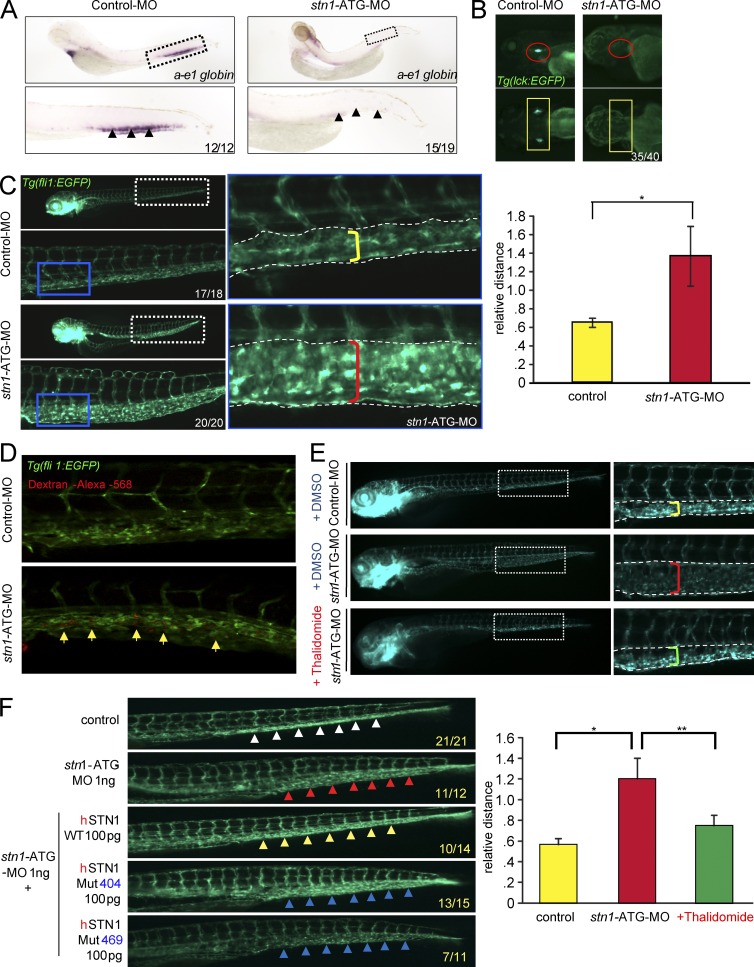
The analysis of individuals with telomere defects may shed light on the delicate interplay of factors controlling genome stability, premature aging, and cancer. We herein describe two Coats plus patients with telomere and genomic defects; both harbor distinct, novel mutations in STN1, a member of the human CTC1-STN1-TEN1 (CST) complex, thus linking this gene for the first time to a human telomeropathy. We characterized the patients' phenotype, recapitulated it in a zebrafish model and rescued cellular and clinical aspects by the ectopic expression of wild-type STN1 or by thalidomide treatment. Interestingly, a significant lengthy control of the gastrointestinal bleeding in one of our patients was achieved by thalidomide treatment, exemplifying a successful bed-to-bench-and-back approach.


Figures

Figure 1.
Figure 1.
Genetics and clinical phenotypes of STN1-mutated patients. (A) Family pedigrees of the affected families (A and B). Solid symbols represent the affected subjects P1 and P2, and open symbols represent unaffected relatives. Squares indicate male subjects, and circles female subjects. A slash indicates a deceased subject. (B) Graying hair. (C) Multiple calcifications (arrows) in brain computerized tomography (CT). (D) Bone marrow trephine biopsy of patient P2. The marrow spaces consist primarily of adipose tissue (white areas; example marked with an arrow) and edematous stroma (pink areas; example marked with an arrowhead). Bar, 20 µm. (E) Endoscopy images are noted in both patients (top). Intestine biopsy of patient P1 (bottom). Images are magnified x600. Size bar – Bar, 20 µm. (F) Dideoxy Sanger sequencing was performed to the different STN1 genotypes detected in the studied pedigrees. (G) Alignment analysis using the NCBI HomoloGene tool was performed. The mutated residues R135 (P1) and D157 (P2) are boxed. The aligned vertebrate orthologues from top to bottom are: human, chimpanzee, gorilla, cow, rat, mouse, frog, and zebrafish. (H) Crystal structures of wild-type hSTN1 in complex with TEN1, but without hCTC1 were available in the PDB (4joi; Bryan et al., 2013). (left) A schematic cartoon view of the STN1 (white) and TEN1 (gray) complex with the position of the two mutations highlighted in red. (right) STN1 molecule is colored according to conservation scores of Consurf (Ashkenazy et al., 2010). 2D images were created based on PDBsum (Laskowski, 2001) images. 3D images were created using Jmol. (I) Western blot analysis to STN1 and to heat shock cognate protein 70 (HSC-70) was performed on PBL samples from the patients and healthy control, followed by densitometry using the ImageJ software. STN1 protein level in the control sample was set to 100%. Data represents three repeated analyses.
Figure 2.
Figure 2.
Mutations in human STN1 result in abnormal cellular phenotypes. (A) Fibroblasts from two healthy controls, the patients P1 and P2, and P2 cells expressing WT STN1 were grown, and cumulative PDs were calculated at each time point. P1 and P2 samples that reached senescence are marked by a red X at the end of the growth curve. P2 fibroblasts expressing WT-STN1 continued to grow without reaching growth arrest as long as they were kept in culture. Data are representative of three independent analyses. (B) Representative nuclei of P1 fibroblasts displaying apoptotisis (top left), micronuclei (top right), and nuclear bridges (bottom). (bottom right) Enlargement of the designated region in the bottom left panel. Bars, 5 µm. The frequencies of micronuclei (MN; *, P < 0.0001), apoptotic nuclei (AN; *, P < 0.0001), nuclear bridges (NB; **, P = 0.7; ***, P = 0.0003), and the mitotic index (MI; ****, P = 0.007; *****, P = 0.08) in P1 and P2 patient fibroblasts and in normal presenescent fibroblasts, appear in the graph below the images. Data represents two to four independent analyses of at least 200 cells per analysis. Statistical analysis was performed by a two-tailed Student’s t test. (C) STN1-mutated fibroblasts P1 (PD 2) and P2 (PD 3.5), and control fibroblasts at two PDs (PD 42 and PD 59) were stained with an antibody for γ-H2AX, and then scored for the number of γ-H2AX foci per cell. The number of foci per cell is depicted by the color code to the right and displayed in the graph as the percentage of total scored cells. At least 100 nuclei were scored for each sample per each independent analysis. Data are representative of two independent repeats for all samples with the exception of the control at PD42, whose analysis was performed once. (D) Patients and control fibroblasts were either untreated (UN) or treated with HU for 48 h, subsequently harvested at 0, 2, 5, 8, and 24 h, and subjected to cell cycle analysis. The percentage of cells in S phase is presented in the graph. Data are representative of three independent experiments. (E) Patients and control fibroblasts were treated with 0.5 mM HU for 48 h, followed by 1-h incubation with 50 µM EdU. EdU incorporation into newly synthesized DNA strands was assayed using the Click-iT EdU Alexa Fluor 488 Imaging kit. The percent of EdU-positive (replicating) cells in control, P1, P2, and P2+WT STN1 (P2-WT) is presented in the graph and represents three independent experiments (*, P < 0.001, two-tailed Student’s t test). (F, top) Western blot analysis of ectopic WT-STN1 expression in P2 fibroblasts, using an anti-FLAG tag antibody. HSC-70 serves as a control for protein loading. The blot represents four independent experiments. (bottom) Western blot analysis of native STN1 expression in control and patients' fibroblasts, and ectopic expression of WT-STN1 in P2 fibroblasts, using anti-STN1 antibodies. HSC-70 serves as a control for protein loading. The protein level in the control sample was set as 100%. The STN1 protein levels in the patient fibroblasts and in P2 fibroblasts ectopically expressing WT-STN1 were compared with the control level. Densitometry was done using the ImageJ software. The presented blot is one of three repetitive independent experiments.
Figure 3.
Figure 3.
Mutations in STN1 result in abnormal telomere phenotypes. (A) DNA samples, prepared from PBLs of patient P1, her heterozygous father (F1), and a noncarrier sibling (S1) and patient P2, his heterozygous mother (M2), and two independent control samples (C), were analyzed by in-gel hybridization. Duplicated lanes were electrophoresed in the same gel, and then separated and hybridized to a G-rich or C-rich telomeric probe, as indicated above the panels. After native hybridization to detect single-stranded telomeric DNA (top), the gels were denatured and rehybridized with the same probes to detect the overall duplex telomeric DNA (bottom). Treatment with exonuclease I is indicated above the lanes. (B) Graphic illustration of the mean telomere length for the patients and their family members, calculated based on the following number of independent measurements of four in-gels and two Southern analyses: P1:6, M1:3, F1:3, S1:3, P2:9, M2:3, F2:1, C1:2, and C2:3. (C) Graphic illustration of the relative native (single strand) per denatured (total) telomeric signal, normalized to the controls. The values represent the mean of four independent measurements for P1 and four for P2. (D, top) A metaphase spread from P2 PBL after CO-FISH. Bar, 5 µm. The area designated by the white frame in enlarged in the bottom panel. Arrowheads point to chromosome ends with hybridization signals on both sister chromatids, indicating that T-SCE occurred at that chromosome end. (right) The frequency of T-SCE in P2 PBLs is compared with PBLs from four age-matched controls (con-BL1-4). For P2 PBLs, 1,150 chromosome ends were analyzed. For control PBLs, between 600 and 930 telomeres were analyzed (*, P < 0.0001; two-tailed Student’s t test). (E, top) A metaphase spread after telomere-FISH. Bar, 5 µm. The area designated by the white frame in enlarged in the bottom panel. Arrow points to a chromosome end missing one signal (STL, sister telomere loss). The frequencies of STLs (percentage of missing signals) are presented in the right panel in comparison to PBLs from four age-matched controls (con-BL5-8). For P2 PBLs, 1,548 chromosome ends were analyzed. For control PBLs, between 1,072 and 1,126 chromosome ends were analyzed (**, P < 0.05; two-tailed Student’s t test). (F, top) A metaphase spread of P2 fibroblasts after telomere-FISH. Bar, 5 µm. The area designated by the white frame in enlarged in the bottom. Arrow points to fused chromatids at a telomeric region with a missing hybridization signal. (right) The frequency of metaphase spreads containing at least one chromosome end with fused chromatids. This parameter was determined in P2 fibroblasts at two-time points of growth (P2*, passage 4+3.2 PDs; 16 metaphases, P2**, passage 4+4.4 PDs; 14 metaphases). Two control fibroblasts were analyzed: con-UN (passage 3 + 4.5 PDS; 12 metaphases) and con-FSE (passage 6 + 14.8 PDs; 11 metaphases; ***, P < 0.007, two-tailed Student’s t test). (G) TIF analysis was performed on STN1-mutated and control presenescent normal fibroblasts (PC). Each row displays a representative nucleus. Telomere signals appear in red and γ-H2AX foci in green. The DNA in the merged nucleus is stained with DAPI. The enlarged regions contain either a TIF (regions enclosed by yellow boxes in the merged image) or a γ-H2AX focus without a telomere signal (regions enclosed by red boxes in the merged image). (right) A graphic representation of TIF levels detected in the analyzed fibroblasts (for P1, *, P = 0.12; for P2, **, P = 0.4; two-tailed Student’s t test).
Figure 4.
Figure 4.
A zebrafish model for human STN1 deficiency. (A) To detect anemia in situ hybridization was performed on control and stn1-ATG-morphant embryos at five days after fertilization (dpf) using an anti-sense ɑ-e1 probe. The regions depicted by the boxes in the upper images are enlarged below. Arrows indicate caudal hematopoietic tissue (CHT; lateral view). The number of embryos demonstrating this hybridization pattern out of the total screened embryos appears in the lower right corner. (B) Tg(lck:EGFP) zebrafish embryos were treated with control-MO or stn1-ATG-MO and effects on T cell development were revealed by alterations in lck:EGFP expression (lateral view, red circles; dorsal view, yellow rectangles). The number of embryos demonstrating this phenotype out of the total screened embryos appears in the bottom right corner. (C) Telangiectasis phenotype was determined in stn1 knockdown zebrafish. The yellow and red brackets in the insets on the right indicate the vascular bed widths in control WT and the stn1-knockdown embryos, respectively. The abnormal dilation of vessels and expansion of the vascular bed in the tail region are apparent in a representative 3dpf Tg(fli1:EGFP) embryo. Relative width of the vascular bed was calculated and normalized to control embryos (yellow bracket n = 3, each group), as shown in the graph on the right (*, P = 0.019; two-tailed Student’s t test). (D) Micro-angiography on Tg(fli1:EGFP) zebrafish embryos injected with dextran-alexa-568 at three dpf. Confocal microscopy was performed on fixed embryos. Yellow arrows indicate regions of accumulation of dextran at the CHT in stn1 morphants. (E) Telangiectactic changes in vasculature were detected after thalidomide treatment. Tg(fli1:EGFP) embryos treated with stn1-ATG-MO or Control-MO were incubated with thalidomide (15 µg/ml) from one to three dpf. Relative width of the vascular bed was quantified in control fish and in stn1 morphants with or without thalidomide treatment and expressed graphically, as below (*, P = 0.006; **, P = 0.018; two-tailed Student’s t test). (F) Telangiectactic changes in vasculature were detected after reexpression of wild type human STN1 (hSTN1). Tg(fli1:EGFP) zebrafish embryos were injected with stn1-ATG morphants alone or in conjunction with mRNA encoding WT human STN1 or STN1 bearing either of the patient mutations (Mut404, Mut469). The embryos were photographed at five dpf. White arrows, normal vessel phenotype; Red arrows, telangiectactic phenotype in stn1-ATG morphants; yellow arrows, co-injection with 100 pg WT hSTN1 mRNA. In all panels, the numbers at the bottom right indicate the fraction of embryos exhibiting the depicted phenotype.

References

    1. Anderson B.H., Kasher P.R., Mayer J., Szynkiewicz M., Jenkinson E.M., Bhaskar S.S., Urquhart J.E., Daly S.B., Dickerson J.E., O’Sullivan J., et al. . 2012. Mutations in CTC1, encoding conserved telomere maintenance component 1, cause Coats plus. Nat. Genet. 44:338–342. 10.1038/ng.1084 - DOI - PubMed
    1. Armanios M., and Blackburn E.H.. 2012. The telomere syndromes. Nat. Rev. Genet. 13:693–704. 10.1038/nrg3246 - DOI - PMC - PubMed
    1. Ashkenazy H., Erez E., Martz E., Pupko T., and Ben-Tal N.. 2010. ConSurf 2010: calculating evolutionary conservation in sequence and structure of proteins and nucleic acids. Nucleic Acids Res. 38:W529-W533 10.1093/nar/gkq399 - DOI - PMC - PubMed
    1. Boccardi V., Razdan N., Kaplunov J., Mundra J.J., Kimura M., Aviv A., and Herbig U.. 2015. Stn1 is critical for telomere maintenance and long-term viability of somatic human cells. Aging Cell. 14:372–381. 10.1111/acel.12289 - DOI - PMC - PubMed
    1. Bodnar A.G., Ouellette M., Frolkis M., Holt S.E., Chiu C.P., Morin G.B., Harley C.B., Shay J.W., Lichtsteiner S., and Wright W.E.. 1998. Extension of life-span by introduction of telomerase into normal human cells. Science. 279:349–352. 10.1126/science.279.5349.349 - DOI - PubMed

Publication types

MeSH terms

Supplementary concepts