. 2016 Jul 25;213(8):1399-407.
doi: 10.1084/jem.20151604. Epub 2016 Jul 18.

TNF activation of NF-κB is essential for development of single-positive thymocytes

Affiliations

TNF activation of NF-κB is essential for development of single-positive thymocytes

Louise V Webb et al. J Exp Med. .

Abstract

NF-κB activation has been implicated at multiple stages of thymic development of T cells, during which it is thought to mediate developmental signals originating from the T cell receptor (TCR). However, the Card11-Bcl10-Malt1 (CBM) complex that is essential for TCR activation of NF-κB in peripheral T cells is not required for thymocyte development. It has remained unclear whether the TCR activates NF-κB independent of the CBM complex in thymocyte development or whether another NF-κB activating receptor is involved. In the present study, we generated mice in which T cells lacked expression of both catalytic subunits of the inhibitor of κB kinase (IKK) complex, IKK1 and IKK2, to investigate this question. Although early stages of T cell development were unperturbed, maturation of CD4 and CD8 single-positive (SP) thymocytes was blocked in mice lacking IKK1/2 in the T cell lineage. We found that IKK1/2-deficient thymocytes were specifically sensitized to TNF-induced cell death in vitro. Furthermore, the block in thymocyte development in IKK1/2-deficient mice could be rescued by blocking TNF with anti-TNF mAb or by ablation of TNFRI expression. These experiments reveal an essential role for TNF activation of NF-κB to promote the survival and development of single positive T cells in the thymus.


Figures

Figure 1.
Figure 1.
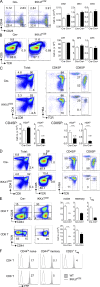
Deletion of Ikk1 and Ikk2 blocks SP thymocyte development. Lymphoid organs from 8–12-wk-old Ikk1fx/fx Ikk2fx/fx R26REYFP huCD2iCre (IKKΔTCD2, n = 16) were analyzed by FACS and compared with huCD2iCre -ve (Cre, n = 15) littermate as control. (A) Density plots are of CD44 versus CD25 by DN Lin (CD4, CD8, TCRαβ, and CD5) thymocytes. Numbers indicate percentage in the corresponding quadrant. Bar charts are cell number of CD44hiCD25hi (DN2), CD44loCD25hi (DN3), and CD44lo CD25lo (DN4) DN thymocyte subsets. (B) Density plots are of TCR versus CD5. Numbers indicate percentage in the corresponding gate. Bar charts are cell number of CD5loTCRlo (DP1), CD5hiTCRint (DP2), and CD5intTCRhi (DP3) DP subsets. (C) Density plots are of CD4 versus CD8 expression by total live thymocytes and TCR versus HSA by CD4SP and CD8SP gated thymocytes. Bar charts show numbers of the indicated SP subset from IKKΔTCD2 mice (Cre+) and huCD2iCre -ve (Cre) littermates. Numbers indicate fold difference in counts between Cre and Cre+. (D) Density plots are of CD4 versus CD8 expression by total live thymocytes, TCR versus CD5 by DP thymocytes, and TCR versus HSA by CD4SP and CD8SP gated thymocytes from IKKΔTCD4 mice or Cre littermates. (E) Density plots are CD25 versus CD44 by CD4+TCRhi gated lymph node cells and CD44 versus TCR by CD8+TCRhi gated lymph node cells from the indicated strains and show gates used to define naive (CD44lo CD25), memory (CD44hi CD25), and T reg (CD25+) cells among CD4+TCRhi cells, and naive (CD44lo) and memory (CD44hi) among CD8+TCRhi cells. Bar charts show total number of naive, memory, and T reg cells recovered from lymph node and spleen of IKKΔTCD2 mice (Cre+) and huCD2iCre -ve (Cre) littermates. Numbers indicate fold difference in naive cell counts between Cre and Cre+ hosts. (F) Histograms are of EYFP expression by naive, memory, and regulatory CD4+TCRhi T cells and naive and memory CD8+TCRhi T cells from IKKΔTCD2 mice and huCD2iCre Ikk1fx/WT Ikk2fx/WT R26REYFP littermate controls (WT). Numbers indicate percentage of IKKΔTCD2 cells (solid lines) expressing YFP. FACS data are representative of four or more experiments and cell number data are pooled from four experiments. ****, P < 0.0001.
Figure 2.
Figure 2.
TNF induces thymocyte cell death in the absence of IKK activity in vitro. (A) Thymocytes from Ikk1fx/fx Ikk2fx/fx R26REYFP CD4Cre (IKKΔTCD4) mice were cultured overnight with the indicated Tnfrsf member, and viability of the indicated SP subset assessed the next day by FACS. (B) Thymocytes from IKKΔTCD4, Cre -ve littermates (Cre -ve), and Tnfrsf1a−/− donors were cultured overnight with and without TNF (30 ng/ml). Bar chart shows viability among the indicated subsets cultured with addition of PBS (open bars) or TNF (filled bars) as assessed by FACS. (C) Thymocytes from WT and Ikk1fx/fx R26REYFP huCD2iCre donors were cultured overnight in the presence of TNF or IKK2 inhibitor Bl605906, or both. Bar chart shows percentage of viability among the indicated subsets as assessed by FACS. (D) Ikk1fx/fx R26REYFP huCD2iCre thymocytes were cultured for 4 h in the presence of TNF and/or IKK2 inhibitor Bl605906. Density plots are of live dead versus active caspase 8 stain by CD8 SP thymocytes. (E) Thymocytes from Ikk1fx/fx R26REYFP huCD2iCre donors were cultured with IKK2 inhibitor and a titration of TNF. Line graph shows the percentage of maximum TNF-induced death for different concentrations of TNF, above background, for the indicated subsets. Concentrations in figure legend indicate LD50 of TNF for the corresponding subset. (F) Thymocytes from WT or Ikk1fx/fx R26REYFP huCD2iCre donors were pre-incubated with IKK2 inhibitor Bl605906 or DMSO vehicle for 1 h where indicated, and then stimulated with TNF and nuclear extracts prepared at different times. Bar charts represent RelA binding to NF-κB binding oligonuclotides as detected by ELISA and displayed as OD. Dotted line indicates the background signal from blank wells. (G) Thymocytes from pLck-IκB-PEST donors or transgene -ve littermates were cultured in different concentrations of TNF overnight. Line graphs are of percentage dead cells in the indicated subsets from pLck-IκB-PEST donors (IκB-PEST, filled circles) or transgene negative litter controls (WT, open circles). Error bars indicate SD of technical duplicates. Data are representative of two (F), three (G), or more (A–E) independent experiments. *, P < 0.05; ***, P < 0.001.
Figure 3.
Figure 3.
TNF blockade rescues SP development in IKKΔTCD4 mice. (A and B) Ikk1fx/fx Ikk2fx/fx R26REYFP CD4Cre (IKKΔTCD4) mice (8–16 wk old) were treated with anti-TNF mAb i.p. (1 mg/inject; n = 16) or PBS as control (n = 17). After 7 d, thymus and lymph node cells were analyzed by FACS. (A) Density plots are of TCR versus HSA expression by CD4SP (top row) and CD8 SP (bottom row) from IKKΔTCD4 mice treated with anti-TNF or PBS as compared with untreated Cre -ve littermate controls (Cre, n = 17). Bar charts show total cell recoveries of HSAhi and HSAlo cells among CD4SP (top row) and CD8SP (bottom row). (B) Density plots are of CD44 versus CD25 by CD4+TCRhi T cells (top row) and CD44 versus TCR by CD8+ cells from lymph nodes of the same treatment groups described in A. Bar charts show cell numbers of naive CD4 (top chart) and naive CD8 (bottom chart) T cells from mice. (C) Density plots are of CD4 versus CD8 by total live thymocytes (top row), and TCR versus HSA by CD4SP (middle row) and CD8SP thymocytes (bottom row) from IKKΔTCD4 mice, Cre -ve littermate controls (Cre), Tnfrsf1a−/− IKKΔTCD4 mice (n = 16), and Cre -ve littermate controls (Tnfrsf1a−/− Cre, n = 13). (D) Bar charts show cell numbers of the indicated SP subset recovered from IKKΔTCD4 mice treated with anti-TNF (αTNF) or PBS as described in A, untreated Cre -ve littermates (Cre), or Tnfrsf1a−/− IKKΔTCD4 mice and Cre -ve littermate controls (Tnfrsf1a−/− Cre). (E) Bar charts show total numbers of naive CD44lo CD25 CD4+ TCRhi T cells and naive CD44lo CD8+ TCRhi T cells from lymph nodes of Ikk1fx/fx Ikk2fx/fx R26REYFP CD4Cre (IKKΔTCD4, n = 17) mice, Cre -ve littermates (Cre, n = 17), Tnfrsf1a−/− IKKΔTCD4 mice (n = 16), and Cre -ve littermate (Cre– Tnfrsf1a−/−, n = 13) as control. Histograms are of IL-7Rα by gated naive CD44lo CD25 CD4+ TCRhi T cells (top) and naive CD44lo CD8+ TCRhi T cells (bottom) from WT (black broken lines), Tnfrsf1a−/− IKKΔTCD4 mice (red solid lines) and Cre -ve Tnfrsf1a−/− littermates (solid line). Gray fills are IL-7Rα expression by DP thymocytes from WT mice as negative control. FACS data are representative of four or more independent experiments, and bar charts are pooled from four or more independent experiments. ****, P < 0.0001.
Figure 4.
Figure 4.
TNF blockade rescues the developmental block in pLck IκB-PEST mice. pLck IκB-PEST mice were treated with anti-TNF (n = 8; 1 mg, days 0, 2, and 4) or PBS (n = 8) injection as control. At day 7, thymi were analyzed by FACS. Density plots are of CD4 versus CD8 by total live (top row) and HSA versus TCR by CD8SP gated thymocytes from pLck IκB-PEST mice treated with either anti-TNF (αTNF) or PBS as control. Transgene -ve (WT, n = 4) littermates were also analyzed as control. Bar charts show total cell numbers of the indicated thymocyte subset recovered from the indicated treatment groups. Data are pooled from two independent experiments. **, P < 0.01.
Figure 5.
Figure 5.
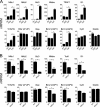
cIAP1 and cIAP2 expression is induced by TNF in vitro and is NF-κB dependent in vivo. (A) TCRhi CD8SP thymocytes from F5 Rag1−/− donors were sort purified and stimulated with TNF (n = 4) or PBS (n = 4) as control. mRNA was isolated from cultured and uncultured cells (0 h, n = 3) and gene expression determined by RNAseq analysis. Bar charts show mRNA expression level (normalized reads per kb exons per million reads, nRPKM) of the indicated genes. Names in brackets indicate protein name associated with gene. (B) TCRhi CD8SP thymocytes were sorted from WT (n = 3) and Tnfrsf1a−/− IKKΔTCD4 mice (n = 4). mRNA was purified and gene expression was determined by RNAseq analysis. Bar charts show mRNA expression level (nRPKM) of the indicated genes. Individual RNAseq libraries were generated from independent cell preparation and treatments. *, P < 0.05.

Similar articles

Cited by

References

    1. Anders S., and Huber W.. 2010. Differential expression analysis for sequence count data. Genome Biol. 11:R106 10.1186/gb-2010-11-10-r106 - DOI - PMC - PubMed
    1. Bonizzi G., and Karin M.. 2004. The two NF-κB activation pathways and their role in innate and adaptive immunity. Trends Immunol. 25:280–288. 10.1016/j.it.2004.03.008 - DOI - PubMed
    1. Brocke-Heidrich K., Ge B., Cvijic H., Pfeifer G., Löffler D., Henze C., McKeithan T.W., and Horn F.. 2006. BCL3 is induced by IL-6 via Stat3 binding to intronic enhancer HS4 and represses its own transcription. Oncogene. 25:7297–7304. 10.1038/sj.onc.1209711 - DOI - PubMed
    1. Chen X., Willette-Brown J., Wu X., Hu Y., Howard O.M., Hu Y., and Oppenheim J.J.. 2015. IKKα is required for the homeostasis of regulatory T cells and for the expansion of both regulatory and effector CD4 T cells. FASEB J. 29:443–454. 10.1096/fj.14-259564 - DOI - PMC - PubMed
    1. Chu Z.L., McKinsey T.A., Liu L., Gentry J.J., Malim M.H., and Ballard D.W.. 1997. Suppression of tumor necrosis factor-induced cell death by inhibitor of apoptosis c-IAP2 is under NF-κB control. Proc. Natl. Acad. Sci. USA. 94:10057–10062. 10.1073/pnas.94.19.10057 - DOI - PMC - PubMed

Publication types

MeSH terms